Moving average percent measureit's just an average moving multiplied by a percentage. this is good for measuring the acceleration of price movements
Average

Мarket Breadth LabelsHistory and credits
The idea about this indicator, came from a friend teodorgun. www.tradingview.com
Special thanks to QuantNomad, whose courses got me started on programming on PineScript. www.tradingview.com
What it does
The indicator plots various values from market breadth indicators.
It shows the % stocks above certain moving averages for different indexes.
The first 3 cells, display the Advance Decline Ratios:
1. Total Advance Decline Ratio
2. NYSE Advance Decline Ratio
3. Nasdaq Advance Decline Ratio
- coloring for these is simple (value > threshold = color is green, value < threshold = color is red)
The rest of the columns display % stocks above the moving averages.
For example a value of 20 in column 4 ("Stocks above 5D MA), means that only 20% of the stocks are above their 5D moving average.
Line 1 shows current value of the indexes.
Line 2 shows value 5days ago (assuming that 5 trading days = 1 trading week).
- Line 1 Coloring: coloring here is divided between 2 tresholds ( value < lower treshold = color is red, value > lower treshold AND value < higher treshold = color is yellow, value > higher treshold = color is green)
- Line 2 Coloring: no coloring logic is applied here.
How to use it
There are several techniques for breadth indicators, many can be read online, but generally these indicators are considered contrarian. This means that high values indicate overbought conditions and low values indicate oversold conditions.

Average Candle RangeThis indicator calculates for you the average candle range for the current 24H trading session for the selected timeframe. The calculation starts from 00:00UTC until the current moment. The indicator is not time zone dependent, works well on every time zone.

RSI Average Swing BotThis is a modified RSI version using as a source a big length(50 candles) and an average of all types of sources for candle calculations such as ohlc4, close, high, open, hlc3 and hl2.
In this case we are going to use a 0-1 scale for an easier calculation, where 0.5 is going to be our middle point.
Above 0.5 we consider a bullish possibility.
Below 0.5 we consider a bearish possibility.
I made a small example bot using that initial logic, together with 2 exit points for long or short positions.
If there are any questions, let me know !

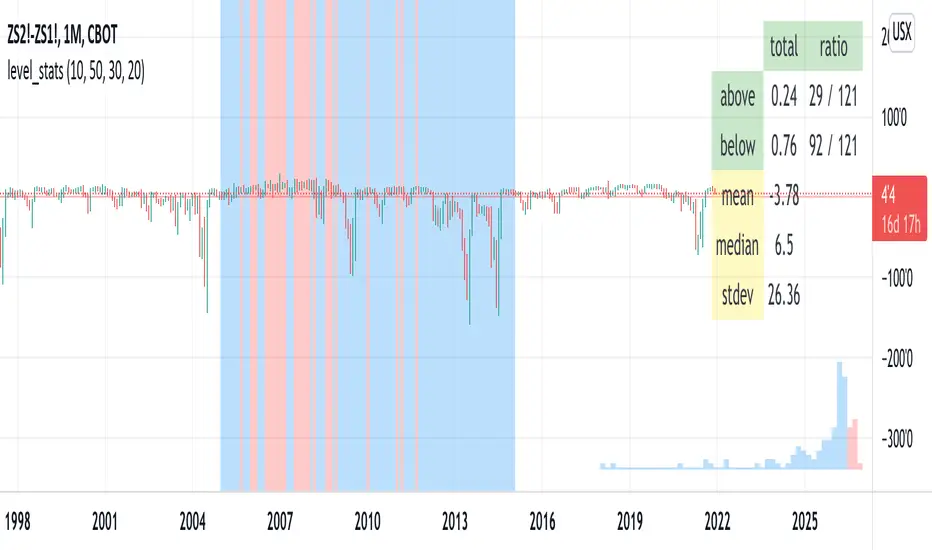
level_statsThis script tells you the percentage of time an instrument's closing value is above and below a level of your choosing. The background color visually indicates periods where the instrument closed at or above the level (red) and below it (blue). For "stationary-ish" processes, you can get a loose feel for the mean, high, and low values. The historical information conveyed through the background coloring can help you plan derivatives trades. Try with your favorite pairs, commodities, or volatility indices.
Usage: pick a level of interest using the input.
MAROC Fast/SlowNot sure if a similar indicator already exist, so I created my own. After creating this indicator, I realize it looks very similar to MACD. However, it strictly uses Hull moving average in its calculation for the lines.
MAROC is simply Moving Average Rate of Change. This is a trend-following indicator that calculates the rate of change on two Hull moving averages. By default it calculates the ROC on 60-period HMA (green and red) and 180-period HMA (blue and orange). The zero line represents the confirmation of change in trend. Above zero is up trend and below zero is down trend. Note the difference between the "trend reversal" and the "confirmation of a trend". I like to define trend reversal by the change in direction
The colored squares on the zero line has 4 colors that represents the overall trend. Here I include the slowdown of MAROC as the start of a trend.
- bright green = when both the slow and fast MA are trending up
- faded green = when slow MA trending up, but fast MA trending down
- faded red = when slow MA trending down, but fast MA trending up
- bright red = when both the slow MA and fast MA are trending down
Trend changes triangles are shown to signal the change in trend direction (trend reversal). Green and blue triangles are trend reversal to the upside. Red and orange triangles are trend reversal to the downside.
This indicator includes the option of displaying buy(long) and sell(short) signals that follows these rules. Use at your own discretion, as it may not apply well with your market or ticker.
- Long = Bright green square and either fast or slow MAROC changes trend direction to the upside
- Short = Bright red square and either fast or slow MAROC changes trend direction to the downside
Enjoy~! Please let me know if you find this useful and which market / ticker and timeframe you are using it on~ :)

Fibonacci Moving AverageThe Fibonacci Moving Average is a powerful indicator that takes into account many underlying moving averages to give out an approximate short-term/long-term view of the markets. Its strength lies with dynamic support and resistance levels. I have created this indicator in order to improve trend-following entry positions.

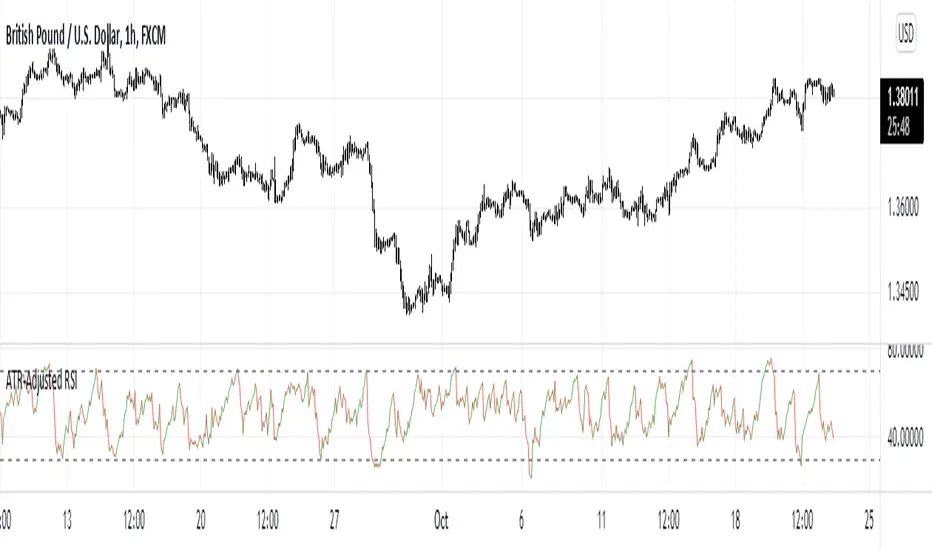
ATR-Adjusted RSIThis indicator adjusts the RSI values using the Average True Range. It is used the same way as a normal RSI.
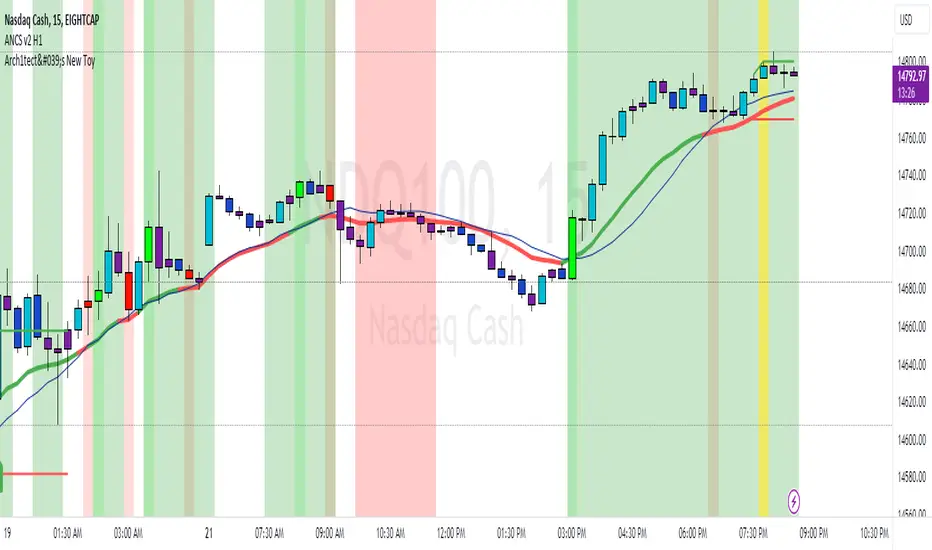
Arch1tect's New ToyDescription:
Arch1tect's New Toy tries to predict market trends by simply utilising 2 moving averages crossovers.
How it works:
Buy signals are triggered when the faster MA crosses over the slower MA from the downside to the upside.
Sell signals are triggered when the faster MA crosses under the slower MA from the upside to the downside.
How to use:
Take buys when buy signal is triggered AND close existing sell position
Take sells when sell signal is triggered AND close existing buy position
Note:
Settings are optimised for XAUUSD on the M1 chart.
Extra:
Alerts are included.
You can toggle between EMA , WMA and SMA to your liking.
Strategy Tester version:
ADR: Average Daily RangeVery basic script... adjust the EMA to 13 for stocks, and less volatile assets. 26 for crypto, and anything highly volatile.
When the Daily Low line (bottom yellow/orange line) dips hard, and finds support for 3+ bars somewhere, this is a sign of a trend reversal. For a solid confirmation, wait for the Super Average and EMA to spike downwards as well. All of this can also be seen as reversal at the top of a trend, just upturned.
The 2 Daily lines (2 yellow/orange lines) act as support for the price to bounce off of. Fine tuning is required to get these really smooth, but it's a simple enough idea.
Edit: Screwed up the EMA in my posted example. Should be 26.

Arch1tect's New Toy (Strategy Tester Version)Description:
The version of Arch1tect's New Toy indicator with Strategy Tester added.
This indicator tries to predict market trends by simply utilising 2 moving averages crossovers.
How it works:
Buy signals are triggered when the faster MA crosses over the slower MA from the downside to the upside.
Sell signals are triggered when the faster MA crosses under the slower MA from the upside to the downside.
How to use:
Take buys when buy signal is triggered AND close existing sell position
Take sells when sell signal is triggered AND close existing buy position
Note:
Settings are optimised for XAUUSD on the M1 chart.
Extra:
Alerts are included.
You can toggle between EMA, WMA and SMA to your liking.
Indicator version:

ADR PercentUses past 5 day's daily average ranges and calculates average ADR percentage with respect to latest day's open
Acknowledgement - Uses code from another excellent indicator from critian.d

Vision Essentials - MACDVision Essentials - MACD is the second indicator in our Essentials pack. It's a fully customizable MACD indicator with some extra perks the Vision team feels provides helpful & simplified insight when studying a chart.
What makes this indicator different?
Under the Standard mode you'll feel right at home compared to a standard macd indicator. Our Advanced mode is where things change a bit more. Under Advanced mode outside of the visual customization we provide visual outputs identifying bullish/bearish crossovers of the macd & signal, and track the high and low points of the macd with a second set of colors which users can customize. We also plot text in these areas so there's a clear indication of what the changing colors mean.
How do I use this indicator?
To start, it's best you have an understanding of what MACD (moving average convergence divergence) is. There are lots of great educational ideas here on TradingView which we recommend absorbing. We highly recommend you start with this article directly from the TradingView Help Center
Settings
MACD Mode - Standard provides you with a closer to traditional style MACD whereas Advanced at a glance highlights areas such as crossover points, highs, lows, and current direction relative to histogram movement.
MACD Settings - Select the source & values used for the macd calculations. close is the most commonly used source, and 12/26/9 are the most common length values. Adjust these to see how the indicator behaves. Lowering the fast and slow values will result in more activity, but be aware that doesn't = more accuracy.
Standard Visual Settings - STANDARD MODE: These settings will adjust the color you want to use as an indication of bullish & bearish movement.
Advanced Visual Settings - ADVANCED MODE: Use these settings to adjust the color you want to use as an indication of bullish, bearish, recent macd highs, recent macd lows, and text color.
High/Low Distance - ADVANCED MODE: This setting defines how far back the indicator looks to find the most recent highs/lows of macd.
Enable Crossover Bars - ADVANCED MODE: This settings enables the vertical bars that connect the center of the histogram to the macd/signal "wave" to indicate where crossovers are happening.

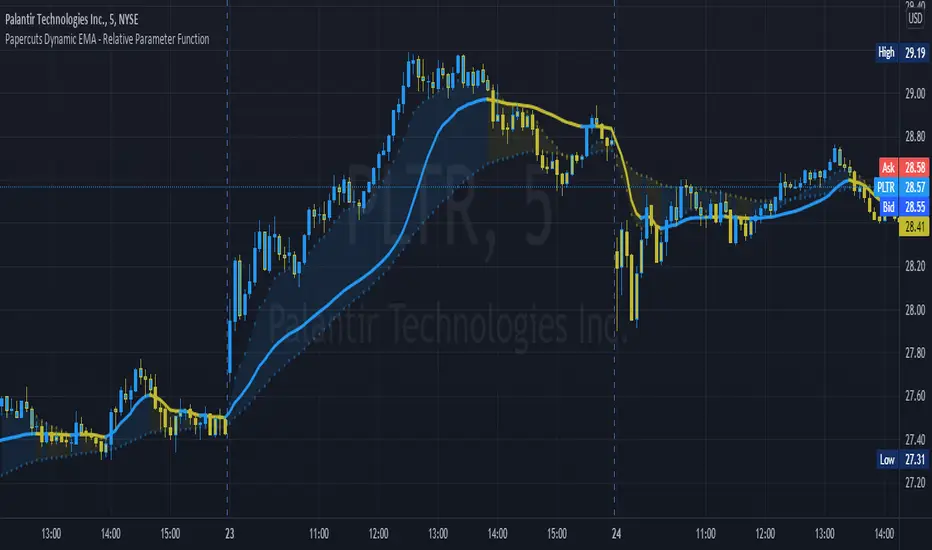
Papercuts Dynamic EMA - Relative Parameter FunctionThe goal of this is to link two parameters of different known low and high values so one affects the other.
In this case, I want to link Relative Volume to the length of an EMA, so it responds faster in times of high volume.
As an animator I am used to linking values in this way with Maya using a set driven key, took some work to figure it out in pine.
Looking up this concept, it has a few names, Relative values, linear interpolation, or rescale values.
Thanks to pinecoders for writing the EMA funciton that can accept length variables!
Here's a quick look at the root function to link the two values.
f_relativeVal(_source, in_bot, in_top, out_bot, out_top) =>
// float _source: input signal
// float in_bot : minimum range of input signal.
// float in_top : maximum range of input signal.
// float out_bot : minimum range of output signal.
// float out_top : maximum range of output signal.
clampSrc = _source > in_top ? in_top : _source < in_bot ? in_bot : _source //claps source to create a controlled range
//relInput = (clampSrc - in_bot) / (in_top - in_bot) * 100
inDiffIncrement = (in_top - in_bot)
outDiffIncrement = (out_top - out_bot)
out_bot + (clampSrc - in_bot) * outDiffIncrement / inDiffIncrement // rescale input range to output range
Complete MA DivisionThis indicator simply divides two moving averages and calculates the slope of the resulting curve to show when an asset's momentum is slowing down. The original idea was in a recent youtube video by Ben Cowen . His indicator didn't show the complete history of the moving average, so I wanted to try a little trick to get the moving averages at the beginning of time even when using a large moving average period. I accomplished this by counting the number off current bars using the cum() function. After the count is hit, the period will be constant.
Changing the curve smoothing will smooth the actual curve. Both moving average periods should be divisible by the curve smoothing.
Changing the slope smoothness will dictate when the slope is starting to slow down. Keep this high to break through the noise.
Start of Red = Good time to sell
Start of Green = Good time to buy
There is a weird issue with the smoothness of the line so just keep your moving averages divisible by the curve smoothing. I couldn't figure that issue out yet.

Multi-Length Stochastic Average [LuxAlgo]This indicator returns the average of stochastic oscillators with periods ranging from 4 to length . This allows for a slightly more reactive oscillator as well as having information regarding the position of the price relative to rolling maximums/minimums of different periods.
We introduce settings that allow for pre and post-smoothing, with selectable smoothing methods and periods for both steps.
Settings
Length: Period of the indicator, determine the maximum period of the stochastic oscillator used in the average
Source: Source input of the indicator
Pre-Smoothing (1st Input): Degree of smoothing applied to the source input
Pre-Smoothing (2nd Input): Pre-Smoothing Method
Post-Smoothing (1st Input): Degree of smoothing applied to the final oscillator output
Post-Smoothing (2nd Input): Post-Smoothing Method
Smoothing methods include a simple moving average, a triangular moving average, and a least-squares moving average (this method can induce overshoots during the post-smoothing step). The user can also select "None".
Usages
The "multi-length" aspect of technical indicators is something that hasn't been deeply explored yet such indicators can give us information regarding both short-term and long-term information which was the motivation for the creation of the indicator.
The Multi-length Stochastic Average allows us to quantify the price position relative to a multitude of highest/lowest levels.
In the example above the oscillator returns the average of stochastic oscillators with periods ranging from 4 to 20, as well as multiple rolling minimums with periods ranging from 4 to 20. We can see that when the price is equal to all rolling minimums the oscillator is equal to 0, the oscillator would return 100 if the price were equal to all rolling maximums with periods in that same range.
The oscillator can be interpreted like any scaled oscillator and can be used to estimate trend direction as well as trend strength.
Here we only make of use pre-smoothing by using a period 20 simple moving average. The indicator graphical elements such as colors/circles can help us determine potential directions trends might take.
Circles are displayed when the oscillator crosses over/under the 20/80 level. Such conditions offer better timing than waiting for the oscillator to be greater/lower than 50 and are less subjective to noise than simply looking at the direction taken by the oscillator. However, it can suffer from potential retracements in a trend more easily, this is illustrated in the chart above.

Average Highest High and Lowest Low Swinger StrategyThis is a full price action strategy designed for trending markets such as crypto and stocks.
Its purely made on calculations for the highest high and lowest low using 2 different length , a faster and a slower one.
With those we make multiple averages.
Rules for entry:
For long: our close of the candle is above both the average using fast and slow line
For short: our close of the candle is below both the average using fast and slow line
Rules for exit
We always exit when we have an opposite order
Caution
This strategy use no risk management system, so be careful with it
If you have any questions, let me know

Trend System Multiple Moving Averages RatingThis is a trend system made with multiple moving averages designed especially for trending markets such as stocks or crypto.
It can be used with any timeframe.
Its made of multiple moving averages such as
Simple
Weighted
Volume Weighted
Exponential
Double EMA
Arnaud Legoux
Hull MA
Smoothed
Least Squares
Kaufman Adaptive
Triple EMA
Zero Lag
Fractal Adaptive
Variable Index Dynamic Average
Jurik Moving Average
Tillson
Triangular
Avg of all moving averages
It has also a rating, making an avg from all of the moving averages , going from -100 (all ma's are telling to go short ) to 100 ( all ma are telling to go long).
If you have any questions let me know !

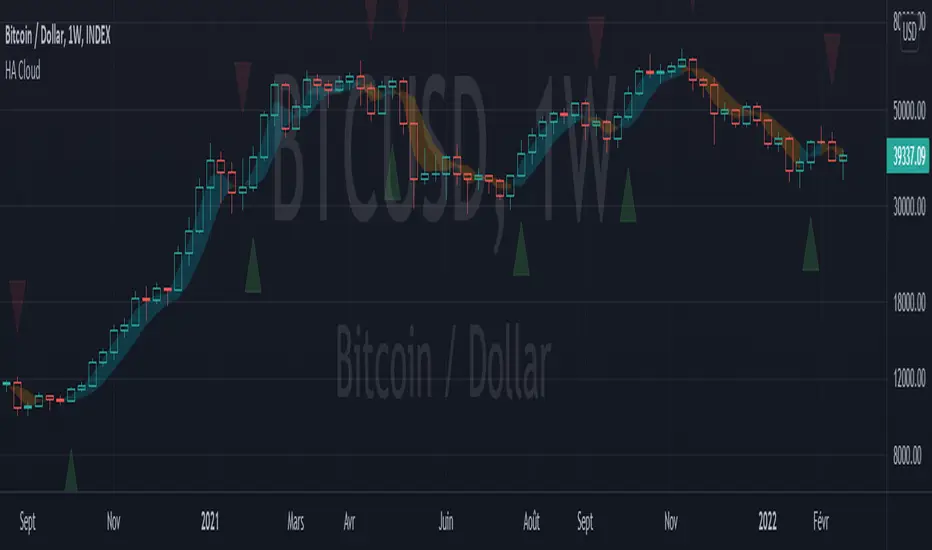
Heikin Ashi Cloud overlayThis script displays a cloud representing the bodies of Heikin Ashi candles, which allows to have all the information of the HA technique without losing focus on the classical candles.
Also has arrows to indicate a trend reversal (counterproductive in a range !)
Cross Average PriceSimple script that allows you to view crossings and averages 14/50/100/200 in a simple and intuitive way.
With this script you can keep an eye on trends visually.
Green Point = 14 crosses 50
Yellow Point = 14 crosses 100
Red Point = 14 crosses 200

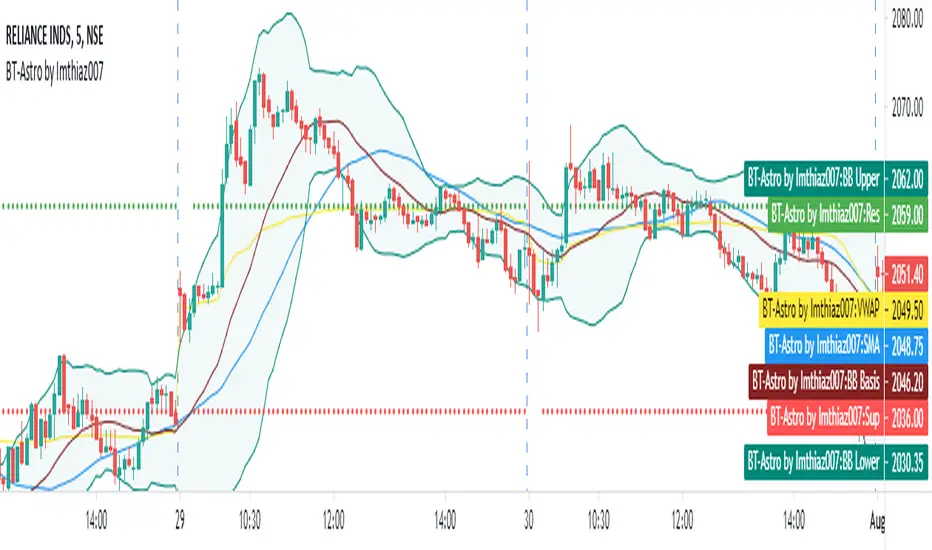
BT Astrology Indicator by Imthiaz007
BT-Astrology Indicator is fine tuned indicator to calculate and draw daly support and resistance based on Gann level for intraday trade or swing trade.
The original Idea is given by Mr. Alex from Badshai Trading; I am a Software Developer by profession so that I just coded it and add some signals for back testing.
I also add following Indicator for better view:
a) Simple Moving Average
b) VWAP
c) Bollinger Band
The Input section of the Indicator :
SMA :- Length 35 as per Mr. Alex suggestion
Minutes : Enter minutes in terms of number of minutes on which VWAP value will be taken for calculating the levels.
By default it will be 20 means VWAP value of 9:35 AM candle will be consider for drawing levels.
How it works ?
Buy : When resistance is broken with higher high formation and candle is above 35 SMA
Sell : When support is broken with lower low formation and candle is below 35 SMA
Hope you like it!!!
Swing/Scalper HULL + T3 avg Crypto StrategyThis is a both a swing and a scalper strategy(depends on the timeframe that you use), that works with all timeframes, however I noticed that with swing 3h works the best on most crypto pairs, such as ETH, BTC and so on.
Its main components are:
Hull moving average
T3 moving average
Risk management
With them I make an average and use it as the main moving average.
Rules for entry
For long: Average moving average is bigger than previous average moving average value.
For short:Average moving average is lower than previous average moving average value.
Rules for exit
We exit when either the TP/SL has been hit, or when we get a different condition than previous one(both for long and short).
If you have any questions, let me know !

Moving Average Ribbon [TheBearFighter]
This code was written using:
•Pine Script Coding Conventions.
This script provides a very useful tool for new community users and professionals. It puts at your disposal a Moving Average Ribbon by hand to graph and easily find the ones with the highest performance. The creation of this script was motivated because in free TradingView accounts there is a limit of 3 indicators by chart, and with this tool you can draw up to 32 MA's at the same time!
Choose one of 10 types of MA´s:
•KAMA Kaufman's moving average.
•HULL Hull moving average.
•TEMA Triple exponencial moving average.
•LSMA Least square moving average.
•DEMA Double exponencial moving average.
•ALMA Arnaud Legoux moving average.
•WMA Weighted moving average
•EMA Exponencial moving average.
•VWMA Volume Weighted moving average.
•SMA Simple moving average.
Use the tooltips to know the lengths of MA´s.
A main characteristic of the script is that the lengths are in days but when changing the lowest timeframes, the same daily resolution is maintained. This gives us extreme precision in intraday timeframes, e.g 30 minutes.
Once this is understood, we can turning the MA´s on/off, and changing the timeframe to our liking.
Available timeframes: M, W, D, 4H, 1H, 30m, 15m, 5m.
Also the MA´s are colored for easy visualization and know if they grow or decrease.
Thank´s to @midtownsk8rguy to let me know more about HEX colors.
Thank´s to @HPotter for his KAMA.
