Daily & Pre-Market Key Levels (v5)Plots:
- Today's high/low
- Pre-market High/Low
- Yesterday's high/low/close
- Day before yesterday high/low
Bands and Channels

225 SMA CrossoverWell-known strategy from Zahlengraf from the Mauerstrassenwetten subreddit for you to test yourself.
You can change the length of the SMA and whether to trade long, short or both directions.

Varun's StrategyBuy and Sell strategy designed for a 1 minute chart to buy when RSI drops under 25 and sell when RSI exceeds 75

UK Public OnesideRSI + Stochastic V1 (Moderate) Strategy
This strategy combines RSI, Stochastic Oscillator, and a 50 EMA trend filter to identify moderate-risk trading opportunities in trending markets.
How it works:
Long entries occur when RSI and Stochastic are in oversold conditions while price is above the 50 EMA.
Short entries occur when RSI and Stochastic are in overbought conditions while price is below the 50 EMA.
Trades are confirmed on the previous candle, avoiding premature entries and exits.
Risk management is handled using fixed percentage stop-loss with configurable risk-to-reward targets.
Optional RSI-based exits close positions early during overbought or oversold conditions.
Key Features:
Trend-filtered entries using EMA 50
Non-repainting logic (confirmed candle signals)
Configurable stop-loss and reward ratio
Works well for scalping and intraday trading
Suitable for crypto, forex, and indices
Recommended Timeframes:
5m, 15m, 30m
Note:
This strategy is designed for educational and research purposes. Always forward-test and apply proper risk management before using in live trading.

Follow the "Smart Money" to Capture Altcoin Super-Trends這不是一套普通的趨勢策略。大多數山寨幣 (Altcoins) 的突破策略之所以失效,是因為它們忽略了市場的真實驅動力——比特幣的機構資金流向。 ITAS (Institutional Triggered Alpha System) 是一套結合了「跨市場分析」與「波動率自適應」的量化系統。
核心運作邏輯:
機構資金濾網 (Institutional Filter): 我們監控比特幣 (BTC) 在頂級合規交易所(如 Coinbase)與全球流動性池之間的資金溢價 (Premium)。這是一個領先指標,用來判斷華爾街機構是在「吸籌」還是「派發」。
精準狙擊 (Precision Trigger): 只有當監測到**「機構資金正在買入 BTC」**的時刻,系統才會解鎖山寨幣的交易權限。
拒絕假突破 (False Breakout Rejection): 透過這個濾網,我們能過濾掉市場中 80% 由散戶情緒引起的「假突破」。如果比特幣沒有機構支撐,就算山寨幣漲得再兇,本策略也會判定為雜訊而拒絕進場。
波動率適配 (Volatility Adaptation): 針對高波動資產 (High Beta Assets) 優化的動態通道,確保在劇烈洗盤中能拿住單子,吃到完整的波段利潤。
This is not an ordinary trend-following strategy. Most Altcoin breakout strategies fail because they ignore the true driver of the market—Institutional Money Flow in Bitcoin. ITAS (Institutional Triggered Alpha System) is a quantitative system that combines "Inter-market Analysis" with "Volatility Adaptation."
How It Works:
Institutional Filter: We monitor the Premium Gap of Bitcoin (BTC) between top-tier regulated exchanges (like Coinbase) and global liquidity pools. This serves as a leading indicator to determine whether Wall Street institutions are "Accumulating" or "Distributing."
Precision Trigger: The system only unlocks trading permissions for Altcoins when it detects "Institutional Buying in BTC."
False Breakout Rejection: Through this filter, we effectively filter out 80% of "False Breakouts" driven solely by retail sentiment. If there is no institutional support behind Bitcoin, the strategy will identify any Altcoin pump as noise and refuse to enter.
Volatility Adaptation: Features a dynamic channel optimized for High Beta Assets, ensuring positions are held through aggressive shakeouts to capture the full trend.
免責聲明 (Disclaimer)
補充說明: 以上策略績效源自歷史數據回測,不代表對未來獲利的保證。加密貨幣市場風險極高,本策略僅供量化研究與邏輯分享,使用者應自行評估風險並自負盈虧,本人不承擔任何交易損失。
Disclaimer: The performance above is based on historical backtesting and does not guarantee future results. Cryptocurrency trading involves high risk. This strategy is shared for quantitative research and educational purposes only. Users are solely responsible for their own risk assessment and PnL. I assume no liability for any trading losses incurred.

Coinbase Institutional Flow Alpha1. 核心概念 (The Core Concept)
這不是一套傳統看圖形(如 RSI 或 MACD)的技術指標策略,而是一套基於**「籌碼面」與「市場微結構」的量化系統。 比特幣市場存在兩個平行世界:美國機構投資者(主要使用 Coinbase 美元對)與全球散戶**(主要使用 Binance USDT 對)。這套策略的核心邏輯在於捕捉這兩者之間的**「定價效率落差」**。
This is not a traditional technical analysis strategy based on lagging indicators like RSI or MACD. Instead, it is a quantitative system based on Order Flow and Market Microstructure. The Bitcoin market consists of two parallel worlds: US Institutional Investors (trading on Coinbase USD pairs) and Global Retail Investors (trading on Binance USDT pairs). The core logic of this strategy is to capture the pricing inefficiency gap between these two liquidity pools.
2. 運作原理 (How It Works)
Smart Money 追蹤: 當機構開始大舉買入時,Coinbase 的價格往往會比 Binance 出現短暫且顯著的「溢價(Premium)」。這通常是行情的領先指標。
統計套利模型: 我們開發了一套獨家的演算法,24 小時監控這個溢價缺口的變化。只有當溢價偏離程度達到特定的**統計學異常值(Statistical Anomaly)**時,系統才會判定為「機構進場信號」並執行交易。
過濾雜訊: 我們只抓取真正由資金推動的大趨勢,過濾掉市場上 80% 的無效波動。
Smart Money Tracking: When institutions accumulate heavily, the price on Coinbase often trades at a significant "Premium" compared to Binance. This serves as a powerful leading indicator for price trends.
Statistical Arbitrage Model: We utilize a proprietary algorithm that monitors this premium gap 24/7. Only when the gap deviation hits a specific Statistical Anomaly, does the system identify it as an "Institutional Entry Signal" and execute the trade.
Noise Filtering: The strategy is designed to capture significant trends driven by real capital flow, effectively filtering out 80% of random market noise.
免責聲明 (Disclaimer)
補充說明: 以上策略不保證獲利,僅提供量化交易的想法與實驗數據參考。請注意,市場沒有聖杯,交易結果盈虧自負,本人不承擔任何因使用此策略而產生的資金損失。
Disclaimer: The above strategy does not guarantee profits and is provided solely for sharing quantitative ideas and experimental data. Please note that there is no "Holy Grail" in trading. You are solely responsible for your own PnL, and I assume no liability for any financial losses incurred.

Wisenode QuantThis indicator uses a combination of DMI, ADX and ATR% to give quick easy visual representation of trend strength, trend direction and price action volatility.
This helps to quickly visually identify market environment for trade execution using quantifiable data.
Direction
Red LED = Bearish Market conditions
Green LED = Bullish Market conditions
Trend (Strength)
Red = 0-20 on the ADX (Ranging)
Green = 20-30 on the ADX (Emerging)
Green = 30-50 on the ADX (Momentum)
Volatility
Uses ATR% on a dynamic scale from top to bottom is low to high intensity. Colour will transition from green to red as the bar moves higher.
Trade Execution
Integration of a custom Murray math values to build entry, stop loss protection and take profit zones.
This is still a working progress to fine tune default settings but can be used for market environment identification for any sort of discretionary trading

Master Moving Averages PlusThe Master Moving Averages indicator is a full-session, moving-average–driven market structure engine that combines 1) Heiken Ashi Candlesticks, 2)Exponential Moving Averages, 3)Session Backgrounds, 4)VWAP, 5)EMA Streams, 6)EMA Crossing Labels, 7)All-Inside EMA Labels, 8)Price Control Logic (Bundles, Momentum, Reversals), and 9)Heavy EMA anchors into a single chart framework. The indicator provides access to toggle these features on and off in the settings gear icon to the right of the indicator name in the screen panel.
1)Because this chart uses Heikin Ashi candlesticks, the behavior is slightly different from standard candles. Heiken Ashi candles are smoothed, meaning each candle is influenced by the previous one. This reduces noise and makes trends easier to see. In practice, long sequences of same-color candles with small or no opposite wicks indicate strong, sustained movement, while smaller bodies or the appearance of opposite wicks signal slowing or transition. Opposite wicks are wicks that appear against the current direction of the move. In an upward move, an opposite wick is a wick on top of the candle. It shows that upward progress is no longer clean and momentum is starting to slow. In a downward move, an opposite wick is a wick on the bottom of the candle. It shows that downward progress is slowing.
With Heiken Ashi candles, opposite wicks are especially important because they do not appear easily. When one shows up, it often marks loss of trend quality, a pause, or the beginning of a transition rather than a random fluctuation. Ashi wicks still matter, but they emphasize trend quality rather than single-bar reactions, making them especially useful for staying in moves longer and avoiding premature exits caused by random price spikes. Candlesticks are a visual record of price behavior over one bar, showing where price opened, traded, and closed. The body shows the meaningful part of the move—the distance between open and close—and tells whether price made progress during that bar. Large bodies indicate clean movement and follow-through, while small bodies indicate slowing or uncertainty. The wicks show where price traveled but did not stay. Wicks in the direction of the move are normal and usually appear during healthy trends, while wicks against the move signal slowing, hesitation, or loss of momentum. A candle with a large body and small wicks reflects strong continuation, whereas long wicks with a small body suggest pause, balance, or transition. Candlesticks are not signals by themselves; they are read bar-to-bar to judge whether a move is continuing, slowing, or stalling, helping decide whether to stay in a trade, manage risk, or wait for clearer structure.
For example, suppose price is moving higher and already in a long trade. Several candles print with solid bodies and small lower wicks, showing steady upward progress. This is healthy continuation, so staying in the trade makes sense. Then a candle prints with a small body and a long upper wick. Price pushed higher during the bar but could not hold those levels by the close. That candle does not mean reverse now, but it does mean momentum is slowing. The practical response is to stay in but be alert—do not expect the same speed of continuation. If the next candle prints another upper wick or a small body, the move is likely stalling. If instead the next candle closes strong with a large body, the trend has resumed.
2)An Exponential Moving Average (EMA) is a moving average that tracks price but gives more weight to the most recent bars. In plain terms: it reacts faster to what price is doing right now than a simple average (SMA) does. Here’s what that means in practice: Every EMA is an average of price over a set number of bars The "exponential" part means the newest candles matter more than older ones. Because of that weighting, an EMA turns sooner, crosses sooner, and shows shifts in directional control sooner. On the chart specifically: Short EMAs (like 4, 9, 16) respond quickly → they show immediate pressure. Mid EMAs (24, 36, 48) show follow-through or failure. Long EMAs (72 and up) change slowly → they define structure and context, often showing the explosive nature of building pressure signaling entries.
3)Session Background gives context to which part of the trading day the current bar or candlestick belongs to. The script separates the day into: Pre-Session, After-Hours and Regular Trading Hours (RTH). Price acts differently depending on the session. Session context is shown on the chart by 1️⃣ Background shading. The lighter background → Pre-session or Pre-Market (PM) and After-hours (AH). The darker background → RTH (Regular Trading Hours). One glance tells you where you are in the day. 2️⃣ Different sessions build different levels of highs and lows: Pre-Session High and Low is built only during After Hours (AH) and pre-market hours (PM). Session High and Low is built only during RTH. Previous Day Session High and Low is carried forward into today. These provide perspective during the session. Sometimes price respects pre-session highs and lows and even previous day session highs and lows— especially immediately following opening in the initial move and retracement. Session context just means knowing whether a particular candlestick bar was or is pre-market, regular hours, or after-hours — because the rules change. It's just a check on where you are.
4)VWAP stands for Volume Weighted Average Price. It is the session’s true average price — weighted by where the volume actually traded. Not yesterday, not overnight, only during Regular Trading Hours. Every share traded during Reg Trading Hours (RTH) pulls VWAP toward it. The VWAP on this chart resets at the RTH open. VWAP uses the average price of each bar, then lets the bars with real volume count more. The calculation is High+ Low+ Close/3. High, Low, Close are added together and averaged. So instead of picking just the close or just the high, it uses the middle of where price actually traded during that bar. The equation looks like this: hlc3 × volume. It only updates during the day session. Overnight and pre-market do not contaminate it. So VWAP belongs to today’s fight only. On the chart it looks like a thick orange line outlined in white. There is a right-side label that reads: VWAP | Bullish / Bearish / Neutral.
In practice VWAP is a 1️⃣ Fair price reference that shows where the bulk of business has been done because if Price is above it → trading is happening at higher-than-average prices. If Price is below it → trading is happening at lower-than-average prices. Fair price is the price level where the most of the trading has actually occurred during the session. It's not a prediction.
It's not a target. It's not a value judgment. It's just where buyers and sellers have been most active. 2️⃣ VWAP slope is smoothed and classified: Rising → Bullish, Falling → Bearish, Flat → Neutral. This doesn’t fire signals — it confirms pressure. VWAP shows where today’s real money has traded and whether that price is drifting up, down, or going nowhere.
The right-side VWAP label summarizes everything in one place: trend state, price distance from VWAP (percentage), and slope strength with direction arrows, allowing quick assessment without clutter. Practically, VWAP is used as a fair-value anchor and intraday control reference—price holding above a rising VWAP supports continuation, price below a falling VWAP supports downside pressure, and flat VWAP conditions warn of rotation or chop rather than trend.
5)EMA (Exponential Moving Average) Streams in this script are a visual state. They are the shaded bands between specific EMA pairs that show: direction, pressure, and alignment. The stream shows the relationship of the pairs. In the script the streams are: 4–9, 9–16, 16–24, 24–36 EMA'S. Each one can be turned on or off. On the chart they look like two EMAs with soft shaded fill between them and color changes based on up or down movement. The stream mechanically is telling 1️⃣ Direction. If the pair is above price they push down, if below price they push up. Each stream is made of two EMAs: One reacts faster, one reacts slower, but they’re doing the same thing. For Example a 4 EMA takes the last 4 candlesticks and averages them; likewise a 9 EMA takes the last 9 candlesticks and averages them yielding two lines, one that moves quicker and one that moves slower. When a slower EMA crosses above a faster EMA it drives price down. When a slower EMA crosses below a faster EMA it drives price up. 2️⃣ Pressure: EMA streams show pressure leaning on price. Wide stream → pressure is expanding. Tight stream → pressure is compressing. Compression matters because it precedes movement.
6)EMA Crossing Labels (Pivots, EMA9, EMA16, EMA24) mark an actual EMA crossover event. The Crossing Labels are white labels attached below or above the candlestick showing price direction. They print only when one EMA physically crosses the price control line. The price control line is a default on the chart and is constant. The priceControlLine = (open + close) / 2. The crossing is confirmed on bar close. If, for example, EMA-16 rolls over the priceControlLine and crosses downward, the label fires indicating that price has stalled or shifted, buyers have lost control, sellers are in control, and the market is trending short. If EMA-24 and EMA-36 follow, pressure is stacking, multiple timeframes confirm, pullbacks become weaker, and price is more likely to continue in the same direction.
7)An Inside EMA label can represent two very different conditions, and context matters. When shorter ranges (such as 9–36, 9-48, or 9–72) compress inside a candle during sideways or low-energy price action, it often reflects chop or rotation, and no immediate expansion is required. In contrast, when deeper ranges (9–106, 9–139, 9–192) collapse inside a single candle—especially near the open or during active sessions—it usually occurs because price is moving faster than the EMAs can respond, signaling elevated energy and the potential for rapid continuation or transition. Practically, Inside labels are conditional triggers: shallow compression can persist, while deep compression demands attention because resolution, when it comes, tends to be decisive.
Example 1: Fast open, real urgency— The market opens and within the first few candles a 9–139 Inside label prints. Price has already moved aggressively, and all EMAs are trapped inside one candle body. In real terms, this means structure has been run over. The practical response is immediate attention: do not hesitate, do not wait for EMAs to fan out. Expect either a fast continuation (often followed quickly by a Bundle or Momentum label) or a sharp stall if momentum fails. Speed matters because the next decision point arrives quickly.
Example 2: Mid-day chop, no urgency—Later in the session, price is rotating sideways and a 9–72 Inside label appears. Price has not traveled far, candles overlap, and no expansion follows. In this case, the label simply confirms compression without pressure. The correct action is no action—continue waiting. No urgency, no expectation of immediate resolution.
Example 3: Transition point—After a trend, a 9–106 Inside prints as bodies shrink. Momentum is already slowing. Here the label marks a transition zone. The practical move is to stop expecting continuation and watch closely: a Momentum or Bundle label confirms continuation, while a Reversal label confirms control change.
8)Price Control Logic is determined by three things working together and the Bundle, Momentum, and Reversal labels are expressions of that control:
1️⃣ Price vs the Price Control Line: The Price Control Line is the midpoint of the candle body. When Price is above it → buyers are controlling closes. When Price is below it → sellers are controlling closes.
2️⃣ EMA Position Relative to Control: When EMAs cross the Price Control Line: EMA crosses up through control → momentum is shifting to buyers. EMA crosses down through control → momentum is shifting to sellers. That’s why labels fire only on those crosses. It marks real control shifts, not wicks.
3️⃣ EMA Stack & Compression: Tight EMA bundles inside the candle body means no one has control yet. EMAs expanding upward means buyers are gaining control. EMAs expanding downward means sellers are gaining control. This is pressure building vs pressure releasing.
Bundle, Momentum, and Reversal labels are confirmation markers, not prediction signals. A Bundle label prints when a compressed EMA cluster (16/24/36/48) resolves back into price with real body momentum and EMA-16 already trending, signaling stored pressure releasing. A Momentum label prints only on sharp expansion, where the candle body is significantly larger than the prior bar, confirming acceleration in the existing direction. A Reversal label marks a true short-term control shift, where EMA-16 flips slope with a momentum candle, signaling buyers and sellers have swapped control—not a wick reaction. Because all labels require body dominance and EMA agreement, they often appear after movement begins, making them reliable tools for confirming pressure, continuation, or control change rather than early entry timing. Visually, each label reinforces direction at a glance. Bullish labels are green, placed below the candle, and use an upward-pointing shape to indicate rising pressure. Bearish labels are red, placed above the candle, and use a downward-pointing shape to indicate falling pressure. Labels sit just off the candle body so price remains clear, and their color, placement, and shape always align with the direction of control.
9) Heavy EMA anchors are the big EMAs. They act like fixed reference points while everything else whips around them. The heavy EMA anchors in this chart are EMA 768,1024, 1250, 1536, 2048, 2700, 3300, 4096. They are displayed only as right-side tags at their current price levels, not as plotted lines. These tags sit on the far right edge of the chart, aligned with the price scale, and are color-matched to their respective EMAs. Their purpose is to show where slow, heavy pressure exists without cluttering price action with lines. When these EMA tags are bundled together and price is trading inside that cluster, the market is compressed and choppy. When the tags separate and price holds above or below the group, structure is returning and directional movement becomes easier. Keeping the tags visible provides instant awareness of whether price is trapped or free, helping filter noise and align the rest of the indicator with the larger structure at all times.

Kairos Bands [v1.1]Overview
The Kairos Bands Strategy is a highly modular trading system designed to identify high probability entry points based on volatility exhaustion and momentum shifts... It is built with a proprietary core algorithm that detects when price has extended too far from its mean, but it is wrapped in a Confluence Cloud that allows the user to filter these signals through nine different secondary indicators...
This is not just a static strategy... It is a framework that allows you to build your own edge by toggling specific filters on and off to match current market conditions...
1... The Chameleon Feature (Trend or Reversal)
One of the most powerful features of Kairos Bands is the Inverse Trades logic...
Reversal Mode (Default): By default, the strategy looks for price exhaustion... It buys when the market is oversold and sells when the market is overbought... This is ideal for ranging markets or catching tops and bottoms...
Trend Following Mode (Inversed): By checking the Inverse Trades box in the settings, the logic flips completely... A Buy signal becomes a Sell and vice versa... This transforms the strategy into a breakout or trend following system, entering trades in the direction of the momentum rather than against it...
2... The Confluence Cloud
While the core trigger is based on proprietary volatility calculations, the user has full control over how strictly those trades are filtered... You can toggle any of the following 9 momentum filters independently for both Long and Short setups...
RSI (Relative Strength Index)
Stochastic Oscillator
CCI (Commodity Channel Index)
Williams %R
MFI (Money Flow Index)
CMO (Chande Momentum Oscillator)
Fisher Transform
Ultimate Oscillator
ROC (Rate of Change)
For example, you can require RSI and MFI to agree with the main signal for Longs, but only require Stochastic for Shorts... This allows for granular tuning...
3... Trend Bias & Time Management
To further refine entries, the strategy includes:
EMA Trend Filter: An optional dual EMA system (Fast vs Slow) that forces the strategy to only trade in the direction of the dominant trend...
Precision Time Filtering: You can define exact start and end times (down to the minute) for entries...
No Trade Zone (NTZ): A specific time window where the strategy is forbidden from holding positions... If a trade is open when the NTZ begins, it is immediately force closed to avoid volatility events or market closes...
4... Risk Management
The strategy moves away from vague percentage based stops and uses precision point based targeting...
Fixed Points: Set your Take Profit and Stop Loss in exact price points...
Signal Skipping: An optional feature to cool down the strategy after a trade closes, forcing it to skip a set number of subsequent signals to avoid over trading...
5... Professional Analytics Dashboard
The visual overlay provides a detailed Heads Up Display (HUD) containing institutional grade metrics...
Strategy Grade: An automatic A through F grading system based on the Win Rate Differential (how much better the strategy performs compared to a breakeven coin flip)...
Streak Analysis: Tracks the maximum and average consecutive wins and losses to help you understand the psychological drawdown risk...
Rolling PnL: A secondary dashboard tracks your hypothetical Net PnL over the last 7 trading days and the last 12 months, giving you a clear view of short term and long term performance...

Daily High/Low Breakout Strategy v2Long and Short trade signal strategy, connects via API key to any exchange, can be used as an indicator. Based on the break of maximum and minimum levels. preferred timeframe 5 minutes.

MACD Box V6.3 (Right Labels)Using the dual MACD indicator, identify the range formed by high-volume MACD candlesticks. Then, use fractals formed by three or five candlesticks to identify trends formed by two consecutive fractals.

Context Bundle | VWAP / EMA / Session HighLow (v6)
📌 0DTE Context Bundle (v6)
**VWAP • EMA Cloud • Session High/Low (NY / London / Asia)
The **0DTE Context Bundle** is a *decision-making overlay*, not a signal spam indicator.
It’s designed to help traders clearly see **value, trend, and liquidity levels** across **New York, London, and Asia sessions** — all in one clean, customizable tool.
Built for **NQ, ES, Gold, and FX pairs**, with a focus on **5–15-minute execution charts**.
---
## 🔹 What This Indicator Shows
### ✅ VWAP + ATR Bands
* Session VWAP (fair value)
* ATR-based extension bands (1x / 2x)
* Helps identify **overextension, mean reversion zones, and trend pullbacks**
### ✅ EMA 9 / 21 Cloud
* Visual trend and momentum filter
* Custom colors + opacity
* Identifies **trend continuation vs chop**
### ✅ Session High / Low Levels
* **New York RTH**
* **London**
* **Asia (midnight-safe)**
* Optional previous session highs/lows
* Adjustable line styles, widths, colors, and extensions
### ✅ Anchored VWAP (Optional)
* Reset by:
* Daily
* NY session start
* London session start
* Asia session start
* Useful for tracking **session-specific value shifts**
---
## 🔹 How Traders Use It
This indicator is meant to answer:
* *Are we trading at value or extension?*
* *Is the market trending or rotating?*
* *Where is liquidity likely sitting right now?*
Common use cases:
* Trend pullbacks into VWAP or EMA cloud
* Reversal setups at session highs/lows
* Session breakout + retest confirmation
* Overnight context for London and Asia sessions
---
## 🔹 Customization & Flexibility
Every component can be toggled and styled:
* Colors, widths, line styles
* Cloud up/down colors + opacity
* Session visibility and extensions
* VWAP band multipliers and ATR length
Members can adapt it to **their own style**, market, and timeframe.
---
## ⚠️ Disclaimer
This indicator is provided for **educational and informational purposes only**.
It does **not** provide financial advice or trade signals.
Always manage risk and confirm entries with your own strategy.

Ultimate MTF//@version=5
indicator("Ultimate MTF", shorttitle="Ultimate MTF", overlay=true)
// ============== EMA 13 (Court Terme - Accélérateur) ==============
ema13_enabled = input(true, title="Enable EMA 13", group="EMA 13")
ema13_period = input.int(13, title="EMA 13 Period", minval=1, group="EMA 13")
ema13_color = input(color.new(#FF6B35, 0), title="EMA 13 Color", group="EMA 13")
// ============== EMA 21 (Court Terme - Signal) ==============
ema21_enabled = input(true, title="Enable EMA 21", group="EMA 21")
ema21_period = input.int(21, title="EMA 21 Period", minval=1, group="EMA 21")
ema21_color = input(color.new(#004E89, 0), title="EMA 21 Color", group="EMA 21")
// ============== SMA 50 (Moyen Terme - Zone de Vérité) ==============
sma50_enabled = input(true, title="Enable SMA 50", group="SMA 50")
sma50_period = input.int(50, title="SMA 50 Period", minval=1, group="SMA 50")
sma50_color = input(color.new(#F7931E, 0), title="SMA 50 Color", group="SMA 50")
// ============== SMA 200 (Long Terme - Juge de Paix) ==============
sma200_enabled = input(true, title="Enable SMA 200", group="SMA 200")
sma200_period = input.int(200, title="SMA 200 Period", minval=1, group="SMA 200")
sma200_color = input(color.new(#43A047, 0), title="SMA 200 Color", group="SMA 200")
// ============== FUNCTION TO CALCULATE MA ==============
calcMA(period, maType, source) =>
switch maType
"SMA" => ta.sma(source, period)
"EMA" => ta.ema(source, period)
=> ta.ema(source, period)
// ============== CALCULATE MOVING AVERAGES ==============
ema13_value = ta.ema(close, ema13_period)
ema21_value = ta.ema(close, ema21_period)
sma50_value = ta.sma(close, sma50_period)
sma200_value = ta.sma(close, sma200_period)
// ============== PLOT MOVING AVERAGES ==============
plot(ema13_enabled ? ema13_value : na, title="EMA 13", color=ema13_color, linewidth=2)
plot(ema21_enabled ? ema21_value : na, title="EMA 21", color=ema21_color, linewidth=2)
plot(sma50_enabled ? sma50_value : na, title="SMA 50", color=sma50_color, linewidth=2)
plot(sma200_enabled ? sma200_value : na, title="SMA 200", color=sma200_color, linewidth=2)

MTF 5 Moving Averages//@version=5
indicator("Multi-Timeframe 5 Moving Averages", shorttitle="MTF MA x5", overlay=true)
// ============== MOVING AVERAGE 1 ==============
ma1_enabled = input(true, title="Enable MA1", group="Moving Average 1")
ma1_period = input.int(9, title="MA1 Period", minval=1, group="Moving Average 1")
ma1_type = input.string("EMA", title="MA1 Type", options= , group="Moving Average 1")
ma1_color = input(color.new(#FF6B35, 0), title="MA1 Color", group="Moving Average 1")
// ============== MOVING AVERAGE 2 ==============
ma2_enabled = input(true, title="Enable MA2", group="Moving Average 2")
ma2_period = input.int(20, title="MA2 Period", minval=1, group="Moving Average 2")
ma2_type = input.string("EMA", title="MA2 Type", options= , group="Moving Average 2")
ma2_color = input(color.new(#004E89, 0), title="MA2 Color", group="Moving Average 2")
// ============== MOVING AVERAGE 3 ==============
ma3_enabled = input(true, title="Enable MA3", group="Moving Average 3")
ma3_period = input.int(50, title="MA3 Period", minval=1, group="Moving Average 3")
ma3_type = input.string("SMA", title="MA3 Type", options= , group="Moving Average 3")
ma3_color = input(color.new(#F7931E, 0), title="MA3 Color", group="Moving Average 3")
// ============== MOVING AVERAGE 4 ==============
ma4_enabled = input(true, title="Enable MA4", group="Moving Average 4")
ma4_period = input.int(100, title="MA4 Period", minval=1, group="Moving Average 4")
ma4_type = input.string("SMA", title="MA4 Type", options= , group="Moving Average 4")
ma4_color = input(color.new(#1E88E5, 0), title="MA4 Color", group="Moving Average 4")
// ============== MOVING AVERAGE 5 ==============
ma5_enabled = input(true, title="Enable MA5", group="Moving Average 5")
ma5_period = input.int(200, title="MA5 Period", minval=1, group="Moving Average 5")
ma5_type = input.string("EMA", title="MA5 Type", options= , group="Moving Average 5")
ma5_color = input(color.new(#43A047, 0), title="MA5 Color", group="Moving Average 5")
// ============== FUNCTION TO CALCULATE MA ==============
calcMA(period, maType, source) =>
switch maType
"SMA" => ta.sma(source, period)
"EMA" => ta.ema(source, period)
"WMA" => ta.wma(source, period)
=> ta.sma(source, period)
// ============== CALCULATE MOVING AVERAGES (CHART TIMEFRAME ONLY) ==============
ma1_value = calcMA(ma1_period, ma1_type, close)
ma2_value = calcMA(ma2_period, ma2_type, close)
ma3_value = calcMA(ma3_period, ma3_type, close)
ma4_value = calcMA(ma4_period, ma4_type, close)
ma5_value = calcMA(ma5_period, ma5_type, close)
// ============== PLOT MOVING AVERAGES ==============
plot(ma1_enabled ? ma1_value : na, title="MA1", color=ma1_color, linewidth=2)
plot(ma2_enabled ? ma2_value : na, title="MA2", color=ma2_color, linewidth=2)
plot(ma3_enabled ? ma3_value : na, title="MA3", color=ma3_color, linewidth=2)
plot(ma4_enabled ? ma4_value : na, title="MA4", color=ma4_color, linewidth=2)
plot(ma5_enabled ? ma5_value : na, title="MA5", color=ma5_color, linewidth=2)

Fixed 5 Point Levels 21 Lines Stable by Pie789The 500-point lines (upper and lower) don't need to be drawn manually. Simply define the center point and adjust it afterwards to create a 500-point frame.

[iQ]PRO Grand Unified Theory Bands+PRO Grand Unified Theory Bands+ (GUT+)
Welcome to the pinnacle of market state analysis. The PRO Grand Unified Theory Bands+ is not just an indicator; it is a multi-dimensional analytical engine designed to synthesize complex mathematical disciplines into a singular, actionable visual interface.
By merging Quantum Signal Processing, Chaos Theory, and Adaptive Cycles, this tool provides a high-fidelity view of market structure that remains invisible to standard retail indicators.
### The Science of Precision
The GUT+ framework operates on a proprietary sequence of six specialized computational layers, ensuring that every signal is filtered for noise and synchronized with the current market rhythm.
Non-Linear Time Warping: Utilizing advanced Laguerre geometry to smooth price action without the catastrophic lag associated with traditional moving averages.
Haar Wavelet Decomposition: We strip away the "market noise" using multi-level wavelet transforms, isolating the core trend from chaotic price fluctuations.
Discrete Fourier Analysis (DFT): The system continuously scans for the dominant market cycle, ensuring the bands expand and contract based on real-time frequency rather than static lookback periods.
State Estimation (Kalman Physics): An adaptive tracking algorithm that predicts the most likely "true" price position by minimizing the recursive variance between signal and noise.
Feigenbaum Bifurcation Logic: Derived from Chaos Theory, our volatility bands use universal constants to identify "bifurcation points"—critical levels where price is mathematically forced to make a directional decision.
MESA Adaptive Engine: Incorporating Hilbert Transforms and MAMA/FAMA logic to track phase transitions, allowing the tool to distinguish between trending and cyclical market environments.
### Key Features & Visual Intelligence
PRO GUT+ translates complex data into a simplified color-coded system, allowing you to read the market state at a glance:
Visual Element Market Interpretation
Golden Yellow Zone Strong Bullish Expansion: Momentum and Trend are perfectly aligned.
Electric Fuchsia Zone Strong Bearish Contraction: Aggressive selling pressure is dominant.
Deep Sea Blue Reversal/Retracement Warning: Systems are diverging; a trend shift is imminent.
Neon Green Flash Breakout Pending: Volatility is compressed to a critical threshold (The "Squeeze").
Circles (Bifurcation) Mathematical Extremes: High-probability exhaustion points.
⚡ Unified Signal Logic
The "Unified Buy/Sell" labels represent the rare alignment of the Laguerre Smoothing, MESA Phase Analysis, and Fourier Cycle Alignment. When these systems reach confluence, the indicator identifies high-conviction entry and exit zones.
### The PRO Data Suite
The real-time dashboard (top right) provides a deep-dive into the current "DNA" of the asset, including:
Dominant Fourier Cycle: The current rhythmic heartbeat of the market.
MESA/Hilbert Periods: Real-time cycle length for adaptive precision.
Market State Engine: A proprietary classification (Neutral, Strong Bull, Breakout Ready, etc.) powered by our internal logic.
### Usage & Access
This tool is part of the MarketMakerIQ Professional Suite. It is designed for traders who require institutional-grade data processing to stay ahead of retail lag.
Optimized For: All timeframes (Scalping to Position Trading).
Asset Classes: Forex, Crypto, Indices, and Equities.
Access: This is a Closed-Source, Invite-Only script.
Note: To maintain the integrity of our proprietary models and prevent market saturation, access is restricted to authorized members of MarketMakerIQ.

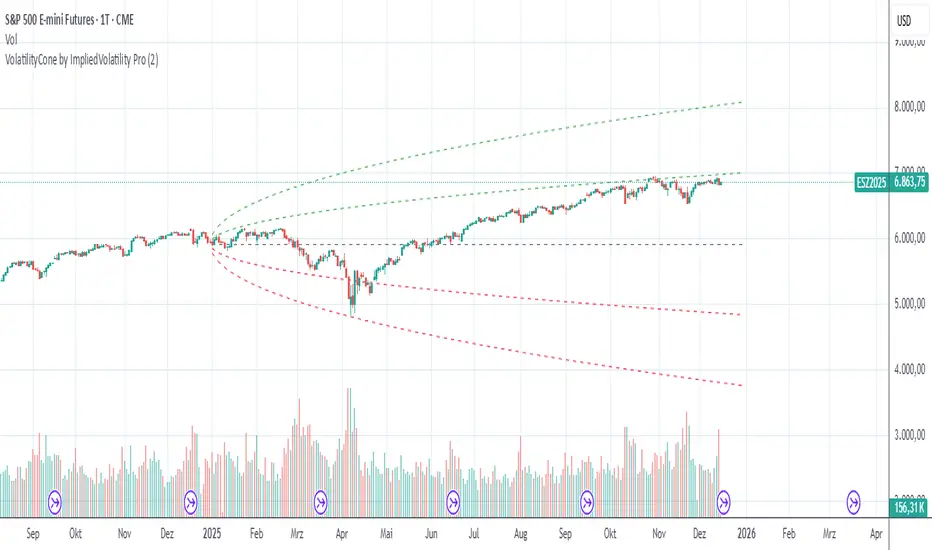
VolatilityCone by ImpliedVolatility ProVolatilityCone by ImpliedVolatility Pro
VolatilityCone by ImpliedVolatility Pro is a forward-looking volatility projection tool that visualizes expected price ranges based on implied volatility.
It draws a volatility cone starting from a user-defined date and projects statistically expected price boundaries into the future using standard deviation theory.
🔍 What does this indicator do?
This indicator calculates and plots price ranges that represent ±1, ±2, and ±3 standard deviations from a starting price, based on implied volatility.
The result is a cone-shaped projection that shows where price is statistically likely to move over time.
In addition, the indicator calculates a Z-Score, showing how far the current price deviates from the expected mean in volatility terms.
📐 Key Features
→ Forward projection based on implied volatility
→ Supports up to 3 standard deviation levels
→ Optional display of half standard deviation levels
→ Manually enter implied volatility or automatically fetch IV from another symbol (e.g. VIX)
→ Custom Start Date
→ The cone starts exactly at the selected date
→ Ideal for earnings, events, or cycle-based analysis
→ Displays the statistical mean price
→ Z-Score indicates how extreme the current price is relative to the cone
📊 How to Use
Price inside the cone
→ Normal volatility behavior
Price near ±1σ
→ Typical volatility range
Price near ±2σ or ±3σ
→ Statistically stretched or extreme conditions
Positive Z-Score
→ Price trading above the mean
Negative Z-Score
→ Price trading below the mean
This makes the indicator useful for:
→ Volatility analysis
→ Mean reversion strategies
→ Risk assessment
→ Event-based forecasting
→ Options-related analysis
⚙️ Notes & Disclaimer
This indicator is not a prediction tool, but a statistical projection
It assumes volatility follows a square-root-of-time model
Best used as a context tool, not as a standalone trading signal
AlgosPoint G&MPoint Breaking 2025 (MB&GB Breaking Point Pro)
What It Does:
A comprehensive TradingView indicator that combines multiple technical analysis tools to identify key market breakout points, support/resistance levels, and trading opportunities. It integrates Volume Profile analysis, AlphaTrend signals, and custom risk assessment metrics.
Key Features:
Volume Profile Analysis: Displays Point of Control (POC), Value Area High/Low (VAH/VAL), and volume distribution
Support & Resistance Detection: Automatically identifies key price levels based on volume or price action
AlphaTrend Signals: Generates BUY/SELL signals with visual labels on chart
Volume Spike Detection: Highlights unusual volume activity indicating potential exhaustion or breakout
High Volatility Alerts: Marks periods of increased market volatility using ATR
Risk Assessment Dashboard: Real-time panel showing:
Long/Short percentages (RSI-based)
Stop levels for both directions
Bot activity percentage
Csocy Signal status (Safe/Undecided/Risky)
How to Use:
Add to Chart: Apply indicator to any timeframe (works best on 15m-4H)
Configure Settings: Adjust parameters in grouped sections:
📊 General Settings (lookback periods)
🎯 Support & Resistance (line styles/colors)
💥 Volume Spike (threshold sensitivity)
⚡ High Volatility (ATR multiplier)
📈 Volume Profile (display options)
🔥 AlphaTrend (signal sensitivity)
Read Signals:
BUY label = Potential long entry when AlphaTrend crosses up
SELL label = Potential short entry when AlphaTrend crosses down
Dashboard colors: Green = bullish, Red = bearish, Yellow = neutral
Set Alerts: Built-in alerts for price crosses, volume spikes, and signal confirmations
Risk Management: Use displayed stop levels and Csocy Signal status to manage position sizing
Best For:
Day traders and swing traders
Crypto, Forex, and Stock markets
Identifying high-probability breakout zones
Volume-based trading strategies

Daily High Breakout Strategy v2Long trade signal strategy, connects via API key to any exchange, can be used as an indicator. Based on breakout, rebound from daily highs.

Macro-Filtered Volatility Breakout (MVB)策略簡介:
這是一套專門針對高 Beta 值資產(如 ETH, SOL 等山寨幣)設計的趨勢跟隨系統。我們解決了傳統突破策略在山寨幣市場中「假突破(False Breakout)」過多的痛點。
核心邏輯:
市場體制過濾(Regime Filtering): 加密貨幣市場具有高度的相關性。本策略引入比特幣(BTC)作為**「宏觀市場指標」**,只有當 BTC 處於確立的多頭趨勢時,才允許執行山寨幣的做多信號。這有效規避了「大盤崩盤時,小幣假突破」的系統性風險。
動態波動率通道: 我們不使用固定價格止損,而是採用肯特納通道(Keltner Channels)。這利用 ATR(平均真實波幅)動態調整進出場區間:在市場平靜時通道收窄以敏銳捕捉啟動點,在劇烈波動時通道放寬以避免被雜訊洗出場。
風控特徵:
系統性避險: 透過 BTC 趨勢濾網,在熊市或大盤回調期間自動空手,降低回撤。
獲利奔跑(Let Profits Run): 採用基於波動率的移動止損(Volatility Trailing Stop),在大趨勢中能吃到完整的魚身。
免責聲明:
以上策略分享僅供學術研究、回測實驗與邏輯參考,並不代表對未來獲利的保證。 過往的回測績效不代表未來的行情表現。本文內容不構成任何投資建議。加密貨幣交易具有高度風險,使用者應自行評估風險承受能力並自負盈虧,本人不承擔任何因使用此策略而產生的資金損失。
Strategy Overview
This is a trend-following system specifically designed for high-beta assets, such as altcoins like ETH, SOL, and similar cryptocurrencies. The strategy addresses a key weakness of traditional breakout systems in altcoin markets—the high frequency of false breakouts.
Core Logic
Market Regime Filtering
The cryptocurrency market exhibits strong cross-asset correlation. This strategy uses Bitcoin (BTC) as a macro market indicator. Long signals on altcoins are only allowed when BTC is in a confirmed bullish trend, effectively avoiding the systemic risk of altcoin false breakouts during broader market downturns.
Dynamic Volatility Channels
Instead of fixed-price stop losses, the strategy employs Keltner Channels, which adapt dynamically using ATR (Average True Range).
During low-volatility conditions, the channel narrows to sensitively capture early trend initiation.
During high-volatility environments, the channel widens to prevent premature exits caused by market noise.
Risk Management Features
Systematic Risk Avoidance
By applying BTC trend filtering, the strategy automatically stays in cash during bear markets or major market pullbacks, significantly reducing drawdowns.
Let Profits Run
A volatility-based trailing stop is used to maximize profit capture during strong directional trends, allowing positions to benefit from the full trend structure.
Disclaimer
The strategy presented above is for academic research, backtesting experiments, and logical reference only. It does not constitute a guarantee of future performance. Past backtest results are not indicative of future outcomes. This content does not represent any investment advice. Cryptocurrency trading involves substantial risk, and users should assess their own risk tolerance and assume full responsibility for any gains or losses. The author bears no liability for any financial losses incurred from the use of this strategy.

Chartology Strategy+🔍 Chartology Strategy+
This tool provides a comprehensive way for users to analyze trend levels and access other Matrix features across selected tickers and timeframes. Results can be tailored by strategy, with the option to filter displayed tickers based on custom user‑defined rules.
Bullish & Bearish Entry Signal (Safe & Scalping).
Entry Level, SL, T-SL & Two TP Levels (Based on Possible Movement).
Dashboard Table for Easy Presentation of All Levels.
Timeframe Scanner for Current Signal (Trend) on Different Timeframes.
Gap Up & Gap Down for Untraded Price Marking.
Institutional Candles for High Volume and Big Price Movement.
Neutral Candle for Low Volume and Small Price Movement.
Supply Demand (Based on Swing High & Low).
Mega Trend Band (Based on HMA) for Overall Trend.
🟢 Bullish & Bearish Entry Signals
Shows the expected direction of the symbol. It shows Bullish and Bearish direction mark on Chart. Entry Level is Closing of the Candle.
Input Settings
Signal Type: Safe
Appears after a proper trend confirmation.
Low frequency, fewer signals, but more reliable.
Best for swing traders who want strong confirmation before entering.
Signal Type: Scalping
Appears frequently during small downward moves.
High frequency, quick signals for short-term trades.
Best for intraday
Traders who want multiple opportunities in small movements.
🎯 Entry Level, SL, T-SL & TP Levels
Generated based on price movement and trend range.
Levels on Chart
Entry Level: Closing price of the candle where the signal appears.
SL (Stop Loss): Maximum risk allowed for the trade.
TSL (Trailing SL): Dynamic SL to reduce risk and lock profits.
Level 01: First TP level with 1:1 risk-reward ratio. Used for partial booking.
Level 02: Final TP level for full exit.
Input Settings
Levels: You can Increase or Decrease Level Amount for the Level 2.
Risk: You can Increase or Decrease Stop Loss (SL).
📊 Dashboard Table for Easy Presentation of All Levels.
Displays all key levels and metrics in one place:
Metrics
Symbol Name Shows the name of the current chart (e.g., NIFTY, BANKNIFTY).
Bar Age Displays the How many candles (Bars) before Latest signal appears.
Entry Shows the entry level where the latest bullish or bearish signal was generated.
Level 1 (TP1) First target level, based on 1:1 risk-reward ratio. Used for partial booking to secure profits.
Level 2 (TP2) Final target level where you can exit the remaining position.
SL (Stop Loss) Shows the maximum risk limit for the trade. Helps you control losses.
MTM (Mark to Market) Shows the difference between CMP and Entry Level. Helps track how far price has moved since entry.
P&L (Profit & Loss) Shows the difference between Entry and Target Level achieved. Helps measure actual gain or loss.
Date & Time Displays when the latest bullish or bearish signal was generated. Helps check how old or fresh the signal is.
Timeframe Scanner or Current Signal (Trend) on Different Timeframes. Shows the current signal across multiple timeframes.
Row 1 Fixed signals for 1M and 3M.
Row 2 Any 2 Custom Timeframes chosen in input settings.
Traders use this to confirm signals across different timeframes before entering trades. Example If the Day trend is bullish but the 15M chart shows bearish, many traders avoid that trade.
🚦 Gap Up & Gap Down for Untraded Price Marking.
Marks untraded price zones where price may react.
Gap Up & Down Flag Mark
Gap Up: Bullish Bias, Marked Green flag, plotted when candle opens above previous high.
Gap Down: Bearish Bias, Marked as Red flag, plotted when candle opens below previous low.
Input Settings
Enable / Disable from Chart
Threshold: Minimum gap size Threshold to detect
🟡 Institutional Candles for High Volume and Big Price Movement
Indicate strong price movement with high volume.
Marking
Displayed as Yellow Body Candles
Helps identify zones where big players are active.
Input Settings
Enable / Disable from Chart
Body %: Compare of Open & Close with High & Low
Size %: Compare Total Candle Size from Past Range
Volume %: Compare Total Candle Volume from Past Range
⚪ Neutral Candle for Low Volume and Small Price Movement
Shows low volume and minimal price movement.
Marking
Displayed as Hollow Body Candles
Traders usually avoid trading during these candles.
Input Settings
Enable / Disable from Chart.
Candle %: Compare Size of candles.
Volume %: Compare Volume of Candles from Previous Range.
🟥🟩 Supply Demand Zones (Based on Swing High & Low).
Based on swing highs and lows to identify possible reversals.
Zones
🟥Supply Zone: Near swing high, marked with Light Red Zone.
🟩Demand Zone: Near swing low, marked with Light Green Zone.
Input Settings:
Bars Left: How many past Bars Swing will Calculate.
Bars Right: After How many Bars, Zone will plot.
Max Zones: Number of Supply or Demand Zone want to plot on Chart
Delete Breaked Zones: Want to see Disappeared Zone, Uncheck it.
Extend Right: Want to see till End of the Chart, Uncheck it.
📈 Mega Trend Band (Based on HMA) for Overall Trend
Based on HMA (Hull Moving Average) to show overall trend and Help in Filters out trades against the main trend.
Working
Price above band → Bullish trend
Price below band → Bearish trend
Input Setting
Enable / Disable from Chart
HMA Period Setting: 45
👓 How to Use All together for Better Confidence.
🔍Watch for the New Entry icon on the chart.
Find New Signals with help of Automated Alerts.
Check Entry Level, SL, Level 1 and Level 2 (TP2).
Verify Date & Time → how fresh the signal is. Signal not too old.
🧭 Signal is not Self Sufficient for Good Accuracy. So, we suggest a few rules.
Cross‑Check Current Signal with Timeframe Scanner. Trade only when smaller timeframe aligns with bigger trend. (e.g., If Day = Bullish ▲ but 15M = Bearish ▼, avoid entry. Trend may not be stronger.)
Validate with Market Context of Gap. (e.g., If new signal came on Gap Up / Gap Down, avoid entry. Price may reverse.)
Zone Awareness Use Supply Demand zones to refine entries/exits and avoid false signals. (e.g., Entry: If any zone is available between Entry and Level 01, Avoid trade until Zone breaked, Exit: If Zone create between the trade, modify SL according to T-SL and wait.
Trend Filter of overall direction. (e.g., If Mega Trend Band Bullish and Trend is Bearish, Avoid the Trade.)
🕵🏻 Quick Checklist Before Trade
Bullish or Bearish signal?
Dashboard Table shows fresh entry?
SL defined and acceptable risk?
Timeframe Scanner aligned?
No Neutral candle interference?
Institutional candle or Gap supports move?
Supply/Demand zone not against trade?
✅ All Okay - Go for the ENTRY
Set a Proper Entry Point
Always respect SL, Good Trader Never avoid it.
Book partial profits at Level 1, It secure your Trade.
Keep Modifying your SL, According to T-SL Level.
On Level 2, Exit remaining All position for full profit.
📊 Healthy Trading Tips
Risk Small: Never risk more than 1–2% per trade.
Size Smart: Adjust position size to volatility and account size.
Diversify: Don’t put all money in one asset/sector.
Plan Ahead: Set entry, exit, and stop‑loss before trading.
Trade Less: Focus on quality setups, avoid overtrading.
Use Both Analyses: Combine technical charts with fundamental news/events.
Control Emotions: Stick to strategy, avoid fear/greed.
Journal Trades: Record reasons, outcomes, and lessons.
Stay Informed: Track economic calendars and global events.
Take Breaks: Step away after wins/losses to reset.
🎯 Advanced Discipline
Partial Exit: Book profits in stages (e.g., 50% at 1:1, 50% at Final Level).
Check News: Avoid trading during major announcements.
No Tweaks: Don’t change plan mid‑trade; wait for SL/TP.
Fixed Rules: Trade with fixed risk, fixed gains.
No Averaging Losses: Close bad trades, don’t add more.
Keep Learning: Evolve strategy with market changes.
Believe: Trust your plan and process.
Backtest: Practice setups until they’re second nature.
Daily Routine: Pre‑market Preparation, post‑market review.
Optimize Setup: Clean workspace, fast platform, no distractions.
Track Metrics: Win rate, average reward, expectancy, time of day, setup performance.
Trader Identity: Follow rules; money is a byproduct.
Liquidity Check: Avoid low‑volume instruments.
Respect Trend: Trade with momentum, not against it.
Avoid Over‑Leverage: Keep leverage low, avoid margin unless planned.
Risk Disclaimer
This content, including any tools, software, datafeeds, indicators, or scanners, is provided strictly for charting, educational, informational, and paper‑trading purposes only. It does not constitute investment advice, buy/sell recommendations, or real‑money trading strategies.
Not Advisors: We are not registered as investment advisors or research analysts.
Charting Only: Use is limited to testing strategies and evaluation; any application to real trading is at the user’s sole risk.
No Liability: No liability is accepted for financial loss, trading loss, or damages arising from use of the tools or data.
Data Limitations: Market data may be delayed, inaccurate, or incomplete. Past or hypothetical performance is not indicative of future results.
Signals Disclaimer: Automated signals are for evaluation only and should not be treated as accurate or real trading instructions.
High Risk: Trading and investing involve substantial risk and can result in losses beyond the initial capital.
Independent Judgment: Users must exercise independent judgment and consult licensed professionals before making financial decisions
⚠️ Final Note: Trading is speculative and may not be suitable for all investors. Use only risk capital and never invest money you cannot afford to lose.
✅ Always remember🧠 my 3R Rule💡: If the money💰 is yours then, RISK⚖️, REWARD🏆 and REGRET😔 are solely yours. 🔥

Market Compression & Entropy VectorOverview
This indicator measures market energy states and directional bias using concepts from information theory. It detects when markets are "coiling" (compression) versus "expanding" (decompression), and predicts early pivot points before they fully form.
Core Concepts
Compression-Decompression (0-1 scale)
Compression (blue): Low volatility, narrow ranges. Energy building for breakout.
Decompression (orange): High volatility, trending. Energy releasing.
Entropy Vector (-1 to +1)
Derived from buy/sell pressure using Shannon entropy:
Positive: Bullish bias (buyers dominating)
Negative: Bearish bias (sellers dominating)
Near zero: Indecision
Early Pivot Detection
Predicts reversals using 5 confluence factors:
Entropy vector crossing zero
Momentum exhaustion (rate of change reversal)
Compression exit (breakout from consolidation)
Price-entropy divergence
Extreme entropy readings
Signals
Signal Meaning
BUY Exiting compression with bullish entropy
SELL Exiting compression with bearish entropy
TOP (diamond) High probability of downward reversal
BTM (diamond) High probability of upward reversal
Key Settings
Pivot Sensitivity (1-10): Higher = more pivot signals
Pivot Score Threshold (30-90): Minimum score to trigger pivot marker
Compression/Decompression Thresholds: Define phase boundaries
Info Table
Displays real-time metrics including compression score, entropy vector, directional bias, and pivot prediction scores for tops/bottoms.
Best Use
Wait for compression phase (blue background)
Watch entropy vector for directional bias
Enter when pivot signal aligns with entropy direction
Use decompression phase for trend-following
Tags: entropy, compression, pivot detection, reversal, momentum, volatility

KOBK 90-10The KOBK 90 10 Indicator is designed to reveal the moments most traders never see. While the market spends the majority of its time ranging, stalling, or trapping participants, this tool focuses on the rare windows when price is prepared to expand with real intent and power.
Built around precision timing and momentum ignition, KOBK 90 10 helps eliminate noise and highlight high probability expansion zones so traders are no longer guessing or chasing moves. When the 90 percent of market noise fades, this indicator brings clarity to the 10 percent that truly matters.
In my classes, traders are also taught how to risk 10 percent or less to pursue up to 90 percent of the move, using this tool as part of a disciplined, structured approach to execution. The goal is not prediction, but controlled risk, patience, and positioning when the market is ready to deliver.
This is a powerful timing tool built for indices, futures, and major pairs, designed for traders who value precision, structure, and confidence when it matters most.
