OC Chain_ROC_RSI15-minute indicator that detects a 3-candle “inside” chain where each candle’s open & close remain within the previous candle’s open-close range. Plots horizontal Open/Close levels on candles when ROC(2) moves beyond a configurable ±threshold, and highlights candles when RSI is strong (>55) or weak (< user set level, e.g., 30–32). Adjustable ROC/RSI settings and line extension options.
Bands and Channels


Long Bollinger Bands StrategyLong Bollinger Bands Strategy (XAUUSD) — Lower Band Reversal + 4-Step Scaling + Daily DD Guard
Long Bollinger Bands Strategy is a long-only Bollinger Bands reversal/mean-reversion strategy designed mainly for XAUUSD. It looks for a bearish push below the Lower Band followed by a bullish reclaim on candle close, then optionally scales in up to 4 entries (E1–E4) as price pulls back.
1) Risk Management & Position Sizing
The strategy includes a USD-based risk input: Risk per setup (USD).
It automatically calculates position size using the average SL distance across the 4-entry structure, then distributes size across entries with built-in weighting.
BackTest Lot checkbox:
OFF (default): uses normalized sizing (qty divided by 100)
ON: uses raw qty for backtesting workflows
2) SL/TP Management (Locked SL + Optional Range TP)
Stop Loss (SL): based on SL distance (pips from entry) from E1.
Take Profit (TP):
If TP (pips) > 0: fixed pip TP from E1
If TP (pips) = 0: TP is based on the signal candle range (high–low)
SL Lock: once the stop is tightened, it never loosens again (only moves in a protective direction) until the trade closes.
3) Daily Drawdown Protection
Tracks equity by day and stops opening new positions once Max daily drawdown (USD) is reached for that day.
4) Notes / Disclaimer
This strategy does not use volume, RSI, fundamentals, news filters, or session filters. Users should apply discretion and consider confirmations from other tools and market context. Results depend on symbol settings, spread, commission, and volatility regime. Always forward-test before using in live trading.
Designed for XAUUSD. The script uses an internal pip conversion (pipSize = 0.1) consistent with common gold quoting; verify your broker’s pip definition for best alignment.
5) Suggested Usage
Best used during volatile conditions or after a clear lower-band sweep and reclaim.
Consider pairing with trend filters or higher-timeframe bias.
6) Release Notes
Initial release: Long-only BB reclaim logic with 4-step scaling
Added: SL/TP lock logic and visual SL/TP lines
Added: Daily drawdown guard and backtest lot toggle OANDA:XAUUSD

mama special indcator Below is a faithful English translation, preserving the structure and intent of the original text.
---
# Mom’s Dedicated Indicator – User Manual 📈
## What Does This Indicator Do?
This indicator helps you see **whether the current direction is up or down**, and reminds you when it may be appropriate to buy or sell.
In simple terms:
* When you see a **green “Long”** label → you may consider buying (going long)
* When you see a **red “Short”** label → you may consider selling (going short)
* The top-right corner shows whether the market is currently **Bullish**, **Bearish**, or **Ranging**
---
## What Do the Things on the Screen Mean?
### The Colored Lines (Moving Averages)
| Line Color | Name | Meaning |
| ----------------- | -------------------- | ---------------------------------------------- |
| Lightest blue | Ultra-fast line (13) | Reacts the fastest, but also whipsaws the most |
| Light blue | Fast line (21) | Short-term direction |
| Medium blue | Mid line (55) | Medium-term direction |
| Dark blue (thick) | Slow line (89) | More stable direction |
| Gold (thickest) | Baseline (200) | Major trend, the most important one |
**Simple way to judge:**
* Price **above** the gold line → overall trend is bullish
* Price **below** the gold line → overall trend is bearish
### The Small Box in the Top-Right Corner
* **Current Direction**: Tells you whether the market is bullish, bearish, or ranging
* **Strength**:
* ✓ means the trend is strong enough
* ✗ means the momentum is insufficient
---
## How Should I Adjust the Settings?
In the indicator settings (click the gear ⚙️ next to the indicator name), you will see the following options:
### 1. Crossover Combinations (Sensitivity Selection)
| Option | Number of Signals | Suitable For |
| ------------------------ | ----------------- | --------------------------------------------- |
| Ultra Aggressive (13/21) | Most | Want many alerts, not afraid of false signals |
| Very Aggressive (13/55) | Very many | More active traders |
| Aggressive (13/89) | Many | Want more opportunities |
| Standard Fast (21/55) | Medium-high | Balanced but slightly aggressive |
| **Standard (21/89)** | **Medium** | **Recommended – best balance** |
| Conservative (55/89) | Few | Only want the most reliable signals |
**Mom’s recommendation:** Start with **Standard (21/89)**. Try other options after you are familiar with it.
### 2. Only Signal in the Direction of the Trend
* **On (recommended):** Signals appear only when aligned with the major trend
* **Off:** Signals appear regardless of trend (higher risk)
### 3. Use ADX to Filter Ranging Markets
* **On (recommended):** Shows “Ranging” when the market lacks momentum, avoiding random trades
* **Off:** Signals appear regardless of market strength
### 4. ADX Threshold
* Higher number = stricter requirements
* **Recommended: 20** (default)
* If you feel there are too few signals, lower it to 15
* If you feel there are too many false signals, raise it to 25
### 5. Show Auxiliary Lines
* On: Displays the colored moving average lines
* Off: Cleaner chart, signals only
### 6. Show Direction Indicator
* On: Displays the direction box in the top-right corner
* Off: Does not display it
---
## How Do I Use This Indicator?
### Step 1: Check the Major Trend
Look at the top-right box:
* **Bullish** + strength ✓ → look for buying opportunities
* **Bearish** + strength ✓ → look for selling opportunities
* **Ranging** → **do nothing and wait**
### Step 2: Wait for a Signal
* Green “Long” → you may consider buying
* Red “Short” → you may consider selling
### Step 3: Confirm the Timeframe
* If you see a yellow warning: **“⚠️ Please use 1-hour chart or above”**
* It means your current timeframe is too short (e.g., 5-minute or 15-minute)
* **Switch to 1-hour, 4-hour, or daily charts**
---
## Important Reminders ⚠️
### What This Indicator Does *Not* Tell You:
1. **When to exit** — It only helps with entries; exits are your own decision
2. **How much to buy** — Decide based on your own risk tolerance
3. **Guaranteed profits** — No indicator can guarantee profitability
### Safe Trading Guidelines:
1. **Do not all-in** — Use only a small portion of your capital each time
2. **Set a stop loss** — Decide in advance how much loss you can accept
3. **Do not force trades in ranging markets** — If it says “Ranging,” rest
4. **Do not chase highs or sell lows** — If price has already moved too far, skip it
5. **Use higher timeframes** — 1-hour, 4-hour, or daily charts are more stable
### The Most Important Sentence:
> **“Better to miss a trade than to make a wrong one.”**
>
> When you are not confident, doing nothing is the best choice.
---
## Quick Reference Card
| What I See | What I Should Do |
| -------------------------- | ------------------------------ |
| “Bullish” + ✓ in top-right | Look for buying opportunities |
| “Bearish” + ✓ in top-right | Look for selling opportunities |
| “Ranging” in top-right | Do nothing, wait |
| Green “Long” label | Consider buying |
| Red “Short” label | Consider selling |
| Yellow warning label | Switch to a higher timeframe |
| Strength shows ✗ | Trend is weak, be cautious |
---
## Have Questions?
This indicator was designed specifically for you. If anything is unclear, or if you want to adjust any features, just let me know anytime.
❤️ Wishing Mom smooth investing and steady profits!
媽媽專用指標 使用說明書 📈
這個指標是做什麼的?
這個指標會幫妳看「現在的方向是往上還是往下」,然後在適合的時候提醒妳可以買或賣。
簡單來說:
看到 綠色「多」 的標籤 → 可以考慮買進(做多)
看到 紅色「空」 的標籤 → 可以考慮賣出(做空)
右上角會顯示目前是「看漲」、「看跌」還是「震盪」
畫面上的東西是什麼意思?
那些彩色的線(均線)
線的顏色
名稱
意思
最淺的藍色
超快線 (13)
反應最快,但也最容易亂跳
淺藍色
快線 (21)
短期方向
中藍色
中線 (55)
中期方向
深藍色(粗)
慢線 (89)
比較穩定的方向
金色(最粗)
基準線 (200)
大方向,最重要!
簡單判斷法:
價格在金色線「上面」→ 大方向是漲的
價格在金色線「下面」→ 大方向是跌的
右上角的小框框
目前方向:告訴妳現在是看漲、看跌、還是震盪
強度:後面有 ✓ 表示趨勢夠強,有 ✗ 表示力道不夠
設定選項怎麼調?
在指標設定裡面(點指標名稱旁邊的齒輪 ⚙️),有這些選項:
1. 交叉組合(選擇敏感度)
選項
信號多寡
適合誰
超激進 (13/21)
最多
想要很多提示,不怕假信號
很激進 (13/55)
很多
比較積極的操作
激進 (13/89)
多
想多一點機會
標準偏快 (21/55)
中等偏多
想要平衡但稍微積極
標準 (21/89)
中等
建議用這個,最平衡
保守 (55/89)
少
只想要最可靠的信號
媽媽建議: 先用「標準 (21/89)」就好,等熟悉了再試其他的。
2. 順著方向才給信號
打開(建議):只有大方向對的時候才會提示
關掉:不管方向都會提示(比較危險)
3. 用ADX過濾震盪
打開(建議):市場沒力氣的時候會顯示「震盪」,避免亂買賣
關掉:不管市場有沒有力氣都會給信號
4. ADX門檻
數字越大,要求越嚴格
建議用 20(預設值)
如果覺得信號太少,可以降到 15
如果覺得假信號太多,可以升到 25
5. 顯示輔助線
打開:會看到那些彩色的線
關掉:畫面比較乾淨,只看信號
6. 顯示方向提示
打開:右上角會有小框框顯示方向
關掉:不顯示
怎麼用這個指標?
步驟一:先看大方向
看右上角的框框:
顯示「看漲」+ 強度有 ✓ → 適合找機會買
顯示「看跌」+ 強度有 ✓ → 適合找機會賣
顯示「震盪」→ 先不要動,等待就好
步驟二:等信號出現
看到綠色「多」→ 可以考慮買進
看到紅色「空」→ 可以考慮賣出
步驟三:確認時間週期
畫面上如果出現黃色警告「⚠️ 請用1小時圖或以上」
表示妳現在看的時間太短了(例如5分鐘、15分鐘)
請切換到1小時或4小時或日線圖
重要提醒 ⚠️
這個指標「不會」告訴妳的事情:
什麼時候該出場 — 指標只告訴妳進場時機,出場要自己決定
該買多少 — 請根據自己能承受的風險決定
一定會賺錢 — 沒有任何指標能保證獲利
安全操作建議:
不要all-in — 每次只用一小部分資金
設停損 — 買進之後,決定好「跌到多少就認賠」
震盪時不要硬做 — 右上角顯示震盪就休息
不要追高殺低 — 信號出現後如果價格已經跑很遠,就算了
用大一點的時間週期 — 1小時、4小時、日線比較穩
最重要的一句話:
「寧可錯過,不要做錯」
沒把握的時候,不做就是最好的選擇。
快速參考卡
我看到...
我應該...
右上角「看漲」+ ✓
可以找機會買
右上角「看跌」+ ✓
可以找機會賣
右上角「震盪」
不要動,等待
綠色「多」標籤
可以買進
紅色「空」標籤
可以賣出
黃色警告標籤
換到更大的時間週期
強度後面是 ✗
趨勢不夠強,要小心
如果有問題?
這個指標是專門為妳設計的,如果有看不懂的地方,或是想要調整什麼功能,隨時跟我說!
❤️ 祝媽媽投資順利,穩穩賺錢!

Volume-Gated Trend Ribbon [QuantAlgo]🟢 Overview
The Volume-Gated Trend Ribbon employs a selective price-updating mechanism that filters market noise through volume validation, creating a trend-following system that responds exclusively to significant price movements. The indicator gates price updates to moving average calculations based on volume threshold crossovers, ensuring that only bars with significant participation influence the trend direction. By interpolating between fast and slow moving averages to create a multi-layered visual ribbon, the indicator provides traders and investors with an adaptive trend identification framework that distinguishes between volume-backed directional shifts and low-conviction price fluctuations across multiple timeframes and asset classes.
🟢 How It Works
The indicator first establishes a dynamic baseline by calculating the simple moving average of volume over a configurable lookback period, then applies a user-defined multiplier to determine the significance threshold:
avgVol = ta.sma(volume, volPeriod)
highVol = volume >= avgVol * volMult
The gated price mechanism employs conditional updating where the close price is only captured and stored when volume exceeds the threshold. During low-volume periods, the indicator maintains the last qualified price level rather than tracking every minor fluctuation:
var float gatedClose = close
if highVol
gatedClose := close
Dual moving averages are calculated using the gated price input, with the indicator supporting various MA types. The fast and slow periods create the outer boundaries of the trend ribbon:
fastMA = volMA(gatedClose, close, fastPeriod)
slowMA = volMA(gatedClose, close, slowPeriod)
Ribbon interpolation creates intermediate layers by blending the fast and slow moving averages using weighted combinations, establishing a gradient effect that visually represents trend strength and momentum distribution:
midFastMA = fastMA * 0.67 + slowMA * 0.33
midSlowMA = fastMA * 0.33 + slowMA * 0.67
Trend state determination compares the fast MA against the slow MA, establishing bullish regimes when the faster average trades above the slower average and bearish regimes during the inverse relationship. Signal generation triggers on state transitions, producing alerts when the directional bias shifts:
bullish = fastMA > slowMA
longSignal = trendState == 1 and trendState != 1
shortSignal = trendState == -1 and trendState != -1
The visualization architecture constructs a three-tiered opacity gradient where the ribbon's core (between mid-slow and slow MAs) displays the highest opacity, the inner layer (between mid-fast and mid-slow) shows medium opacity, and the outer layer (between fast and mid-fast) presents the lightest fill, creating depth perception that emphasizes the trend center while acknowledging edge uncertainty.
🟢 How to Use This Indicator
▶ Long and Short Signals: The indicator generates long/buy signals when the trend state transitions to bullish (fast MA crosses above slow MA) and short/sell signals when transitioning to bearish (fast MA crosses below slow MA). Because these crossovers only reflect volume-validated price movements, they represent significant level of participation rather than random noise, providing higher-conviction entry signals that filter out false breakouts occurring on thin volume.
▶ Ribbon Width Dynamics: The spacing between the fast and slow moving averages creates the ribbon width, which serves as a visual proxy for trend strength and volatility. Expanding ribbons indicate accelerating directional movement with increasing separation between short-term and long-term momentum, suggesting robust trend development. Conversely, contracting ribbons signal momentum deceleration, potential trend exhaustion, or impending consolidation as the fast MA converges toward the slow MA.
▶ Preconfigured Presets: Three optimized parameter sets accommodate different trading styles and market conditions. Default provides balanced trend identification suitable for swing trading on daily timeframes with moderate volume filtering and responsiveness. Fast Response delivers aggressive signal generation optimized for intraday scalping on 1-15 minute charts, using lower volume thresholds and shorter moving average periods to capture rapid momentum shifts. Smooth Trend offers conservative trend confirmation ideal for position trading on 4-hour to weekly charts, employing stricter volume requirements and extended periods to filter noise and identify only the most robust directional moves.
▶ Built-in Alerts: Three alert conditions enable automated monitoring: Bullish Trend Signal triggers when the fast MA crosses above the slow MA confirming uptrend initiation, Bearish Trend Signal activates when the fast MA crosses below the slow MA confirming downtrend initiation, and Trend Change alerts on any directional transition regardless of direction. These notifications allow you to respond to volume-validated regime shifts without continuous chart monitoring.
▶ Color Customization: Six visual themes (Classic, Aqua, Cosmic, Ember, Neon, plus Custom) accommodate different chart backgrounds and display preferences, ensuring optimal contrast and visual clarity across trading environments. The adjustable fill opacity control (0-100%) allows fine-tuning of ribbon prominence, with lower opacity values create subtle background context while higher values produce bold trend emphasis. Optional bar coloring extends the trend indication directly to the price bars, providing immediate directional reference without requiring visual cross-reference to the ribbon itself.

UK100 London Judas & IFVG SetupUK100 London Judas & IFVG Setup
Overview This indicator is a specialized trading tool designed to automate the ICT Judas Swing strategy specifically for the UK100 (FTSE 100) index during the London Market Open. It combines institutional time-based logic with price action confirmation using Inversion Fair Value Gaps (IFVG) to identify high-probability reversal setups.
How It Works The strategy is based on the concept that the initial move after the London Open is often a "fake-out" (manipulation) designed to trap retail traders and engineer liquidity before the true trend of the day begins.
Session & Opening Price:
The script marks the London Open price (default 09:00 Warsaw / 08:00 London time) with a dashed line.
This serves as the "line in the sand." Prices moving away from this line initially are monitored for manipulation.
Judas Swing (Liquidity Sweep):
If price moves BELOW the open, it is hunting Sell-Side Liquidity (trapping sellers).
If price moves ABOVE the open, it is hunting Buy-Side Liquidity (trapping buyers).
The Entry Trigger: Inversion FVG (IFVG):
The indicator scans for Fair Value Gaps (FVG) created during the manipulation phase.
BUY Signal: The price manipulates lower, creates a Bearish FVG (Red Box), but then aggressively reverses and closes ABOVE that gap. The gap is now "Inverted" (turns Green), acting as support.
SELL Signal: The price manipulates higher, creates a Bullish FVG (Green Box), but then aggressively reverses and closes BELOW that gap. The gap is now "Inverted" (turns Orange), acting as resistance.
Key Features
Automated Pattern Recognition: No need to manually draw gaps. The script detects valid FVG inversions that align with the Judas Swing logic.
Built-in Risk Calculator: The signal labels display the exact Lot Size you should use based on your account balance and risk percentage (default 0.5%). It calculates this dynamically based on the Stop Loss distance.
Institutional Targets: The indicator fetches H1 Fractals (Liquidity) from the 1-hour timeframe and plots them on your 1-minute chart as blue lines. These are your primary Take Profit (TP) levels.
Stop Loss Visualization: Automatically suggests a Stop Loss placement behind the swing high/low of the reversal structure.
How to Use
Timeframe: Set your chart to 1 Minute (1m).
Asset: UK100 (FTSE 100).
Wait: Allow the London session to open. Watch for price to move away from the opening line.
Execute: When a BUY or SELL label appears:
Enter the trade using the Lot Size shown on the label.
Set your Stop Loss at the price shown on the label.
Target the blue H1 Liquidity lines for profit taking.
Settings
Timezone: Set this to your chart/exchange timezone (Default: Europe/Warsaw).
Account Balance: Input your current trading capital (e.g., 100,000) for accurate risk calculations.
Risk Per Trade %: The percentage of your account you are willing to lose if the Stop Loss is hit (Standard: 0.5% - 1.0%).
Contract Size: The value of 1 point movement (Check your broker's specifications. Usually 1 for CFDs).
Alerts You can set a single alert in TradingView to capture all signals. Select the indicator and choose "Any alert() function call". You will receive a notification with the direction (Buy/Sell), Entry Price, and Lot Size.

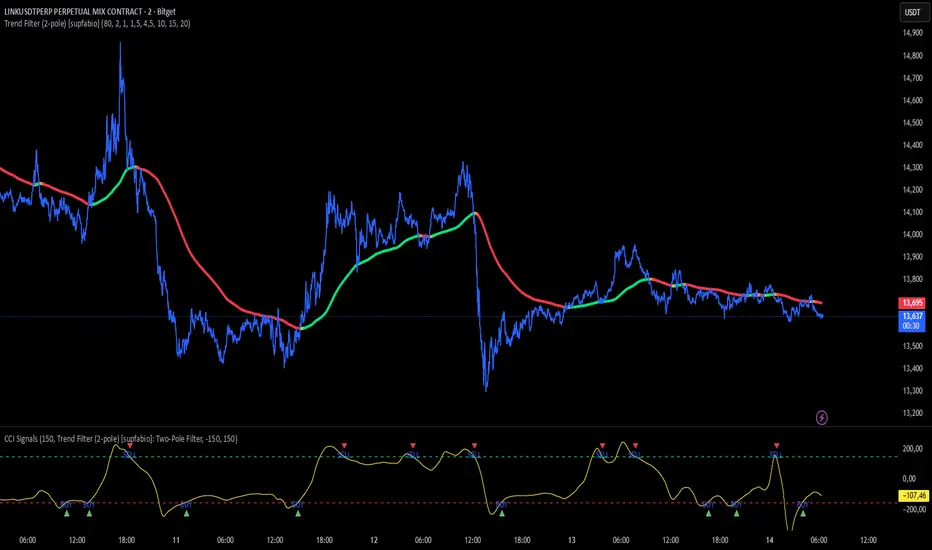
CCI + Buy/Sell Cross (supfabio)This indicator is an enhanced version of the Commodity Channel Index (CCI) designed to generate clear BUY and SELL signals based on customizable level crossovers, with built-in support for webhook automation and external trade execution.
🔹 Signal Logic
BUY Signal:
Triggered when the CCI crosses upward (from below to above) the user-defined BUY level (red line).
SELL Signal:
Triggered when the CCI crosses downward (from above to below) the user-defined SELL level (green line).
Signals can optionally be configured to trigger only on candle close, reducing real-time noise and false signals.
🔹 Key Features
✅ Original CCI calculation (standard formula preserved)
✅ Fully configurable BUY and SELL levels
✅ Optional display of signal level lines
✅ Visual BUY / SELL markers plotted on the CCI panel
✅ Support for moving average smoothing and Bollinger Bands applied to the CCI
✅ Dynamic alerts using alert(), ideal for:
Webhook integrations
Trading bots
External servers and automated execution systems
🔹 Alerts & Webhook Integration
The indicator sends dynamic alert messages containing:
Action type (BUY / SELL)
Symbol
Closing price
Timestamp
To use:
Add the indicator to your chart
Create an alert and select “Any alert() function call”
Enable Webhook URL and configure your endpoint
Done — signals will be sent automatically
🔹 Best Use Cases
Traders who use CCI as a primary entry trigger
Momentum or mean-reversion strategies
Automated trading systems
Visual backtesting and signal validation
⚠️ Disclaimer
This indicator is not a complete trading system and does not replace proper risk management. Always use it in combination with market context, confirmation tools, and sound position sizing.
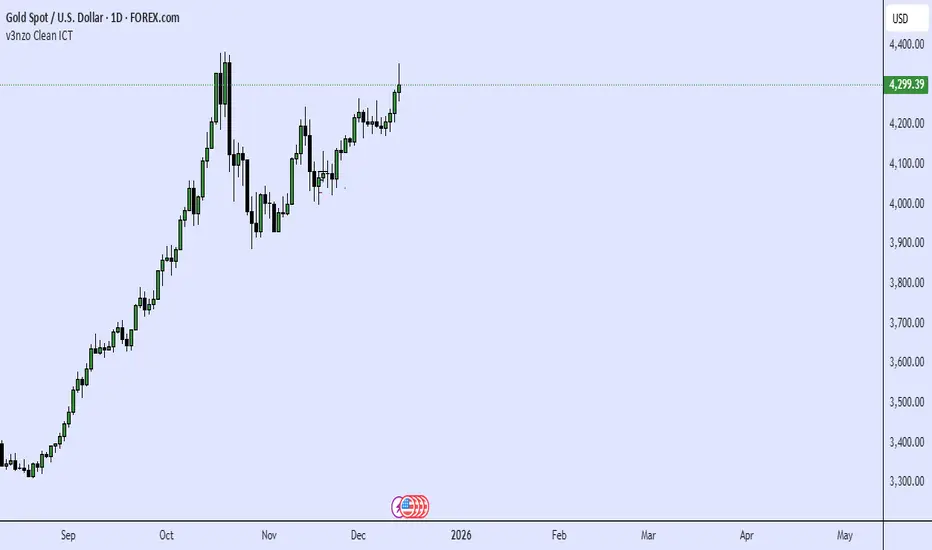
ICT Candle Reading PROICT Candle Reading – Visual Clean
This indicator is designed to provide a clean and precise price reading, based on ICT and Smart Money Concepts, without cluttering the chart.
Its purpose is to help traders identify real institutional zones, understand market intention, and improve entry timing, using pure price action.
🔹 What does this indicator show?
🟢 Fair Value Gaps (FVG / Imbalances)
Detects market inefficiencies created by impulsive moves.
Displayed as clean and minimal boxes extended into the future.
Useful as mitigation, reaction, or continuation zones.
🟠 Liquidity Sweeps
Highlights liquidity grabs above recent highs or below recent lows.
Drawn using dashed horizontal lines.
Helps identify market manipulation before the true move.
🔵 Displacement Candles
Identifies candles with dominant bodies, showing institutional momentum.
Marked with small symbols to keep the chart clean.
Useful to confirm impulse starts or shifts in market intent.
🎯 Indicator Philosophy
❌ No lagging indicators
❌ No chart clutter
✅ Real ICT concepts
✅ Clean candle reading
✅ Suitable for scalping, intraday, and swing trading
⚙️ Customization
Each concept can be enabled or disabled individually.
Zone extension length is adjustable.
Optimized for 15M, 1H, and 4H timeframes.
📈 How to use
This indicator does not provide automatic buy/sell signals.
It is best used with:
Higher timeframe bias
Market structure
Session timing (London / New York)
Proper risk management
🧠 Final Notes
ICT Candle Reading – Visual Clean helps you see the market from an institutional perspective, focusing only on what truly matters: price, liquidity, and intent.

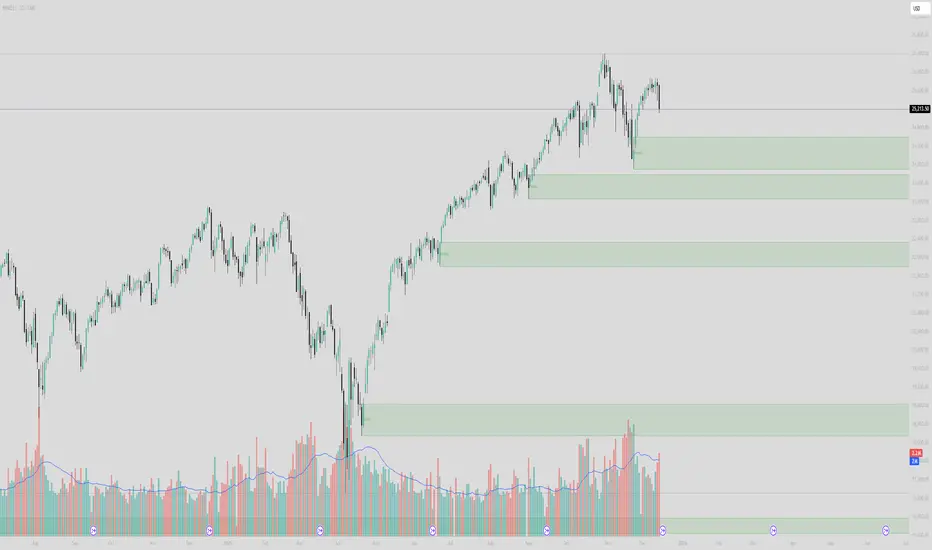
Institutional Supply/Demand (Unmitigated)Title: Institutional Supply/Demand (Unmitigated)
What it does: This indicator automatically detects and highlights Fresh Institutional Supply and Demand Zones based on market structure (Swing Highs and Swing Lows). It is designed to keep your chart clean by only showing levels that have not yet been tested.
Key Features:
Auto-Detection:
Red Boxes (Supply): Appear at major Swing Highs. These represent potential Sell Limit orders from institutions.
Green Boxes (Demand): Appear at major Swing Lows. These represent potential Buy Limit orders.
Mitigation Logic (The "Clean-Up"):
The script actively monitors price action.
If price touches a box, the box is instantly deleted.
This ensures you are never looking at "old" or "used" levels. If a box is visible on your chart, it means price has never returned to that level since it was created.
Customizable Structure:
Structure Lookback: Adjusts how sensitive the detection is.
Setting 5 (Default): Finds major, significant structure points.
Setting 3: Finds smaller, internal structure points (more zones).
How to Trade:
Wait for Price to Return: Watch for price to approach a visible Red or Green box.
Reaction: Since these are "Fresh" levels, look for a rejection (wick) or a reversal pattern as soon as price taps the zone.
No Clutter: You don't need to manually delete old lines; the script does it for you.
MNQ Quant Oscillator Lab v2.1MNQ Quant Oscillator Lab v2.1 — Clean Namespaces
Adaptive LinReg Oscillator + Auto Regime Switching + MTF Confirmation + MOEP Gate + Research Harness
MNQ Quant Oscillator Lab is a research-grade oscillator framework designed for MNQ/NQ (and other liquid futures/indices) on 1-minute and intraday timeframes. It combines a linear-regression-based detrended oscillator with quant-style normalization, adaptive parameterization, regime switching, multi-timeframe confirmation, and an optional MOEP (Minimum Optimal Entry Point) gate. The goal is to provide a customizable signal laboratory that is stable in real time, non-repainting by default, and suitable for systematic experimentation.
What this indicator does
1) Core oscillator (quant-normalized)
The indicator computes a linear regression (LinReg) detrended signal and expresses it as a z-scored oscillator for portability across volatility regimes and assets. You can switch the oscillator “transform family” via Oscillator type:
LinReg Residual / Residual Z: detrended residual (mean-reversion sensitive)
LinReg Slope Z: regression slope (trend-derivative sensitive)
LogReturn Z: log-return oscillator (momentum-style)
VolNorm Return Z: volatility-normalized returns (risk-scaled)
This yields a single oscillator that is comparable over time, not tied to raw point values.
2) Adaptive length (dynamic calibration)
When enabled, the regression length is automatically adapted using a volatility-regime proxy (ATR% z-scored → logistic mapping). High volatility typically shortens the effective lookback; low volatility allows longer lookbacks. This helps the oscillator remain responsive during expansions while staying stable in compressions.
Important: the adaptive logic is implemented with safe warmup behavior, so it will not throw NaN errors on early bars.
3) Adaptive thresholds (dynamic bands)
Instead of static overbought/oversold levels, the indicator can compute dynamic upper/lower bands from the oscillator’s own distribution (rolling mean + sigma). This creates thresholds that adjust automatically to regime changes.
4) Auto regime switching (Trend vs Mean Reversion)
With Auto regime switch enabled, the indicator selects whether to behave as a Trend system or a Mean Reversion system using an interpretable heuristic:
Trend regime when EMA-spread is strong relative to ATR and ATR is rising
Otherwise defaults to Mean Reversion
This prevents running mean-reversion logic in trend breakouts and reduces “mode mismatch.”
5) Multi-timeframe (MTF) confirmation (optional)
MTF confirmation can be enabled to require that the higher timeframe oscillator sign aligns with the direction of the signal. This is useful for reducing noise on MNQ 1m by requiring higher-timeframe structure agreement (e.g., 5m or 15m).
6) MOEP Gate (optional “institutional” filter)
The MOEP gate is a confluence score filter intended to reduce low-quality signals. It aggregates multiple components into a 0–100 score:
BB/KC squeeze condition
Expansion proxy
Trend proxy
Momentum proxy (RSI-based)
Volume catalyst (volume z-score)
Structure break (highest/lowest break)
You can set:
Score threshold (minimum score required)
Minimum components required (forces diversity of evidence)
When enabled, a signal must satisfy both oscillator logic and MOEP confluence conditions.
7) Research harness (NON-CAUSAL, OFF by default)
A built-in research mode evaluates signals using future bars to compute basic forward excursion statistics:
MFE (max favorable excursion)
MAE (max adverse excursion)
Simple win-rate proxy based on MFE vs MAE
This feature is strictly for offline analysis and tuning. It is disabled by default and should not be considered “live-safe” because it uses future information for evaluation.
Signals and interpretation
Mean Reversion regime
Long: oscillator is below the lower band and turns back upward across it
Short: oscillator is above the upper band and turns back downward across it
Trend regime
Long: oscillator crosses above zero (optionally requires structure break confirmation)
Short: oscillator crosses below zero (optionally requires structure break confirmation)
Hybrid
When Hybrid is selected (manual mode), the indicator allows both trend and mean-reversion triggers, but still respects the filters and gates you enable.
Recommended starting configuration (MNQ 1m)
If you want stable, high-quality signals first, then expand into research:
Use RTH only: ON
Auto regime switch: ON
Adaptive length: ON
Adaptive bands: ON
MTF confirmation: OFF initially (turn ON later with 5m)
MOEP Gate: OFF initially (turn ON after you confirm base behavior)
Research harness: OFF (only enable for tuning studies)
Practical notes / transparency
The indicator is designed to be stable on live bars (optional confirmed-bar behavior reduces flicker).
No repainting logic is used for signals.
Any “performance” numbers shown under Research harness are not tradable metrics; they are forward-looking evaluation outputs intended strictly for experimentation.
Disclaimer
This script is provided for educational and research purposes only and does not constitute financial advice. Futures trading involves substantial risk, including the possibility of loss exceeding initial investment.

Nifty-50 Futures trading ideas with RSI and ADX FilterNifty Futures @15M is a trend-following strategy derived from the Savitzky Flow Bands methodology by ChartPrime , adapted into a complete strategy with structured trade execution and risk controls.
The strategy identifies directional bias using a Savitzky-smoothed price structure and executes trades based on trend changes or continuation, depending on the selected entry mode.
Configurable Entry Modes are : 1. Change Only (trend reversal based) 2.Continuation Allowed (trend follow-through).
Optional ADX + DI and RSI filters help validate trend strength and avoid unfavorable market conditions.
Risk management features include configurable Stop-Loss and Take-Profit, ATR-based exits, trailing stop, and separate maximum loss per trade (₹) for long and short positions.
Date and session filters are provided for controlled backtesting.
This script is published for educational and analytical purposes only and is intended for research and backtesting, not as a trading signal or investment recommendation.
Credits:
Original indicator concept: Savitzky Flow Bands by ChartPrime
Strategy conversion & enhancements: @Alpha_Trinity

Victor aimstar future strategyThis script "The Next Pivot" uses various similarity measures to compare historical price sequences to the current price sequence!
Features
Find the most similar price sequence up to 100 bars from the current bar
Forecast price path up to 250 bars
Forecast ZigZag up to 250 bars
Spearmen
Pearson
Absolute Difference
Cosine Similarity
Mean Squared Error
Kendall
Forecasted linear regression channel

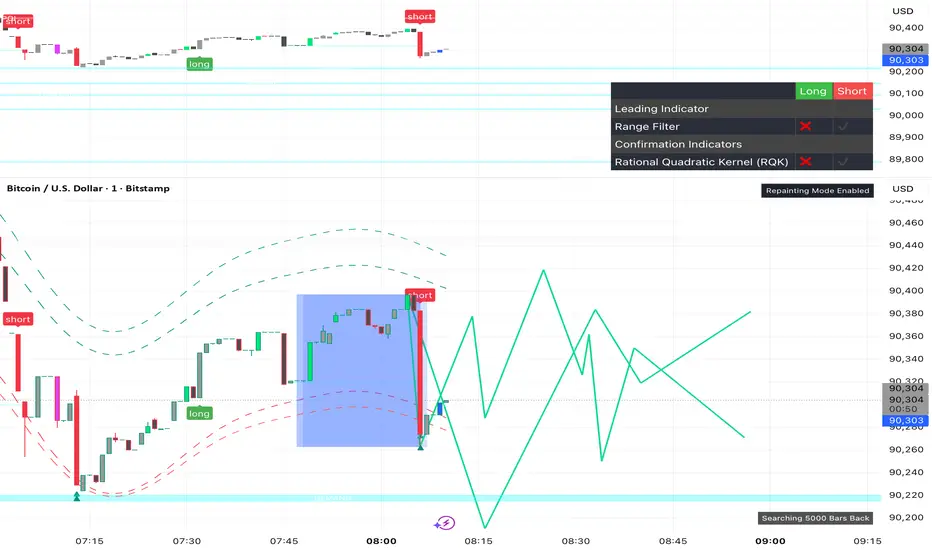
Victor aimstar Present strategyHere we have created an envelope indicator based on Kernel Smoothing with integrated alerts from crosses between the price and envelope extremities. Unlike the Nadaraya-Watson estimator, this indicator follows a contrarian methodology.
Please note that by default this indicator can be subject to repainting. Users can use a non-repainting smoothing method available from the settings. The triangle labels are designed so that the indicator remains useful in real-time applications.

Auto Trend [theUltimator5]The Auto Trend indicator was designed to be a unique pattern detection indicator without the use of standard pivot point logic or high/low lines. It is a study in pattern detection by using iterative best-fit logic.
The indicator automatically identifies and draws trend channels by analyzing price action across configurable lookback periods. It finds optimal high and low trendlines that contain price movement, with a middle line marking the trend's center.
Key Features:
Automatic Pattern Detection - Intelligently searches for the best lookback period where price stays within the channel boundaries
Dual Pattern Modes - Choose between Short (20-66 bars) for quick patterns or Long (50-500 bars) for extended trends. Note - the long pattern is fully configurable and can be set anywhere up to 5000 bars.
Smart Caching - Optimized performance that only recalculates when necessary
Customizable Starting Point - Click directly on the chart to set where the trend channel begins
Flexible Lookback Range - Set minimum and maximum lookback periods to match your trading style
Visual Debugging - Optional label displays the active lookback period and violation count
How It Works:
The indicator divides the lookback period into thirds, finds the highest and lowest closes in the first and last thirds, then draws trendlines connecting these points. It can automatically search through different lookback periods to find the one with the fewest price violations (closes outside the channel).
Settings:
Use Auto Lookback - Enable automatic optimal lookback detection
Pattern Length - Short (faster, 1-bar increments) or Long (broader, 5-bar increments)
Min/Max Lookback - Define the search range for the Long pattern
Manual Lookback - Override auto-detection with a fixed period
Custom Colors - Personalize the high, low, and middle line colors
Starting Point - Select where the trend analysis begins
Use Cases:
Identify dominant trend channels across different timeframes
Spot potential support and resistance levels
Determine trend strength and consistency
Time entries and exits based on channel position
The indicator supports up to 5000 bars of historical data for comprehensive trend analysis.

$$\text{Entry and Exit Signals (RSI, MACD, Stochastic)}$$بالتأكيد. إليك شرح كامل للكود البرمجي (Pine Script) الذي يمثل استراتيجية مؤشر الزخم الثلاثي (RSI, MACD, Stochastic) باللغة الإنجليزية، مع توضيح منطق كل شرط:
-----
## 🇺🇸 Multi-Indicator Momentum Confirmation Strategy (Pine Script Explanation)
This custom indicator is designed to generate highly confirmed **Entry (Buy)** and **Exit (Sell/Short)** signals by ensuring that three key momentum and oscillator indicators—**RSI, MACD, and Stochastic**—are all aligned in the same direction.
### 📜 Indicator Code Structure
```pinescript
//@version=5
indicator("إشارات الدخول والخروج (RSI, MACD, Stochastic)", overlay=true)
// --- 1. Indicator Settings (Inputs) ---
rsiLength = input.int(14, title="RSI Length")
rsiLevel = input.float(50, title="Positive RSI Level")
// ... MACD and Stochastic inputs
// --- 2. Calculation of Indicators ---
rsiValue = ta.rsi(close, rsiLength)
= ta.macd(close, fastLength, slowLength, signalLength)
stochK = ta.stoch(close, high, low, stochKLength)
// --- 3. Entry (Bullish) and Exit (Bearish) Conditions ---
//
// --- 4. Final Signal Determination ---
finalEntrySignal = rsiCondition_Bullish and macdCondition_Bullish and stochCondition_Bullish
finalExitSignal = rsiCondition_Bearish and macdCondition_Bearish and stochCondition_Bearish
// --- 5. Plotting the Signals ---
plotshape(
finalEntrySignal ? low : na,
style=shape.labelup,
location=location.belowbar,
text="دخول", // 'Entry'
// ... color and size settings
)
plotshape(
finalExitSignal ? high : na,
style=shape.labeldown,
location=location.abovebar,
text="خروج", // 'Exit'
// ... color and size settings
)
```
### 🧠 Logic Behind the Entry Signal ("دخول" - Buy)
A **"Entry" (Buy)** signal is generated when **ALL THREE** of the following bullish conditions are met on the same candlestick:
| Indicator | Bullish Condition (The Logic) | Why this ensures strong momentum? |
| :--- | :--- | :--- |
| **Relative Strength Index (RSI)** | **Positive AND Increasing:** (`rsiValue > 50`) AND (`rsiValue > rsiValue `) | The asset is not only gaining strength (above the 50 centerline) but its strength is actively **accelerating** (current value is higher than the previous one). |
| **Moving Average Convergence Divergence (MACD)** | **Bullish Crossover:** `macdLine > signalLine` | This indicates that the shorter-term momentum (MACD Line) has crossed above the longer-term momentum average (Signal Line), confirming a potential shift to bullish momentum. |
| **Stochastic Oscillator** | **Positive:** `stochK > 50` | The closing price is in the upper half of the recent price range, suggesting that buying pressure is dominating the current trend cycle. |
**The `finalEntrySignal` is triggered only when `RSI_Bullish AND MACD_Bullish AND Stochastic_Bullish` are true.**
-----
### 📉 Logic Behind the Exit Signal ("خروج" - Sell/Short)
A **"Exit" (Sell/Short)** signal is generated when **ALL THREE** of the following bearish conditions are met on the same candlestick:
| Indicator | Bearish Condition (The Logic) | Why this ensures strong momentum loss? |
| :--- | :--- | :--- |
| **Relative Strength Index (RSI)** | **Negative AND Decreasing:** (`rsiValue < 50`) AND (`rsiValue < rsiValue `) | The asset is losing strength (below the 50 centerline) and its weakness is actively **accelerating** (current value is lower than the previous one). |
| **Moving Average Convergence Divergence (MACD)** | **Bearish Crossover:** `macdLine < signalLine` | The shorter-term momentum has crossed below the Signal Line, confirming a potential shift to bearish momentum. |
| **Stochastic Oscillator** | **Negative:** `stochK < 50` | The closing price is in the lower half of the recent price range, suggesting that selling pressure is dominating the current trend cycle. |
**The `finalExitSignal` is triggered only when `RSI_Bearish AND MACD_Bearish AND Stochastic_Bearish` are true.**
### 💡 Visual Output
* **Entry Signal:** Plotted as a green label with the text "دخول" (**Entry**) **below the bar** (`location.belowbar`).
* **Exit Signal:** Plotted as a red label with the text "خروج" (**Exit**) **above the bar** (`location.abovebar`).
This strategy aims to filter out weak signals by requiring a high level of consensus across multiple technical dimensions.

Abyss Protocol OneAbyss Protocol One — Momentum Exhaustion Trading System
Overview
Abyss Protocol One is a momentum exhaustion indicator designed to identify high-probability reversal points by detecting when price momentum has reached extreme levels. It combines Chande Momentum Oscillator (CMO) threshold signals with dynamic volatility-adjusted bands and multiple protective filters to generate buy and sell signals.
Core Concept
The indicator operates on the principle that extreme momentum readings (CMO reaching ±80) often precede mean reversion. Rather than chasing trends, Abyss Protocol waits for momentum exhaustion before signaling entries and exits.
Key Components
1. Dynamic Bands (Money Line ± ATR)
Center line uses linear regression (Money Line) for smooth trend representation
Bands expand and contract based on Bollinger Band Width Percentile (BBWP)
Low volatility (BBWP < 30): Tighter bands using lower multiplier
High volatility (BBWP > 70): Wider bands using higher multiplier
Bands visually adapt to current market conditions
2. CMO Exhaustion Signals
BUY Signal: CMO drops below -80 (oversold/momentum exhaustion to downside)
SELL Signal: CMO rises above +80 (overbought/momentum exhaustion to upside)
Thresholds are configurable for different assets and timeframes
3. ADX Filter
Signals only fire when ADX exceeds minimum threshold (default: 22)
Ensures there's enough directional movement to trade
Prevents signals during choppy, directionless markets
4. Band Contraction Filter
Calculates band width percentile rank over configurable lookback
When bands are contracted (below 18th percentile), ALL signals are blocked
Prevents trading during low-volatility squeeze periods where breakout direction is uncertain
5. Consecutive Buy Limit
Maximum of 3 consecutive buys allowed before a sell is required
Prevents overexposure during extended downtrends
Counter resets when a sell signal fires
6. Underwater Protection
Tracks rolling average of recent entry prices (last 10 entries within 7 days)
Blocks sell signals if current price is below average entry price
Prevents locking in losses during drawdowns
7. Signal Cooldown
Minimum 5-bar cooldown between signals
Prevents rapid-fire signals during volatile swings
8. Extreme Move Detection
Detects when price penetrates beyond bands by more than 0.6 × ATR
Extreme signals can bypass normal cooldown period
Fire intra-bar for faster response to capitulation/blow-off moves
Still respects max consecutive buys and underwater protection
Visual Features
Trend State Detection
The indicator classifies market conditions into six states based on EMA stack, price position, and directional indicators:
STRONG UP: Full bullish alignment (EMA stack + price above trend + bullish DI + ADX > threshold)
UP: Moderate bullish conditions
NEUTRAL: No clear directional bias
DOWN: Moderate bearish conditions
STRONG DOWN: Full bearish alignment
CONTRACTED: Bands squeezed, volatility low
ADX Trend Bar
Colored dots at chart bottom provide instant trend state visibility:
Lime = Strong Uptrend
Blue = Uptrend
Orange = Neutral
Red = Downtrend
Maroon = Strong Downtrend
White = Contracted
Volume Spike Highlighting
Purple background highlights candles where volume exceeds 2x the 20-bar average, helping identify institutional activity or significant market events.
Signal Labels
Buy labels show consecutive buy count (e.g., "BUY 2/3"), price, and CMO value
Sell labels show consecutive sell count, price, and CMO value
Extreme signals display in distinct colors (cyan for buys, fuchsia for sells)
Signal candles turn bright blue for easy identification
Info Panel
Real-time dashboard displaying:
Current trend state
CMO value with threshold status
CMO thresholds (buy/sell levels)
ADX with directional indicator (▲/▼) and signal eligibility
BBWP percentage
Buy/Sell counters
Average entry price (with underwater shield indicator 🛡 when protected)
Price position relative to Money Line
Band width percentile rank
Extreme move status
Signals status (OPEN/BLOCKED)
Recommended Use
Timeframe: 5-15 minute charts (parameters tuned for this range)
Best suited for: Assets with regular oscillations between overbought/oversold extremes
Trading style: Mean reversion, momentum exhaustion, scaled entries
Parameters Summary
Money Line Length: 12 — Smoothing for center line
ATR Length: 10 — Volatility measurement
Band Multiplier (Low/High Vol): 1.5 / 2.5 — Dynamic band width
CMO Length: 9 — Momentum calculation period
CMO Buy/Sell Threshold: -80 / +80 — Signal trigger levels
ADX Min for Signals: 22 — Minimum trend strength
Signal Cooldown: 5 bars — Minimum bars between signals
Max Consecutive Buys: 3 — Position scaling limit
Band Contraction Threshold: 18th %ile — Low volatility filter
Band Contraction Lookback: 188 bars — Percentile calculation period
Extreme Penetration: 0.6 × ATR — Threshold for extreme signals

AJ Super Blast SignalsPrice action trading script suited for all TF, it will work on all instruments NIFTY/ BANK NIFTY/COMMODITY/SENSEX/ MIDCAP NIIFTY AND CRYPTOCURRENCY....IT HELPS TO AVOID SIDEWAYS MARKET SIGNALS WHICH PREVIOUS SCRIPTS DOESNT DO

Estrategia_XAU_1m_NYEstrategia para el par XAU/USD temporalidad 1 minuto, de 9:30 a 10:00 am New York. Solo media hora al dia.
Strategy for the XAU/USD pair, 1-minute timeframe, from 9:30 to 10:00 am New York. Only half an hour per day.

Smart Money Liquidity Structure AlgoSmart Money Liquidity Structure Algo is a rule-based trading strategy designed to analyze market structure, liquidity zones, and volatility conditions.
The script combines structure breakout logic, volatility filtering, order-block style price gaps, and Supertrend direction to generate systematic long and short signals.
This strategy is intended for educational and research purposes, helping traders study how liquidity, structure, and trend alignment can be combined into a single framework.
All signals are generated objectively using predefined conditions without repainting after bar close.
The strategy includes built-in risk management logic using ATR-based stop-loss and trailing exit mechanisms.
⚙️ Core Logic Overview
Market structure based on pivot-derived support and resistance
Volatility normalization filter to avoid low-activity periods
Price gap detection inspired by order-block concepts
Supertrend-based directional confirmation
Time-based holding logic before exits are allowed
✨ Features
Rule-based long and short entries
Liquidity & structure breakout detection
Volatility-filtered signal generation
Optional Supertrend trend filter
ATR-based stop-loss and trailing exits
Non-repainting logic after candle close
🧪 How to Use
Apply on liquid markets such as crypto, indices, or forex
Works best on intraday to higher timeframes
Adjust volatility filter and ATR multiplier based on the instrument
Always forward-test and paper-trade before live use
⚠️ Disclaimer
This script is not financial advice.
Trading involves risk, and past performance does not guarantee future results.
Use this strategy for analysis, testing, and educational purposes only.

Fibonacci Fibonacci automatic drawing - Last 144 barFibonacci automatic drawing:
It automatically plots Fibonacci based on the last 144 bars.
According to the drawing rules, it calculates itself from bottom to top and from top to bottom.
This will answer the most challenging questions about drawing the right thing.
If 144 bar is not reached, it draws using manual input.
This will be a useful and practical perspective.
This is for those who want to see the most valuable Fibonacci values on a chart.

O.R.B. New York (Opening Range)- Creates open range at New York Open (9:30am - 9:45am)
- Only shows most recent opening range for New York session (prevents clutter)
- Asset Classes: Micro Gold, Micro Silver, Micro ES, Micro NQ.
