Alligator + MA Trend Catcher [TradeDots]The "Alligator + MA Trend Catcher" is a trading strategy that integrates the William Alligator indicator with a Moving Average (MA) to establish robust entry and exit conditions, optimized for capturing trends.
HOW IT WORKS
This strategy combines the traditional William Alligator set up with an additional Moving Average indicator for enhanced trend confirmation, creating a user-friendly backtesting tool for traders who prefer the Alligator method.
The original Alligator strategy can frequently present fluctuations, even in well-established trends, leading to potentially premature exits. To mitigate this, we incorporate a Moving Average as a secondary confirmation measure to ensure the market trend has indeed shifted.
Here’s the operational flow for long orders:
Entry Signal: When the price rises above the Moving Average, it confirms a bullish market state. Enter if Alligator spread in an upward direction. The trade remains active even if the Alligator indicator suggests a trend reversal.
Exit Signal: The position is closed when the price falls below the Moving Average, and the Alligator spreads in the downward direction. This setup helps traders to maintain positions through the entirety of the trend for maximum gain.
APPLICATION
This strategy is tailored for assets with significant, well-defined trends, such as Bitcoin and Ethereum, which are known for their high volatility and substantial price movements.
This strategy offers a low win-rate but high reward configuration, making asset selection critical for long-term profitability. If you choose assets that lack strong price momentum, there's a high chance that this strategy may not be effective.
For traders seeking to maximize gains from large trends without exiting prematurely, this strategy provides an aggressive yet controlled approach to riding out substantial market waves.
DEFAULT SETUP
Commission: 0.01%
Initial Capital: $10,000
Equity per Trade: 80%
RISK DISCLAIMER
Trading entails substantial risk, and most day traders incur losses. All content, tools, scripts, articles, and education provided by TradeDots serve purely informational and educational purposes. Past performances are not definitive predictors of future results.
Bill Williams Indicators

Trend Catcher Strategywhat is Trend Catcher Strategy?
it is a strategy that opens long or short positions in the direction of the trend.
what it does?
TCS detects trend formations using its own unique method. Then, it opens a position in the direction of the trend and closes a part of the opened transaction (half according to default values) when the price reaches a certain level, and moves the remaining position to the point where it thinks the trend is over. You can easily understand how it works by looking at the images:
how it does it?
It obtains a value called a "limit" by dividing the difference between the highest value and the lowest value in a certain range (that is, the vector sum) to the sum of the lengths of the candles in a certain range (the total distance traveled). then multiplies this by 100 to get a percentage value. The closer this value is to 100, the stronger the trend.

Williams %R Cross Strategy with 200 MA Filter
1. The script is a trading strategy based on the Williams %R indicator and a 200-period moving average (MA) filter.
2. The user can input the length of the Williams %R indicator (`wrLength`), the threshold for %R crossing (`crossPips`), the take profit level in pips (`takeProfitPips`), and the stop loss level in pips (`stopLossPips`).
3. The script calculates the Williams %R using the `ta.highest` and `ta.lowest` functions to find the highest high and lowest low over the specified length (`wrLength`).
4. It also calculates a 200-period simple moving average (`ma200`) using the `ta.sma` function.
5. The entry conditions are defined as follows:
- For a long entry, it checks if the Williams %R crosses above the -50 line by a threshold of `crossPips` and if the close price is above the 200-period MA.
- For a short entry, it checks if the Williams %R crosses below the -50 line by a threshold of `crossPips` and if the close price is below the 200-period MA.
6. The exit conditions are defined as follows:
- For a long position, it checks if the close price reaches the take profit level (defined as the average entry price plus `takeProfitPips` in pips) or the stop loss level (defined as the average entry price minus `stopLossPips` in pips).
- For a short position, it checks if the close price reaches the take profit level (defined as the average entry price minus `takeProfitPips` in pips) or the stop loss level (defined as the average entry price plus `stopLossPips` in pips).
7. The script uses the `strategy.entry` function to place long and short orders when the respective entry conditions are met.
8. It uses the `strategy.close` function to close the long and short positions when the respective exit conditions are met.
The script allows you to customize the parameters such as the length of Williams %R, the crossing threshold, take profit and stop loss levels, and the moving average period to suit your trading preferences.

CM_SlingShotSystem+_CassicEMA+Willams21EMA13 htc1977 editionThis strategy is a combination of 2 indicators based on EMA(actually x3 EMAs and Williams ind.
We usin this to see where EMA fast is above EMA slow(for long), entry position when price hit fast EMA and exit if trend changes or price overbought, or by stoploss 1%.
The opposite for a short position.
For better result You can change every EMA's, stoploss, Willam's ind and other visualisation in settings.
If You find good combination - please, let me know(if You want).
I will check it with ML, and attach it here.
Original indicators will write in comments

EMA 5,15,35,89,200 BY NUTPlots exponential moving average on four timeframes at once for rapid indication of momentum shift as well as slower-moving confirmations.
Displays EMA 5, 15, 35, 89 and 200... default colors are hotter for faster timeframes, cooler for slower ones
ขอบคุณครับ

scalping with market facilitationThis strategy is for scalping low timeframes for 10 pips. I have yet to see a strategy with this unique combo of indicators.
First we have volume indicator market facilitation, where we are looking for volume and mfi to be up, then we want the adx 5 to be above level 30 and above its ema period 3, then if these conditions are good we take shorts when ema 8 is below ema 100 and longs when ema8 is above ema 100 with parabolic sar in its propet place, also to verify trend we have obv over or under its ema of 55 and macd line over its signal line.
I have heikenashi bars on with the regular priceline showing so j see actual price levels, when i get a buy signal i set a buystop above the high of that bar and have a stoploss of 7.5 pips and a take profit of 10 pips, reverse for sells, i have to use metatrader to trade so i use this as my signals to trade.
Note this is not advice trade at your own risk no guarantees in anything in life, but i wanted to share this for it is helping me with my trades to be more strict and semi mechanical. I use it for forex time frames 1 3 5 15 mjn

Chande Kroll Stop今天和大家分享Chande Kroll Stop 回测, 信号采用了上限线和下限线共通反向趋势而决定买卖信号,如果有新的构思能提高买卖信号欢迎在留言区发表你的建议,祝你交易开心!

Combo 2/20 EMA & Bill Williams Averages. 3Lines This is combo strategies for get a cumulative signal.
First strategy
This indicator plots 2/20 exponential moving average. For the Mov
Avg X 2/20 Indicator, the EMA bar will be painted when the Alert criteria is met.
Second strategy
This indicator calculates 3 Moving Averages for default values of
13, 8 and 5 days, with displacement 8, 5 and 3 days: Median Price (High+Low/2).
The most popular method of interpreting a moving average is to compare
the relationship between a moving average of the security's price with
the security's price itself (or between several moving averages).
WARNING:
- For purpose educate only
- This script to change bars colors.

Up & Down Trend following trading strategy for BTC/USDT 3hThis strategy is based on multi time frame technical indicators such as;
1. RSI (10,50,100)
2. MFI (10,50,100)
3. RVI (10,50,100)
4. BOP (10,50,100)
5. Super Trend
6. SAR indicator
7. Higher highs and lower lows
8. SMA (9,500)
9. EMA (9,200)
After evaluating different parameters provided by those indicators, script is in a possition to determine optimul positions to enter in to market as well as exit from the market. In some cases stratergy will exit fully or partially depends on the situation. Other than that, this strategy is in a possition to calculate and specify the quantity you need to buy or sell depending on market situation. You can specify amount available for investment and how many times you are going to average (if downtrend). Parameters are optimised to BTC/USDT, 3h standerd candlestic chart.
goodluck

5min Williams Fractals scalping (3commas)Another strategy I'm learning Pine Script on. It is inspired by a MoneyZG youtube strategy called "Easy 5 Minute Scalping Strategy (Simple to Follow Scalping Trading Strategy)".
Again this is a one order per trade strategy compatible with the 3commas bot (works also with the free 3commas subscription). This strategy is based on the signals from Williams Fractals, taking the signals in reverse - red triangle indicates a bottom and hence we go long. The green triangle indicates a top so we go short. By default these signals are only accepted if they occur between the two Emas. However, you can also turn this off and when a WF signal comes in, only the current price has to be between the Emas. Stop loss is set to the current Ema slow and the take profit is a multiple of the distance to the slow ema.
Like previously I have added different filters as well as the ability to view essential things like the WF signal and Emas. I hope the script will help you to be more successful and if so it would be great if you could share here your setups, or tips on what would be good to refine to make it an even a more profitable strategy. Kind of a community approach so that we help each other out :).
Instructions for the 3commas connector:
1. First, you need to prepare 3commas Long/Short bots that will only listen to custom TV signals.
2. Inputs for the 3commas bot can be found at the end of the user inputs.
3. Once you have entered the required details into the inputs, turn on 3commas comments. They should appear on the chart (looks messy).
4. Now you can add the alert where you should paste the 3commas Webhook URL: 3commas.io
5. For the alert message text insert the placeholder {{strategy.order.comment}} and delete the rest.
6. Once the alert is saved, you can turn off those 3commas comments to have a clearer chart.
7. With a new alert, the bot and trade should launch.
In the near future I would like to publish more scripts that will carry similar elements as the first two, incl. compatibility with 3commas (I don't have access to another bot system). I will choose some strategies myself, but I will also be glad for some tips on what strategy would be good to do and is still missing here on Tradingview (short youtube videos or brief strategy manuals would be great).
Thanks and keep it up
PS: My screen values starting at Long Target Profit and ending at Pullback NOT greater than: 1.5; 1.5; 0; ON; 1; 2; OFF; 17; 36; ON; 0.05; ON; Chart; 14; 46; 50; 48.5; 51; OFF; 1; ON; 4; 2.

Fractal Breakout Strategy [KL]Fractal Breakout Strategy
This strategy will enter into a Long position when (a) bullish fractal is formed, combined with (b) ATR is relatively low. Trailing stop loss is set based on ATR.
Bullish fractal pattern :
A bullish fractal pattern looks like this:
It is formed when lower-low has reached a local minimum followed by higher-lows.
By default, this script plots the pivot point (the local minimum) using green crosses. This line will extend to the right until the next bullish fractal is formed. The local minimum pivot point is considered as key level of support. For long position entry, entry price must be higher or equal to it.
On the other hand, a bearish fractal pattern looks like the exact opposite. Reversing the logic, it is a local maximum indicated by higher-highs followed by lower-highs. This is shown by red crosses.
Why use ATR to confirm entry :
Two reasons to enter when ATR is low:
1) Since trailing stop loss is based on ATR, entering the market when ATR is low means risking less for potentially high reward.
2) Low ATR often signals price consolidation. There are two favorable scenarios, either: (i) period of accumulation, or (ii) bull flag, ideally followed by breakout.
Determining whether ATR is low :
Relative lows are quantified out by using the method in my other script: Modified ATR Indicator
The method involves applying two-tailed hypothesis testing to assess whether ATR (ie. by default lookback period of 5) has greatly deviated from a larger sample size (ie. lookback period of 50). Assuming ATR is normally distributed and variance is known, then test statistic (z) can be used to determine whether ATR5 is within the critical area under Null Hypothesis: ATR5 == ATR50. If z falls below/above the left/right critical values (ie. 1.645 for a 90% confidence interval), then ATR is determined to the relatively low/high respectively. For the purpose of assessing whether ATR is low, the left-tail is the main focus.
Profit taking :
Profits by default are taken over 3 levels based on risk to reward ratio (ie. 1R, 2R, 3R). When a target is met at each level, strategy will close out one third of current position size. Remainders (ie. already taken once at 1R, but not yet reaching 2R or 3R) will eventually be closed at the trailing stop loss price.

Forex Fractal EMA ScalperThis is a forex scalper designed for very short timeframes 1-5 min max.
At the same time due to the short timeframe, is recommend to re optimize it weekly .
Its components are
Fractals
Triple EMA with different lengths
Rules for entry:
For long : we have an up fractal and all 3 ema are in ascending order
For short: we have a down fractal and all 3 ema are in descending order.
Rules for exit
We exit when we either get a reverse order or when we hit the take profit or stop loss calculated in fixed pips.

Williams Fractals StrategyThis indicator made with using Williams Fractals, 20 50 100 Moving Averages and Relative Strength Index. You can easily find entry points by using Long (L), Short (S) signals.
Note : Settings are optimized for BTC:USDT Perpetual 15min TF. For use different pairs or TFs you may need to change settings.

RSI Centered PivotsJust a simple RSI central pivot strategy I made for a friend.
Backtested on BYBIT:BTCUSD, 155m.
DISCLAIMER : Please do your own research into anything you use before using it to trade.

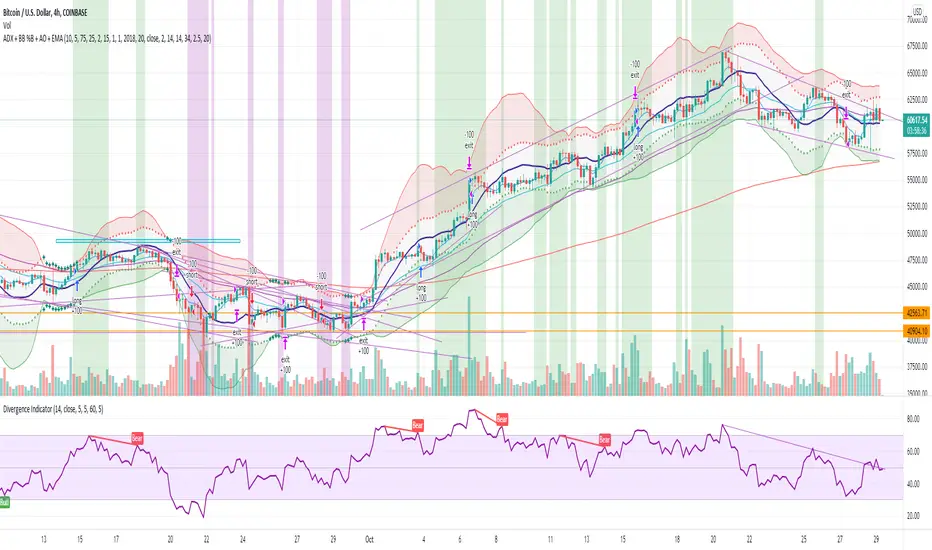
ADX + BB %B + AO + EMA [Luca Massuda]This trading strategy combines different indicators:
1) ADX, Average Directional Movement: to spot the trend
2) BB %B Bollinger Band %B: to spost relative price position to Bollinger Bands
3) AO Awesome Oscillator: to spot momentum
4) ema 5,ema21, ema50, ema200: to decide long or short position
You can configure:
Take profit % : at which % gains to take profit from the entry price
Stop loss % : at which % stop loss from the entry price
BB %B Overbought: At which level you consider Overbought respect to Bollinger Bands (values 0 to 100)
BB %B Oversold: At which level you consider Oversold respect to Bollinger Bands (values 0 to 100)
Awesome Oscillator: AO level to consider a long or short position +/- 2
ADX: ADX value to consider a long or short position
Start Date, Month, Year: Starting point for a backtesting strategy
Lenght , Source , Standard Deviation: Bollinger Bands values
ADX smoothing, DI Lenght: ADX values
Green and purple zones indicate when the strategy can go long or short.
Default Long conditions:
ema5>ema21 and ema50>ema200 and bb>75% and ao>2 and adx>15
Default Short conditions:
ema515
GBP/JPY Daily time FX Strategy ATR W% BaselineThis is a preety good strategy suited for long term trading.
It has been adapted and optimized in this case for GBP/JPY 1D time frame.
Its made of Kiojun baseline, together with ATR for stop loss and size calculation and Williams % R
For the purpose of this example we simulate that we have a leverage of 100x in order to be able to buy the ammount of lots required for our stop loss to be in same page with the risk % of our capital.
For entry we have for long, ascending R in the last 2 candles and crossover of close with KIOJUN baseline. For short the same but in reverse.
We exit if we reach the TP -100 points in this example, or SL , which is based on ATR of the last x days.
If you have any questions feel free to write me in private !

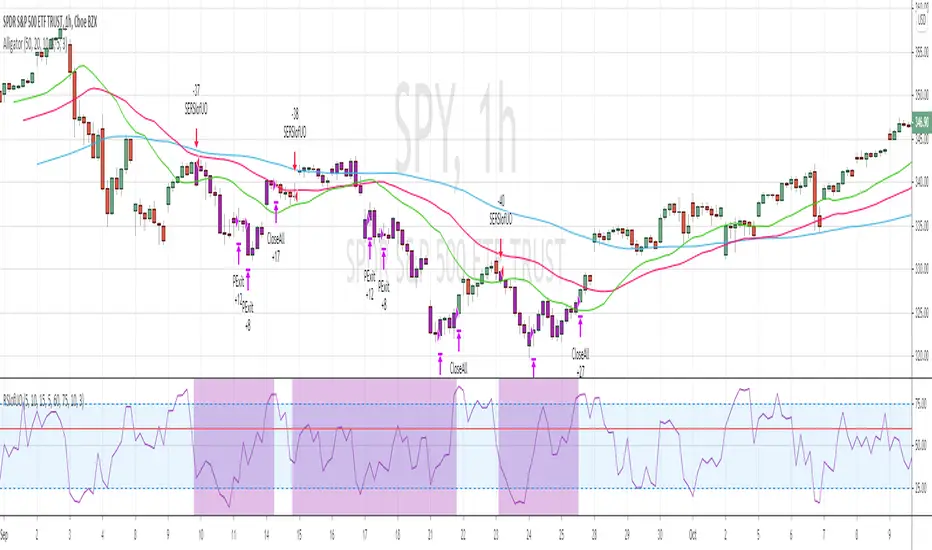
RSI of Ultimate Oscillator [SHORT Selling] StrategyThis is SHORT selling strategy with Ultimate Oscillator. Instead of drectly using the UO oscillator , I have used RSI on UO (as I did in my previous strategies )
Ultimator Oscillator settings are 5, 10 and 15
RSI of UO setting is 5
Short Sell
==========
I have used moving averages from WilliamAlligator indicator --- settings are 10(Lips), 20(teeth) and 50 (Jaw)
when Lips , Teeth and Jaw are aligned to downtrend (that means Lips < Teeth < Jaw )
Look for RSIofUO dropping below 60 ( setting parameter is Sell Line )
Partial Exit
==========
When RSIofUO crossing up Oversold line i.e 30
Cover Short / Exit
=================
When RSIofUO crosisng above overbought line i.e 70
StopLoss
========
StopLoss defaulted to 3 % , Though it is mentioned in settings , it has not been not used to calcuate and StopLoss Exit... Reason is, when RSIofUO already crossed 60 line (for SHORTING) , then it would take more efforts go up beynd 60. There is saying price takes stairs to climb up but it takes elevator to go down. I have not purely depend on this to exit stop loss, however noticed the trades in this stratgey did not get out with loss higher than when RSIofUO reaching 70 level.
Note
======
Williams Alligator is not drawn from the script. It is manually added to chart for illustration purpose. Please add it when you are using this strategy , whch woould give an idea how the strategy is taking Short Trades.
This is tested on Hourly chart for SPY
Bar color changes to purple when the strategy is in SHORT trade
Warning
========
For the eductional purposes only
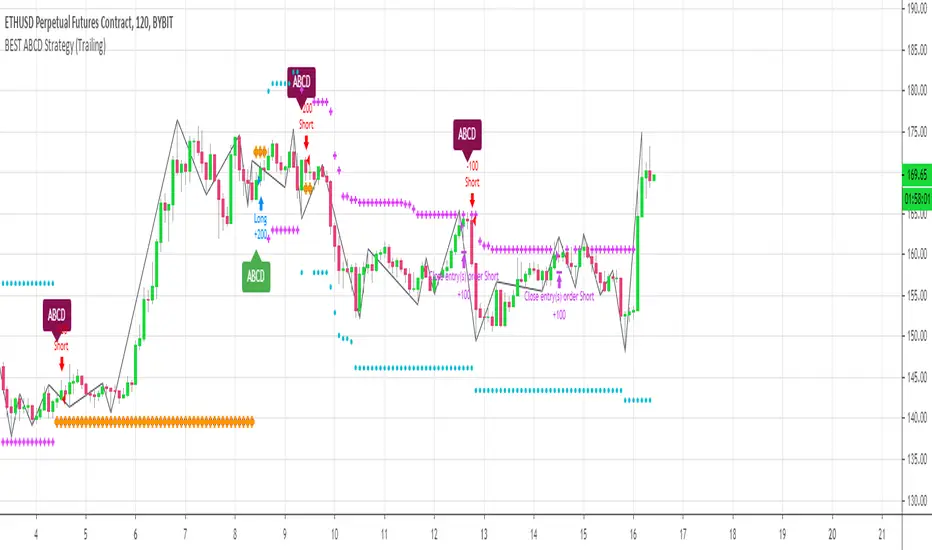
[Daveatt] BEST ABCD Pattern Strategy (Trailing SL + TP)Hello traders
This is the strategy version of my ABCD pattern. I added the Trailing Stop and Trailing Profit upon a follower request
I - Concept
I present to you, ladies and gentlemen, the first screener for harmonic patterns .
Starting with an ACBD pattern screener this time!!
I used the calculations from Ricardo Santo's script
In short, he's using fractals (regular or Bill Williams ) for the pattern calculations. A masterpiece !!!
II - Definitions
The ABCD pattern ( AB=CD ) is one of the classic chart patterns which is repeated over and over again.
The ABCD pattern shows perfect harmony between price and time.
The Williams Fractal is an indicator, developed by Bill Williams , that aims to detect reversal points (highs and lows) and marks them with arrows.
Up fractals and down fractals have specific shapes. The Williams Fractal indicator helps users determine in which direction price will develop
💎Strategy filters💎
I included some cool backtest filters:
- Trailing stop with trigger concept coming from this Trailing Stop Strategy
- Trailing profit with trigger coming from this Trailing Profit Strategy
Last words
It works for all asset classes (Forex, crypto, indices, etc...) and does not repaint
All the BEST
Dave
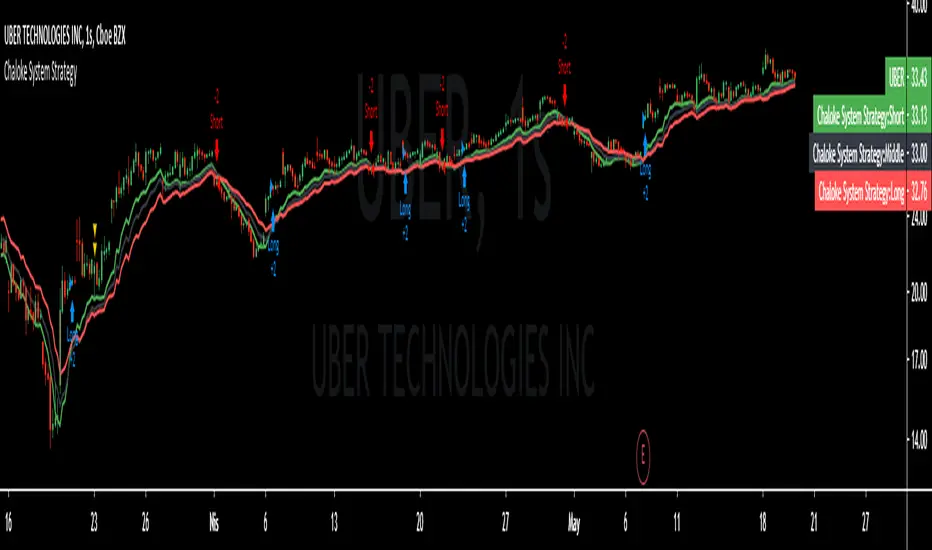
Chaloke System StrategyChaloke System Strategy
This is a trend indicator
Atr and 3 moving averages are used
Short 9-day moving average,Medium 15-day moving average,Calculated with a long 24-day moving average.
Atr period : 5
Sht,Mid,Lng calculation method is different
Buying Strategy
long = crossover(Sht,Mid) and close > Sht
Selling Strategy
short = crossunder(Sht, Lng ) or close < Lng
Buy should be done when the barcolor turns green
Sell should be done when barcolor is red
When the barcolor is black, there may be change.
Fractal Breakout StrategyFractal
A type of pattern used in technical analysis to predict a reversal in the current trend. A fractal pattern consists of five bars and is identified when the price meets the following characteristics:
1. A shift from a downtrend to an uptrend occurs when the lowest bar is located in the middle of the pattern and two bars with successively higher lows are positioned around it.
2. A shift from an uptrend to a downtrend occurs when the highest bar is located in the middle of the pattern and two bars with successively lower highs are positioned around it.

BEST ABCD Pattern StrategyHello traders
This is the strategy version of this script
I - Concept
I present to you, ladies and gentlemen, the first screener for harmonic patterns.
Starting with an ACBD pattern screener this time!!
I used the calculations from Ricardo Santo's script
In short, he's using fractals (regular or Bill Williams ) for the pattern calculations. A masterpiece !!!
II - Definitions
The ABCD pattern ( AB=CD ) is one of the classic chart patterns which is repeated over and over again.
The ABCD pattern shows perfect harmony between price and time.
The Williams Fractal is an indicator, developed by Bill Williams, that aims to detect reversal points (highs and lows) and marks them with arrows.
Up fractals and down fractals have specific shapes. The Williams Fractal indicator helps users determine in which direction price will develop
💎Strategy filters💎
I included some cool backtest filters:
- flexible take profit in USD value (plotted in blue)
- flexible stop loss in USD value (plotted in red)
The take profit and stop loss should work with Forex/FX pairs as well
All the BEST
Dave

WMX Williams Fractals strategy V4There are some magic numbers out there! Guys, Check this out!
if you like it please support me with a like or leave your comments below

Scalping with Bill Williams AlligatorScalping strategy based on Bill Williams Alligator technique but calculated with heikin ashi candles.
This strategy has to be applied to standard candles and low time frames (1min to 5min)
Thanks to all pinescripters mentined in the code for their snippets.
It could be improved with stop loss based on ATR etc.
I have also a study with alerts.
Please use comment section for any feedback or contact me if you need support.
