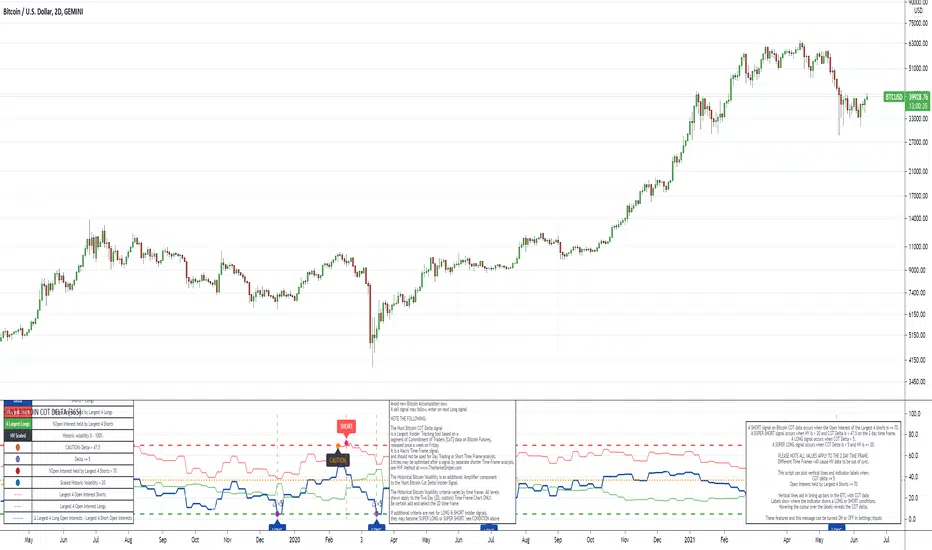
Hunt Bitcoin CoT Open Interest DeltaWhy Bother another CoT signal?
Its different & focused on the Insider's.
Performance -
This Indicator provided a
1. Signal 1 = 26th March 2019 = SUPER LONG at $4,500 that saw a near $14,000 run up
2. Signal 2 = 18th & 24th June 2019 = SHORT at the second & final level $11,700 after repeated attempts & failure in the $13K range, the mini Echo Bitcoin Bull of 2019
3. Signal 3 = 17th December 2019 = LONG $6,900, Bitcoin rallied to Mid $10,500's
4. Signal 4 = 18th Feb 2020 = SUPER SHORT from $9,700's to a final extreme Low of $3,000, calling the CV-19 collapse
5. Signal 5 = 17th March 2020 = LONG from $5,400 no closure point yet
6. Signal 6 = 29th June 2020 = SUPER LONG reiterate from $10,700 no closure sell signal yet
7. Signal 7 = 17th May 2020 = LONG another accumulate LONG with no sell signal yet generated at Post H&S's low of $33,000
Note - This indicator only commences March 2019, as Bitcoin futures were a recent introduction and needed to settle for 6 months in both use and data, no signals were meaningful prior & data was light.
What is Provided. - Please note the need to also add the Hunt Bitcoin Historical Volatility Indicator for full understanding.
We provide 3 things with the 3 indicators.
'Insider' indications from Largest players in the futures market.
1. Bitcoin Macro Buy Signals.
a) The Bitcoin Commitment of Traders results see us focus solely on Largest 4 Short Open Interest & Largest 4 Long Open Interest aspects of the CoT Release data.
When the difference - is tight, a kind of pinch, these have been great Buy signals in Bitcoin.
We call this difference the Delta & When Delta is 5% or less Bitcoin is a Buy.
2. Bitcoin Macro Sells.
a) A sell signal is Triggered in Bitcoin at any point the Largest 4 short OI > or = to 70
3. AMPLIFIER Trade signals 'Super' Longs or Shorts -
Extreme low volatility events leads to highly impulsive & volatile subsequent moves, if either of 1 or 2 above occur, combined with extreme low volatility
a 'Super Long' or 'SUPER SELL' is generated. In the case of the short side, given Bitcoins general expansive and MACRO Bull trend since inception, we seek an additional component
that is an extreme differential/Delta reading between 4 biggest Longs & Shorts OI.
Namely CoT Delta also must be > 47.5%
We also have a Cautionary level, where it is not necessarily a good idea to accumulate Bitcon, as a better opportunity lower may avail itself, see conditions below.
So the required logic explicitly stated below for all Signals.
1. Long - Hunt Bitcoin CoT Delta < or = 5
2. SUPER Long - Hunt Bitcoin CoT Delta < or = 5; and 2 Day Historical Bitcoin Volatility = or < 20
3. Short - Largest 4 Sellers OI = or > 70
4. SUPER Short - Largest 4 Sellers OI = or > 70; AND..
Hunt Bitcoin CoT Delta = or > 47.5 AND 2 Day Historical BTC Volatility = or < 20
5. Caution - Largest 4 Sellers OI = or > 67.5 AND Hunt Bitcoin CoT Delta = or > 45
WARNING SEE Notes Below
Note 1 - = Largest 4 Open Interest Shorts
Note 2 - = Largest 4 Open Interest Longs
Note 3 - = Hunt Cot Delta = (Largest 4 sellers OI) -( Largest 4 Buyers OI)
Caution = Avoid new Bitcoin Accumulation Right Now, A sell signal might follow Enter on next Long
Note 4 - The Hunt Bitcoin COT Delta signal is a Largest 'Insider' Tracking tool based on a segment of Commitment of Traders data on Bitcoin Futures, released once a week on a Friday.
It is a Macro Timeframe signal , and should not be used for Day trading and Short Timeframe analysis , Entries may be optimised after a Hunt Bitcoin CoT Signal is generated by separate shorter Timeframe analysis.
Note 5 - The Historical Bitcoin Volatility is an additional 'Amplifier' component to the 'Hunt Bitcoin Cot Delta' Insider Signal
Note 6 - The Historical Bitcoin Volatility criteria varies by timeframe, the above levels are those applying on a Two Day TF Chart, select this custom timeframe in Trading View.
if additional criteria are met for LONG & SHORT insider signals, they may become 'Super Longs/Shorts', see conditions box above.
Bitcoin (Cryptocurrency)
[RickAtw] ZONE Trend 3█ OVERVIEW
This indicator tracks current trends. Trends are determined by the zones created for them, the brighter the zone, the higher the probability of a market reversal.
█ FEATURES
The indicator adapts to any market.
You can set your own values for your system
Any timeframe can be used
You can increase the number of zones
█ HOW TO USE
If the market starts to enter the red zone, open buy and hold until the second or third zone.
If the market moves towards the blue zone, we sells and hold until the next zone.
█ The author of the work
Rick Atwood
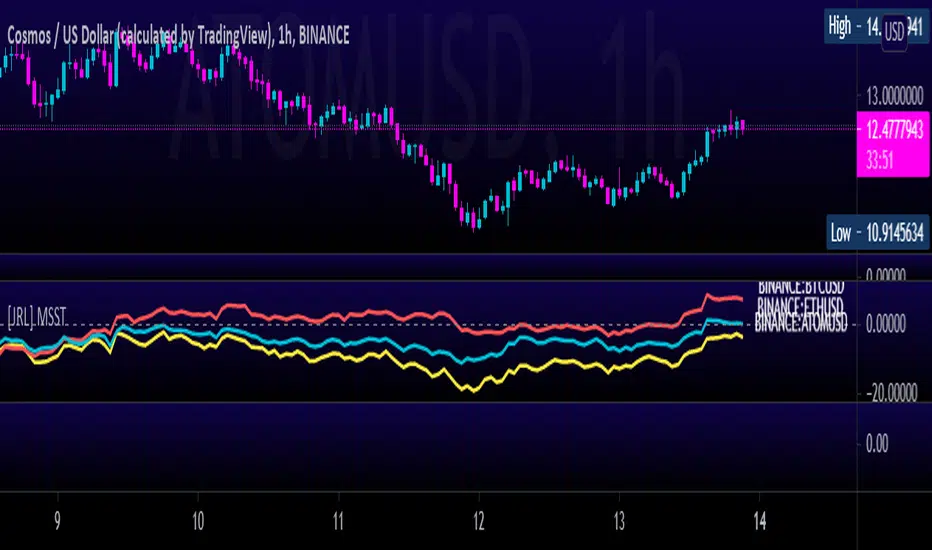
[JRL] Multi-Symbol Strength TrackerI created this script to compare cryptocurrencies that tend to be correlated, but it could also be used for forex or any other market. It is a fairly simple concept and compares price of each symbol to the specified period ema. This is helpful for tracking highly correlated symbols and visualizing moments when they are out of sync, perhaps signaling good times for buying or selling.
Mayer Multiple RainbowUses a more recent sampling (since 2013) to generated Mayer Multiple distribution.

Awesome Heikin Ashi [Morty]This indicator uses Heikin Ashi candles and two EMAs to help you follow the trend and enter the trade. Heikin Ashi candles help to smooth the price and EMAs are used to detect trend. The default parameter of EMA is EMA10 and EMA20. You can use it at any timeframe. You should always adjust the EMA length according to different timeframes.
Features:
- Highlight background based on two EMAs
- Adjustable EMA length
- Adjustable Label size
- Show entry and exit signal labels
- Show stoploss price
- You can choose Long only or Short only or both signals
- Alert functions for notification
NOTE: If you use this signal to enter a trade, make sure the candle is close and enter in the next candle.

B&S v3.2This strategy uses RMA, Moving Average used in RSI , to create the buy and sell signals. It is the exponentially weighted moving average with alpha = 1/length.
IT SHOWS ON THE GRAPH:
Buy: Long position.
Sell: Short position.
V ⇣: Institutional volume .
V ⇡: Institutional volume .
T ⇣: Downtrend.
T ⇡: Uptrend.
Volume (V ⇣/V ⇡) when Market Makers moving smart money.
When 200SMA is above 100SMA (T ⇡) 200SMA is below 100SMA (T ⇣)
HOW TO USE?
If you are trading any asset that is in an uptrend, avoid shorting until the sign (T ⇣) appears followed by the Institutional Volume signal (V ⇣) indicating reversion.
If you are trading any asset that is in a downtrend, avoid long positions until the signal (T ⇡) appears followed by the Institutional Volume signal (V ⇡) indicating reversal.
For long operations use "🕗 360" setting for Daily timeframe.
For Day Trade use "🕗 30" for 1 hour or 30 minutes timeframe.

BTC COT Delta BBitcoin CME COT Delta Strategy
---------------------------------------
Reading 4 largest long positions and 4 largest short positions, this script uses (shorts - longs) to produce a long/short signal.
• When delta <= buy threshold, a "long" signal will appear on the chart.
• When shorts >= sell threshold, a "short" signal will appear on the chart.
To see the indicator below, since it's not possible to mix the two, use this script:
** This is not a trading advice, it's for research purposes only. Do not trade based upon these signals.

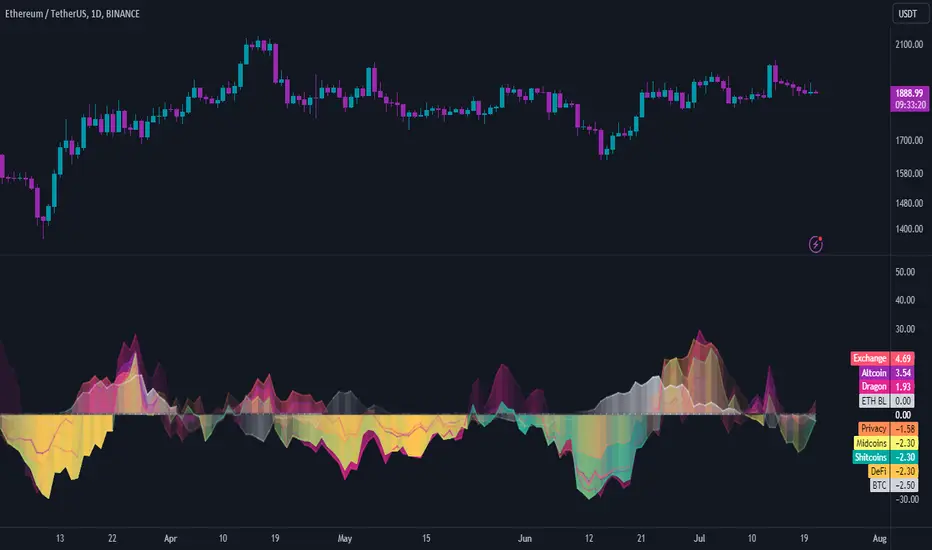
INDICES against BTC & ETHThe idea is the following; you can easily chart the FTX perp indices against (currently) two baselines, ETH & BTC.
I always choose ETH since it is way harder to outperform ETH at the moment. Doing this helps me see certain trends and/or fractal that might happen again in the future.
Since I already made D.A.M (Defi against Majors / Pricing Defi categories against BTC & ETH: ) I came across the idea of doing the same thing but with the perp indices that FTX offer. At first, I wanted to add this to D.A.M but it has no place in this indicator since this will not only look at Defi but the macro market as a whole.
The indicator currently only looks at the following indexes (weighting can be found here: https:// help. ftx. com/hc/en-us/articles/360027668812-Index-Calculation) :
DRGN: THE DRAGON INDEX
ARPA, BTM, IOST, NEO, NULS, ONT, QTUM, TRX, VET
ALT: ALTCOIN INDEX
BCH, BNB, EOS, ETH, LTC, XRP, TRX, DOT, LINK, ADA
MID: THE MID CAP INDEX
ALGO, ATOM, BAT, CRO, DASH, DCR, DOGE, HT, IOTA, LEO, NEO, OKB, ONT, QTUM, VET, XEM, XLM, XMR, XTZ, ZEC, ZRX, OMG, COMP, BSV, FTT, YFI, UNI, SNX, MKR, AAVE
SHIT: THE SHITCOIN INDEX
AE, AION, ARDR, ARPA, BCD, BEAM, BTG, BTM, BTS, BTT, CHZ, CKB, DGB, ELF, ENJ, GNT, GRIN, GT, HBAR, HC, ICX, IOST, KMD, KNC, LAMB, LRC, LSK, MANA, MATIC, MCO, NANO, NULS, OMG, POWR, PUNDIX, REN, REP, RVN, SC, SNT, STEEM, THETA, TOMO, VSYS, WAVES, XVG, XZC, ZEN, ZIL, ZRX
PRIV: THE PRIVACY INDEX
BEAM, DCR, GRIN, KMD, XMR, XVG, XZC, ZEC, ZEN
DEFI: THE DECENTRALIZED FINANCE INDEX
KNC, MKR, ZRX, REN, REP, SNX, COMP, TOMO, RUNE, CRV, DOT, LINK, MTA, SOL, CREAM, BAND, SRM, SUSHI, SWRV, AVAX, YFI, UNI, WNXM, AAVE, BAL
High Timeframe POCBecause the big Bitcoin crash I have been looking a lot at high timeframe metrics. I never spent much time learning POC so I decided to create a little script for determining these on higher timeframes.
Currently included: Monthly, 3 months and 6 months.
/* DEFINITION */
Point Of Control (= POC) is a price level at which the heaviest volumes were traded.
Value Area High/Low (=VAH/VAL) is a range of prices where the majority of trading volume took place. Naturally, Value Area High being the top price level and Value Area Low being the lowest. POC always is between the two.
/* HOW TO TRADE WITH THIS INDICATOR */
The basis for POC is determining bias on whichever timeframe you choose.
1. Identify a POC on the timeframe of your choosing.
/* If you choose a "low" timeframe (monthly here) then make sure to look at the higher timeframes to see how it is playing against a higher timeframe POC.
2. When the price is moving away from the POC (either to the upside or downside) this will confirm or invalidate the trade.
3. You can now enter the trade on bias or wait for a retest of the same POC.
/* EXAMPLE TRADES /*
Here is a screenshot of some of the trades that are possible solely using the POC and some common sense.
s3.tradingview.com

Crypto Strategy for Bearish Markets (Binance, FTX, Futures...)BINANCE:BTCUSDTPERP
Even in months like May '21 you can win by going long on Bitcoin. This strategy proves it and is not overwhelmed by Elon's ...
The backtest was carried out during the month of May of this year and, as you can see, all the long operations opened during the fall were successful.
So if we are going to continue to have a bear market for some time, why not take advantage of it while we remain bulls?
This strategy uses Dollar-Cost-Average (DCA) to average the entry price. Thanks to this, it is able to close profitable trades even in times of great volatility and bearish pressure.
It includes alerts that can be configured that will be sent every time the conditions to operate are met. These alerts can also be linked with 3commas for a fully automatic operation.
For Leverage Futures or Margin traders, all you have to do is divide the initial capital by the leverage used.
Enjoy!

TEMA Cross +HTF BacktestThis is a follow up to a previous script release called " TEMA Cross Backtest ".
This new strategy uses two TEMA crosses, one for trend direction, one for entry and exit. The entry and exit parameters are the same as the previous script. The trend direction is based on a user configurable higher timeframe TEMA cross which determines when to take longs or shorts. When the indicator is purple, it is looking for shorts, and when it is yellow, it is looking for longs. The background of the chart is colored accordingly to see the trend direction at a glance.
The default settings are the ones I have found produce the highest backtest results. The backtest is set by default to use a $500 account, and use $500 for every entry and exit, no matter the direction or overall profit/loss.
Parts of script borrowed from other public scripts.

Bitcoin Daily Support/ResistanceA new indicator for tradingview.
Indicator Overview
The 2-Year MA Multiplier is intended to be used as a long term investment tool.
It highlights periods where buying or selling Bitcoin during those times would have produced outsized returns.
To do this, it uses a moving average (MA) line, the 2yr MA, and also a multiplication of that moving average line, 2yr MA x5.
Note: the x5 multiplication is of the price values of the 2yr moving average, not of its time period.
Buying Bitcoin when price drops below the 2yr MA (green line) has historically generated outsized returns. Selling Bitcoin when price goes above the 2yr MA x 5 (red line) has been historically effective for taking profit.
Why This Happens
As Bitcoin is adopted, it moves through market cycles. These are created by periods where market participants are over-excited causing the price to over-extend, and periods where they are overly pessimistic where the price over-contracts. Identifying and understanding these periods can be beneficial to the long term investor.
This tool is a simple and effective way to highlight those periods
MA 50/100/150 was historically good support and resistance. When we cross them we have a new trend that is established.

EMA+RSI Pump & Drop Swing Sniper (SL+TP) - StrategyThis is the strategy version of the 'EMA-RSI-Pump-Drop-Swing-Sniper-With-Alerts':
Some additions with this strategy:
~Added Stop loss & Take profit control. In Settings > Inputs if the Stop Loss is at .051 that means it's 5.1% and the Take Profit at .096 is 9.6%. If you wish to remove the TP and SL just change the value to 1.00 and it would be the same as it being 100% TP and SL which is likely to never be hit.
~Added Backtesting by changing the month/date/year in Settings > Inputs
~Added a 2nd EMA line to assist with the long entry signals. I only use this for long entry & exits, though you could use the long exits as Short entries too. I just personally don't do short trading on Bitcoin.
This is using an EMA and RSI with slightly modified settings to give good entry and exit points while looking at Bitcoin. I use this on a 1-hour and 4-hour chart and with other indicators to find good positions to enter a trade or exit if things are turning red.
It's important to know this strategy was made as a request by another user that was using the indicator version. I don't use this as a trading strategy by itself, I use the visuals it gives as a confirmation with other indicators to find the best possible entry and exit positions.
If you click on the EMA line it will color the bars of the chart based on if they are above or below the EMA - This is just visually helpful for me to see the active trend.
Make sure you hover over or click on the EMA line to see the colors of the candles change - it's not visible by default or without doing this.

Godson BTFD ScriptHMA to find trends and signal Long or Short
DMI to ensure momentum is high enough
STDEV to find variance and signal the BTFD/STFR signals

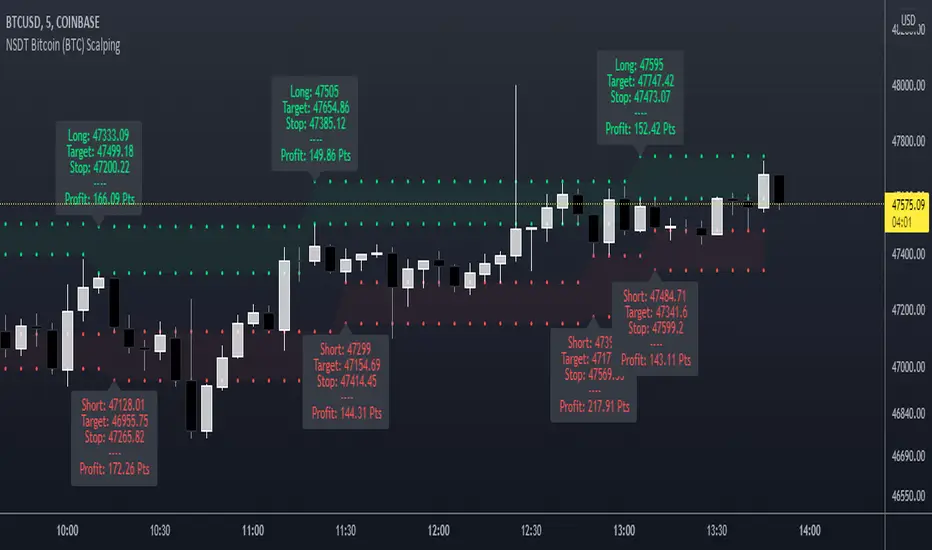
NSDT Bitcoin (BTC) ScalpingThis indicator is specifically designed for scalping Bitcoin (BTC). It looks for a particular price pattern/sequence and displays a label on the chart to show a potential entry, target, and stop based on that analysis. Basically enter long through the green zones and short through the red zones. These levels are not guaranteed to be hit. Trading is risking and you can lose money. Trade at your own discretion and risk. This indicator is only providing potential scalping zones based on recent price action.
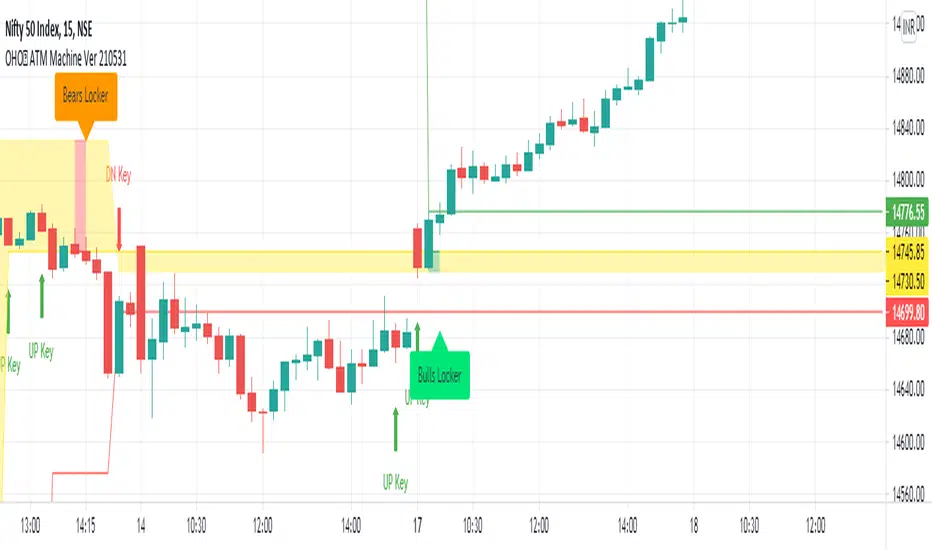
OHO ATM MachineStudies Used:
We have used different type of candle stick patterns, open, close, high, low, Moving Averages, volumes and Average True Ranges in creation of this indicator.
Usage:
It can be used for scalping and intra-day trading. It works best on Nifty 5 Minutes , 15 Minutes, 1 Hour, Daily, Weekly and Monthly Time Frames.
It provides easy to visualize multiple information:
1) It gives the correct Entry on Time. Yellow ATM Area, Means No Trade.
2) Fake Signals are shown when There is Sell Signal and Below is ATM Area.
3) Fake Signals are shown when There is Buy Signal and Above is ATM Area.
4) It gives proper Target at the time of Entry.
5) Stop Loss is Hit when The Candle Closes below ATM Area in Buying and vice versa.
6) No Trade is Recommended, when ATM Area is Yellow.
How to read OHO ATM Machine Indicator?
Buy - When ATM Area is Turned Green in Color First Time after Last Red.
Sell - When ATM Area is Turned Red in Color First Time after Last Green.
Stop Loss - When The Candle Closes below ATM Area in Buy Trade and When The Candle Closes above ATM Area in Sell Trade.
Target - Thin Green Line for Buy Trade and Thin Red for Sell Trade.
Trailing SL - We can Trail the Trade, till the Stop Loss is HIT.
Recommendations:
This can be used for Nifty, Bank Nifty, Stocks, Commodities, Bitcoin, Currency and any other tradable instrument.
What time frame should I use?
5 Minutes and 15 Minutes are best time-frames for Intra-day Trades.
15 Minutes and Hourly are best time-frames for Swing Trades.
Hourly and Daily are best time-frames for Short Term Trades.
But you can check different time-frames in Strategy Testing section or as per your requirements.
Disclaimer:
Past performance is not the guarantee of future performance.
For any type of queries kindly send us personal message.
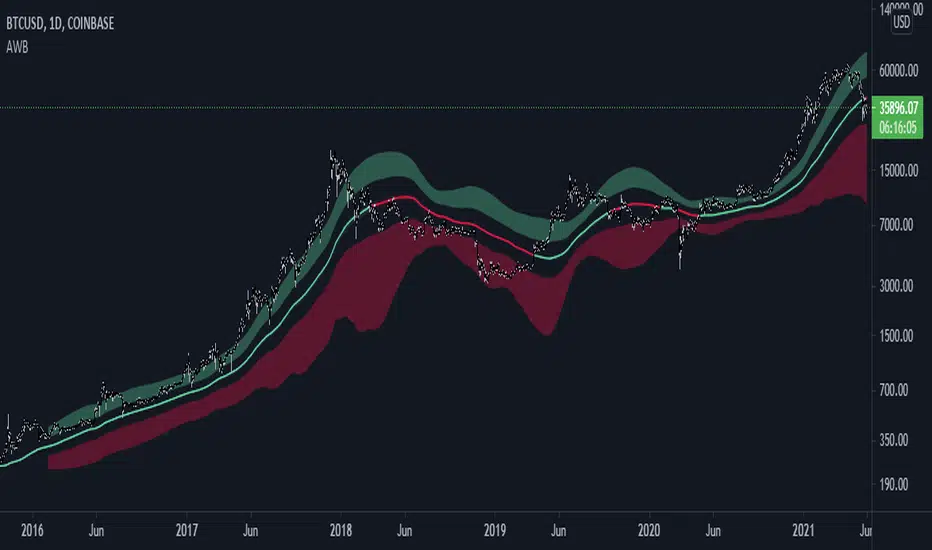
AWB - Alma Weird Bands [SilentShiller]A simple experiment that using Arnaud Legoux Moving Average tries to help visualize an extended trend and its reversal . You can play with:
Alma length
Alma offset ( needs sigma not to be 0 )
Alma sigma
I hope you find it useful. Feel free to modify it and let me know to test your scripts!
Crypto RSI Oscillator [marksc]This is my main indicator of pricing trend reversals.
It consists of two main indicators:
1. The green/red oscillator shows a general rising (green) or falling (red) price trend over a smoothed average of a number of periods (length).
2. The yellow "OverUnder Line" shows the Relative Strength Index adjusted price trend in real time.
How to use it:
- You will need to adjust the Overbought and Underbought (green and red) horizontal lines such that the yellow line rarely peaks past them. This will depend on historical data and the time-scale you're using. So if you configure it on a 15minute timescale and then switch to hourly the lines will need-readjusted. This is because the yellow line's movement is "Relative" to a number of periods of time in the timescale.
Predicting Pricing Reversals:
Adjust the Overbought and Underbought lines such that, in the past, the yellow line has rarely peaked over or under them.
When the yellow line peaks over or under one of the Over/Underbought lines again the price will likely make a strong reversal.
(Conversely, if the yellow line is not peaking but staying mostly flat or only slightly angled then the pricing trend is likely to continue.)
Predicting "Pump and Dumps":
If the price makes a sharp reversal while the yellow line was far from the over/underbought lines (ie. the yellow line was near the center), this indicates that a larger purchase or sale than has happened in a long time just happened. In most cases the price will quickly correct back to where it was because this sharp price reversal was was abnormal over the length*period used in the RSI calculation.

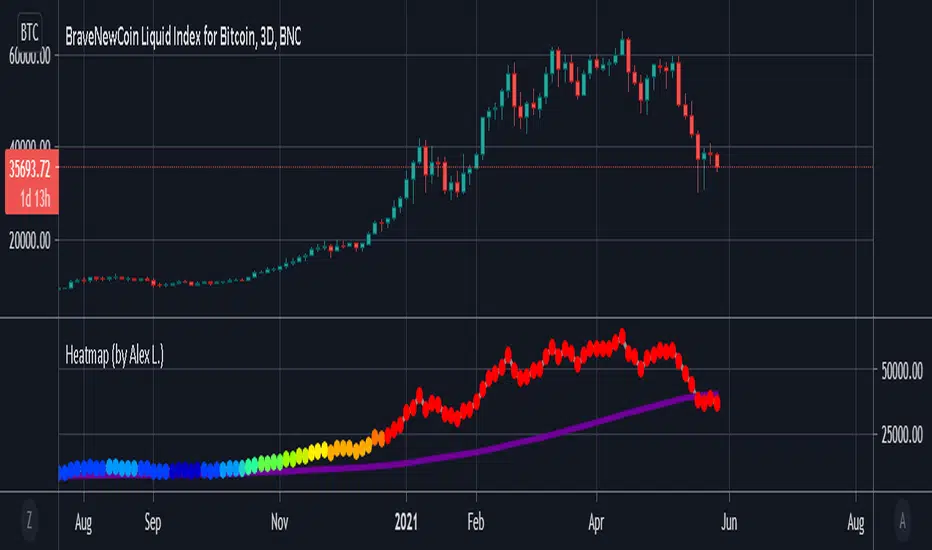
Bitcoin Heatmap (by Alex L.)This indicator is a based on "200 Week Moving Average Heatmap" by Plan B. It shows "heatmap" of a security based on % increase of its 200 week (or other) moving average. It can be used for Bitcoin, as well identifying overheated Stocks (like TSLA). Plan B designed this indicator for Bitcoin using MA = 1400 (which is 200 trading days in Crypto), I personally found it useful to indicate overheated Stock Market stocks using MA = 250 (which is ~1 year of net trading days, excluding weekends and holidays).
Enjoy!
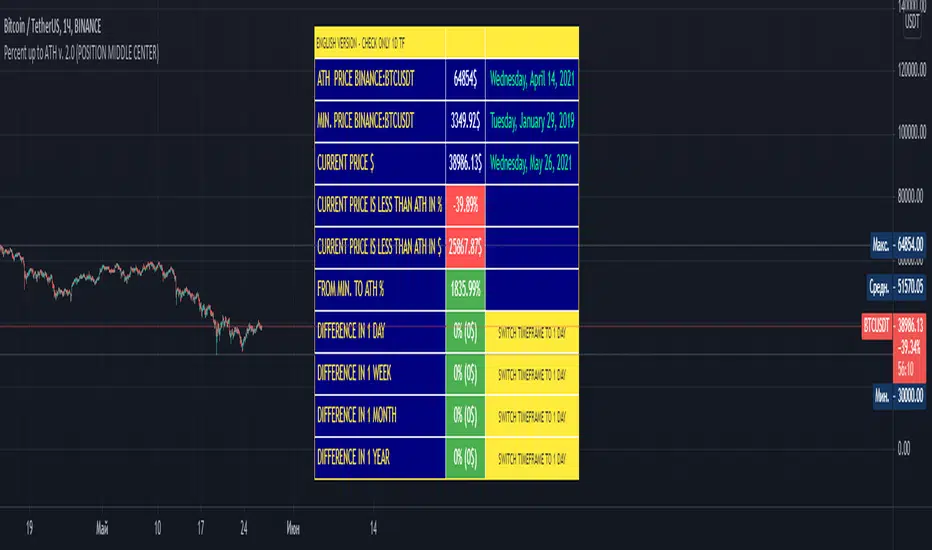
Percent up to ATH v. 2.0 (CHECK 1D TIMEFRAME)for the label to display the price change for 1 day, 1 week, 1 month and 1 year, you must switch the graph to the daily (1D) timeframe
this script shows:
- the maximum price and the date of this maximum
- the minimum price and date of this minimum
- current price and date of this price
- the difference between the current price and the maximum price in percent (%) and in dollars ($)
- the difference between the minimum price and the maximum price in percent (%) and in dollars ($)
- price change in percent and dollars for 1 day, 1 week, 1 month and 1 year
this script displays information in two languages - English and Russian
---------------------------------------------------------------------------------------------------------------------------------------------------------------------------------------------------------------
Чтобы на метке отображалось изменение цены за 1 день, 1 неделю, 1 месяц и 1 год, необходимо переключить график на дневной (1D) таймфрейм
этот скрипт показывает:
- максимальную цена и дату этого максимума
- минимальную цена и дату этого минимума
- текущую цена и дату этой цены
- разница между текущей ценой и максимальной ценой в процентах (%) и в долларах ($)
- разница между минимальной ценой и максимальной ценой в процентах (%) и в долларах ($)
- изменение цены в процентах и долларах за 1 день, 1 неделю, 1 месяц и 1 год
этот скрипт отображает информацию на двух языках - английском и русском.
BTC aggregated volume Index [Benson]Aggregate 10 most significant BTC trading pairs' volume on the market.
Bitfinex:BTCUSD
Bitstamp:BTCUSD
Coinbase:BTCUSD
Kraken:BTCUSD
Kraken:BTCEUR
Bitflyer:BTCJPY
BINANCE:BTCUSDT
HUOBI:BTCUSDT
OKEX:BTCUSDT
Bitstamp:BTCEUR
Setting (user input)
1. You can set length to see how SMA moves. Default is 7.
2. You can set std difference. If the volume is difference*std higher than average, the pillar would be orange, if difference*std is less than average, the pillar would be green, otherwise the pillar would be black. Default is 1.
3. You can set the volume in USD or in BTC. Default is in USD.

Beam Bands + Fibonacci LevelsThis indicator calculates the Fibonacci retracement levels based on beam bands. As you can see the price very often reacts to these levels.

Bitcoin Logarithmic Regression RainbowI know there are a lot of BTC rainbows out there, I just wanted to publish my version with my fittings to the BTC price.
The grey channel at the bottom encloses the March 2020 Corona dump.
For best experience USE WEEKLY TIMEFRAME .
