Bitcoin (Cryptocurrency)
ARI-DPO TrendThis is a new indicator that uses DPO (Detrended Price Oscillator) and calculating its HMA 200 and EMA 200 is able to show the current price direction.
if the line is below 0 the market is in a downtrend in the short term, otherwise, the market is in an uptrend.
if the line is red, the market is in a downtrend in the long term (bearish), otherwise, the market is in a long term uptrend (bullish)
a sequence of red/green lines means that the market is choppy
Currently, I'm using it with cryptocurrencies to assess if the short term price action.
How it works:
the indicator calculates the DPO (default 21 periods) and its HMA (default 200 periods) and EMA (default 200 periods) and shows if the DPO is above both HMA and SMA (indicator line above 0 and green), below both (indicator line below 0 and red) or between (the indicator line and the colour are not matching: e.g. red line above the zero or green line below zero). the latter is the classic situation of a choppy market or a possible short term reversal.
The aim of this indicator is to find a good entry point for long/short positions.
I'm still testing and improving it, please
let me know in the comments if you find this useful. Cheers!

Bollinger Band Color BarsThis is a simple addition to the built in Bollinger Bands script. All it does is replaces the traditional plotting of Bollinger Bands with color bars.

Bitcoin Estimated Transaction FeeThis is the estimated fee you can expect to pay to have your bitcoin transaction confirm in 1 block. The estimation is derived from the daily total revenue miners received divided by the daily total number of transactions.
An option to change to a different currency is provided.
Notes on transaction fees:
Most exchanges do not provide an option to change the fee amount, and charge a static fee. A notable exception is Deribit.
The newer Bech32 wallet format, also known as native or SegWit, use a lower fee for the same transaction as legacy addresses. The addresses start with "bc1".
Mania was $60 USD to move bitcoin to an exchange you've only just heard of to buy a different coin with funny name :)

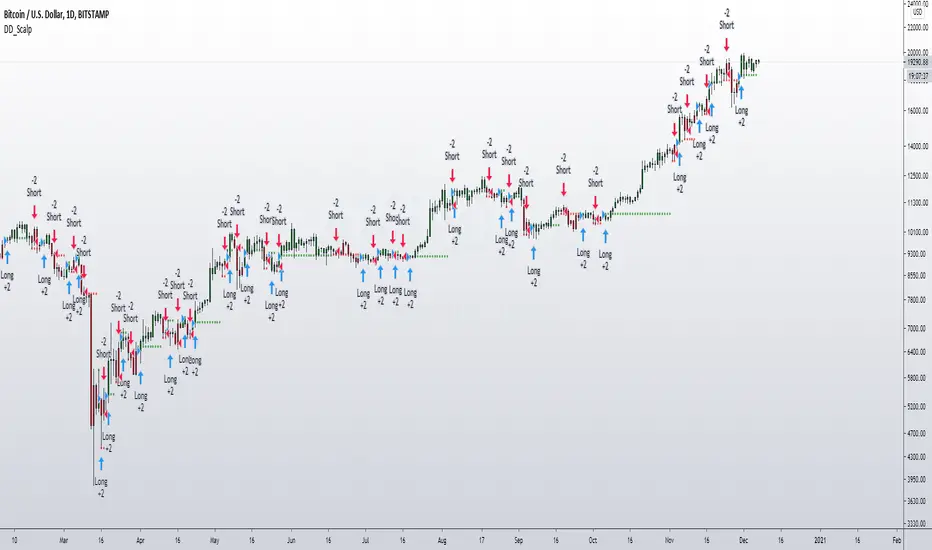
DD_ScalpDD_Scalp is a buy/sell trading strategy based on momentum from breakout levels. It works well on 1D and 4H timeframes. It is a helpful indicator for scalping short range profits on a daily basis or for booking profits in a high time frame setups such as those given by my DD_Echo indicator. It works for all major cryptos such as BTC, ETH, LINK, and other alts. It also works for forex.
If you want to access this, please DM me.
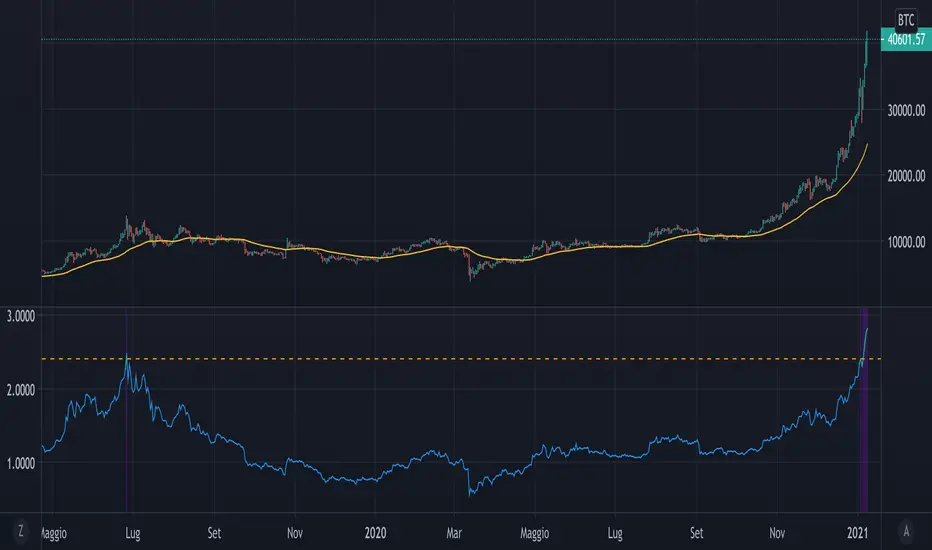
Mayer MultipleThe script implements a custom version of the Mayer multiple and it may be useful for analyzing the price of Bitcoin in a historical context.
Note n.1: Mayer multiple does not tell whether to buy, sell or hold, but highlights the best long-term area when the bitcoin price is below a threshold value (2.4).
Note n.2: the threshold value (2.4) has been determined in the past by simulations performed.
The script user may decide whether to use the shown graph or another graph for the calculation of the Mayer multiple.
The script is very easy to use and it is possible to change the following parameters:
the period of SMA (default value is 200)
the threshold (default value 2.4)
Show or not the sell area
Use or not the shown graph to calculate the Mayer multiple (default value is true)
name of exchange to use for calculation of the Mayer multiple (default value is BNC)
name of chart to use for calculation of the Mayer multiple (default value is BLX)
Profits Unlimited Pro Strategy** This is the backtesting (strategy) version of ~ Profits Unlimited Pro ~ proprietary script in TradingView. **
~ Profits Unlimited Pro Strategy ~
֎ Trading system script on tradingview that brings an easy approach to trading with a high profitability rate
֎ Our proprietary formula was developed over the course of the past two years through a combination of trial and error and algorithmic backtesting.
-- HOW IT WORKS --
֎ The algorithm starts with a proprietary script combining custom inputs with a formula that works with custom bollinger bands settings and specific RSI levels to results in deadly accurate signals for long and short entry points.
but that's not all...
֎ When we first developed our formula, we noticed that it produced a lot of accurate signals but also didn't fully understand the dynamics of market momentum and trending directions...
...so there were a lot of needless calls being made that were reducing profitability.
You see, most markets spend roughly 80% of the time trading sideways with no significant trend either up or down...
...And trading these sideways markets commonly result in what's called a "whipsaw"...
A whipsaw is when price is moving in one direction but then quickly pivots to move in the opposite direction resulting in a loss. And nobody wants to be stuck trading in a sideways market getting killed by whipsaws all day...
So what did we do to fix this?...
-- THE WINNING FORMULA --
֎ We added the Average Directional Index into our custom formula with a goal of teaching the algorithm to only trade during periods of strong momentum and trends whether up or down.
֎ We also added trend exhaustion levels to give clear indication for exit signals and help determine best times of getting out of a trade.
֎ Trend Exhaustion Levels work in conjunction with trailing stop loss % and both are customizable for ideal exits and profitability.
֎ The results are mind blowing!
-- WHO IT'S FOR --
֎ Optimized for crypto markets, to catch trend movements as soon as possible and maximize profitability
֎ It's A Swing Traders Dream.
-- What You Get --
֎ Sell & Buy alerts, Stop Loss alerts and always adding new features!
֎ Customizable settings.
֎ Chrome Extension in development for fine-tuning settings automatically(COMING SOON)
-You will be able to select an asset. push a button. and the extension will find the best settings for you!
֎ Users Facebook community for learning, sharing and direct support
If you’d like to test the trading script in TradingView, I can give you access to a 10 days trial.
Please send me PM in tradingview and I’ll activate it right away.
Thank you!
Companion::DivergentCompanion::Divergent is a combined indicators strategy optimized for Bitcoin Markets and tested on Bitfinex.
Mainly, it is an Ichimoku based strategy.
Used indicators:
- Ichimoku (displayed on chart): trendline analysis;
- Double Hull MA (displayed on chart): trendline analysis;
- MACD (not displayed): confirmative/momentum detection;
- CCI (not displayed): confirmative/momentum detection;
- ATR: used toghether with Ichimoku to determine Stop Loss/Take Profit levels;
- VWMA: For implementing trailing stop orders based on volumes.
What the script does:
- determines trendlines combining mulitple indicators;
- automaticlally calculates Take profit and Stop Loss levels;
- permits automation generating Autoview signals;
- supports for margin trading. Spot trading will be added in the future.
It can be used on 1D or 1H timeframes but it can be adapted for other time frames tweaking the parameters. I used it a lot on Bitfinex on 1H timeframes. Please check parameters: if you will use the strategy on D or higher timeframes, the "Legacy Chikou analysis" option should be checked.
BACKTESTING
Backtest is not leveraged. Defaults are set as follow:
Capital: 10000
Percent of equity used for trades: 10%
Commission: 0.18% this is Bitfinex commission on orders
Change them accordingly on how you trade to get a more realistic backtest results.

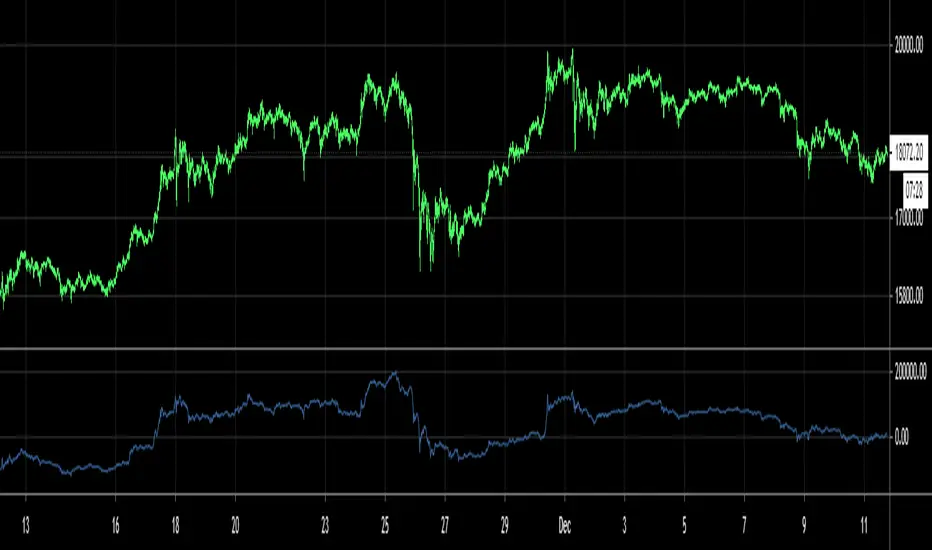
Micro Strategy PremiumSince the decision to buy 38,250 Bitcoin under their new treasury policy. Micro Strategy has become an easy and tax efficient way for many investors to gain an exposure to Bitcoin.
This script displays:
- Micro Strategy premium vs price of BTCUSD (CME)
- Micro Strategy premium vs price of BTCUSD (CME) minus Nasdaq 100 (QQQ ETF). A straightforward method to detach Micro Strategy’s share price from the overall performance of the US tech sector. This could potentially give you a more accurate premium.
- Micro Strategy’s 38,250 BTC as a percentage of their Market Cap
This script also acknowledges that Micro Strategy should be renamed “Macro Strategy” and that Michael Saylor is a living legend.

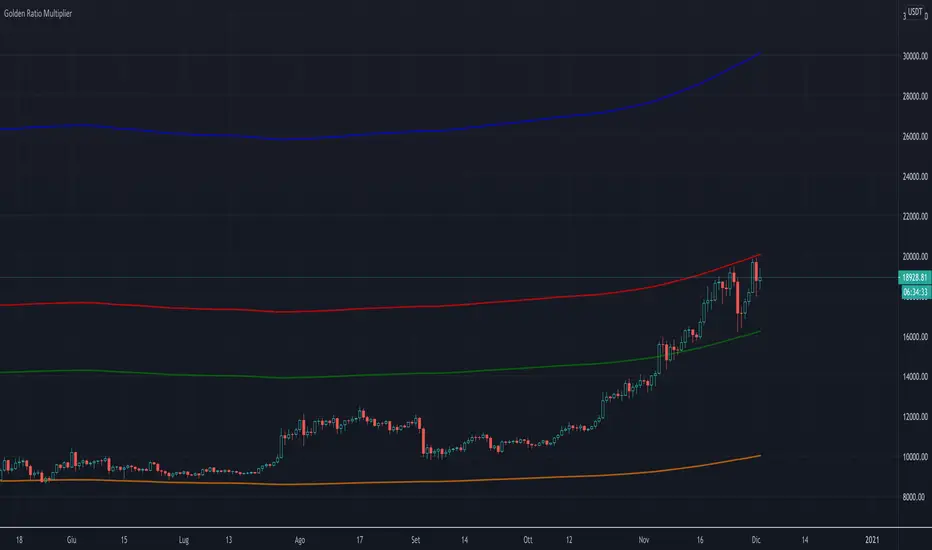
Golden Ratio Multiplier (x1.6; x2; x3)The script displays three multipliers (x1.618; x2; x3) of the Golden Ratio (starting with MA at 350 days) to identify the following levels of support:
the multiplier x1.618 is an accumulation high (green line)
the multiplier x2 is a support that identify a low bull high (red line)
the multiplier x3 is a support that identify an upper bull high (blu line)
Note: the orange line is the SMA at 350 days.
Bitcoin Future Market Sentiment Pro (Indicator)[Benson]Sentiment Indicator Pro is a low-frequency trading signal developed by Benson.
It includes two products:
Indicators (display trading points on the K bar)
Stats (market sentiment stats)
This signals is based on the market stats from main BTC futures markets(BitMEX, Binance, Bybit, FTX), and uses composite technical indicators to filter out the best buying and selling points.
The backtest data of the past two years has a higher probability of identifying the relative high and low points of BTC's price
Since this signal is left-hand style trading style, ,it might be too early to identify the bottom or top, hence it is recommended that you use less than 2X leverage .
Note: The indicator is recommended to be applied in 1hr/2hr/4hr timeframes.
This is a paid indicator with a 14 days free trial, to get the access, please pm my Tradingview account directly.
Sentiment Indicator Pro 是 Benson 開發的低頻交易信號指標
此指標包含兩個產品:
Indicator (於K棒顯示買賣點)
Stats (市場情緒數字)
該信號基於多個期貨市場(BitMEX,Binance,Bybit,FTX)的數據,並使用綜合技術指標篩選出最佳的買入和賣出點
過去兩年的回測數據有較高機率識別出 BTC 價格的相對高低點
由於此信號是基於期貨市場數據作為左側交易的參考,有時候可能會過早識別出買點或賣點,因此建議您使用小於 2 倍的槓桿開單。
注意:建議在 1hr / 2hr / 4hr 時框使用該指標
這是一個付費指標,免費試用 14 天,如果你想使用這個指標,請直接私訊我的 Tradingview 帳號

Bitcoin Future Market Sentiment Pro (Stats) [Benson]Sentiment Indicator Pro is a low-frequency trading signal developed by Benson.
It includes two products:
Indicators (display trading points on the K bar)
Stats (market sentiment stats)
This signals is based on the market stats from main BTC futures markets(BitMEX, Binance, Bybit, FTX), and uses composite technical indicators to filter out the best buying and selling points.
The backtest data of the past two years has a higher probability of identifying the relative high and low points of BTC's price
Since this signal is left-hand style trading style, ,it might be too early to identify the bottom or top, hence it is recommended that you use less than 2X leverage .
Note: The indicator is recommended to be applied in 1hr/2hr/4hr timeframes.
This is a paid indicator with a 14 days free trial, to get the access, please pm my Tradingview account directly.
Sentiment Indicator Pro 是 Benson 開發的低頻交易信號指標
此指標包含兩個產品:
Indicator (於K棒顯示買賣點)
Stats (市場情緒數字)
該信號基於多個期貨市場(BitMEX,Binance,Bybit,FTX)的數據,並使用綜合技術指標篩選出最佳的買入和賣出點
過去兩年的回測數據有較高機率識別出 BTC 價格的相對高低點
由於此信號是基於期貨市場數據作為左側交易的參考,有時候可能會過早識別出買點或賣點,因此建議您使用小於2倍的槓桿開單。
注意:建議在1hr / 2hr / 4hr 時框使用該指標
這是一個付費指標,免費試用 14 天,如果你想使用這個指標,請直接私訊我的 Tradingview 帳號

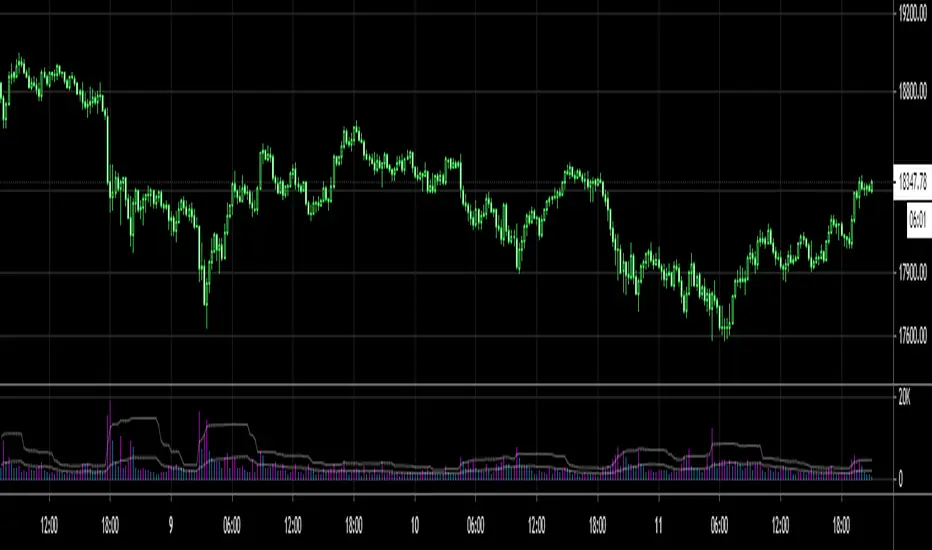
Crypto Breakout AlertThe indicator plots breakout events of user-defined assets list, providing alert setting for breakout events.
Any big trend begins with a couple of price breakouts. By watching breakout events, we overlook the panorama of the whole market.
---------- Features --------------
User-Defined Crypto / or any Asset List, Up To 30 Assets
User-Defined Breakout Threshold
Accessible for wide timeframes: 5s - 1 Month
Plot the Breakouts History of whole market
Progressive color according to the strength of the breakthrough
--------- Indicator Settings -----------
"Show Bull or Bear?": To show Bull Breakout, Bear Breakout or Both
"User-Defined Breakout Threshold": User can defined the threshold of breakout, default value 999 means using default set up, as following - "Default Breakout Threshold"
"A rate to decrease Bitcoin Threshold": Bitcoin has much lower volatility than other coins, so this rate is usded to lower the threshold for Bitcoin, defval = 0.5
"Use Green for Bull? ": Toggle color for Bull, defval: true, if your region use red for bull, toggle it.
"Exchange": Your exchange name, which is used to defined tickerid, defval="BINANCE", optional - can be empty
"Asset PostFix": postfix of your asset symbol, which is used to define tickerid, defval="USDTP", change it if necessary, this can not be empty.
"Toggle Notice Label": close or open the notice label
--------- Default Breakout Threshold For Popular Timeframes-------------
5s 0.5%
15s 0.75%
30s 0.9%
1m 1.2%
2m 1.4%
3m 1.6%
5m 1.8%
8m 2%
15m 3%
20m 3.5%
30m 4%
60m 5%
120m 6.5%
240m 8%
480m 10%
1D 12%
1W 20%
---------- Versions Description ----------
The features may change later without advance notice.
DEMO version has basic features.
---------- Access to Indicators ----------
Contact the author by Private Chat for access to Invite-Only versions and a trial.
---------- Install Invite Only Version----------
Open the chart -> Add Indicators (On the Top or press /) -> Invite-Only Scripts (last button of the left bar)
Like/Favorite the indicator
Click to install on the chart
---------- About Loading Time ----------
It may take up to 1-3 minutes for your browser to load a new setting, depending on the your computer and network speed. For convenience, you can keep related pages open continuously.
---------- FAQ -----------
1. Why can't I see older breakout labels?
Due to system limit, 500 is the maximum of labels.
In order to see older breakout events, please Select Bull or Bear, instead of Both; Or Increase to filter weak breakouts.
2. How to watch more than 30 coins?
Due to system limit, 30 assets is the maximum.
In order to watch more assets, user can open the indicator in another chart, add your 2nd assets list, save 2nd layout, set alerts for different lists respectively.
---------- Disclaimer ----------
By using or requesting access to the indicator, you acknowledge that you have read and accepted that the indicator and any related content, including but not limited to: user manual, tutorials, ideas, videos, chats, emails, blog, are for the purpose of trading strategies studying and paper trading.
If a customer or user uses the indicator or related content mentioned above for live trading or investment, she/he should take all risks and responsibility of her/his own trading and investment activities.
---------- Updates ----------
The latest updates override the previous description.
To activate a update: Close the browser, Reopen the chart and apply the indicator.
【加密货币突破预警】指标绘制一系列资产的突破事件,提供突破预警
任何大趋势都开始于一系列的价格突破。通过监控突破事件,可以俯瞰市場的運動
---------- 产品特征------------
用户自定义的加密货币品种列表,或者其他资产列表,多达30个品种
用户自定义的突破门槛
适用于宽泛的时间维度:5秒--1月
绘制整个市场的突破历史
漸進顏色 根據突破的力度
------------- 指标设置说明 -------------------
"展示牛熊突破?": 展示牛突破,熊突破或者两者
“用户自定义突破门槛”: 自己定义突破门槛,999代表默认的设置,详见下方“默认的突破门槛”
"比特币突破门槛修正": 比特币的波动性远远低于其他加密货币,这个比率用来调低比特币的门槛
"切换通知标签": 用来开关通知标签
"綠色為牛?": 切換標籤顏色,默認綠色為牛
“交易所”:用来定义资产名称,可以为空
“资产后缀”: 用来定义资产名称,不可以为空
---------默認的突破門檻-------------
5s 0.5%
15s 0.75%
30s 0.9%
1m 1.2%
2m 1.4%
3m 1.6%
5m 1.8%
8m 2%
15m 3%
20m 3.5%
30m 4%
60m 5%
120m 6.5%
240m 8%
480m 10%
1D 12%
1W 20%
---------- 版本描述 ----------------
產品特徵後續可能變化,恕不事先通知
DEMO版本供試用
----------- 獲取指標使用權 ------------
通過私信聯繫作者,要求訂閱或試用
----------- 安裝指標 -----------------
加指標 -》 Invite-Only (左邊欄目)
點贊或者收藏指標
點擊安裝指標
----------- 關於載入時間 ---------------
可能需要1--3分鐘來完成載入,取決於用戶的電腦和網絡速度,方便起見可以保持相關頁面持續開啟
------- FAQ ----------
1. 如何查看更早的突破歷史
由於系統限制,500 個標籤是上限
為了查看更早的突破,請選擇牛或者熊,而不是兩者;或者提高"用戶自定義突破門檻" 來過濾掉弱突破
2. 如何監控更多資產?
由於系統限制,30個資產是上限
為了監控更多資產,可以在第二個圖表加載指標,保存圖表,分別在不同的圖表設置突破預警
---------- 免責聲明 ----------
在要求獲得本指標使用權之前以及在使用本指標之前,用戶認可已經完全了解和接受:本指標僅供學習交流目的, 它不構成任何交易建議或者投資建議。用戶如果將指標用於其他用途,應自行承擔所有風險和責任。
本指標的開發者並非專業投資顧問,因此不對用戶的任何行为負責。
最近的更新會覆蓋之前的說明。請參閱更新來查看指標的新特徵和功能。

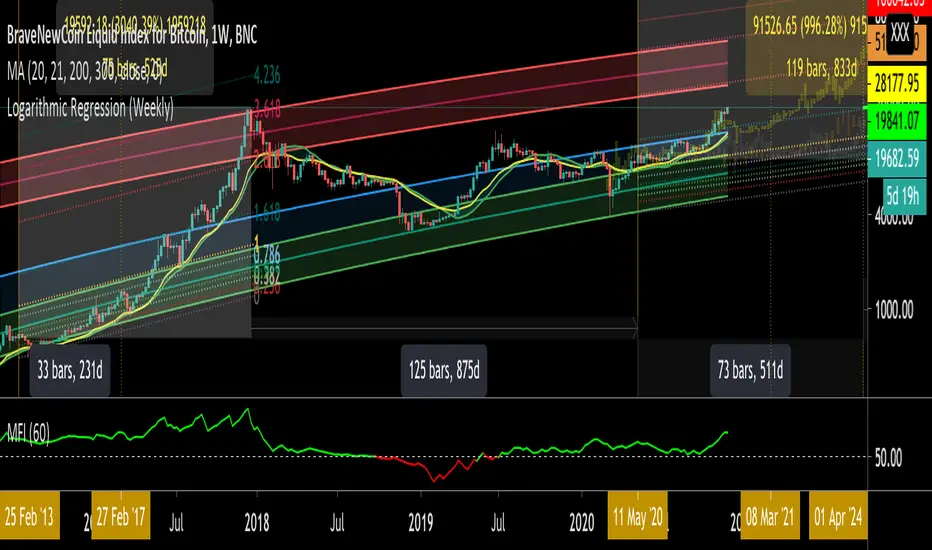
Logarithmic Regression (Weekly)This script is a combination of different logarithmic regression fits on weekly BTC data. It is meant to be used only on the weekly timeframe and on the BLX chart for bitcoin. The "fair value" line is still subjective, as it is only a regression and does not take into account other metrics.
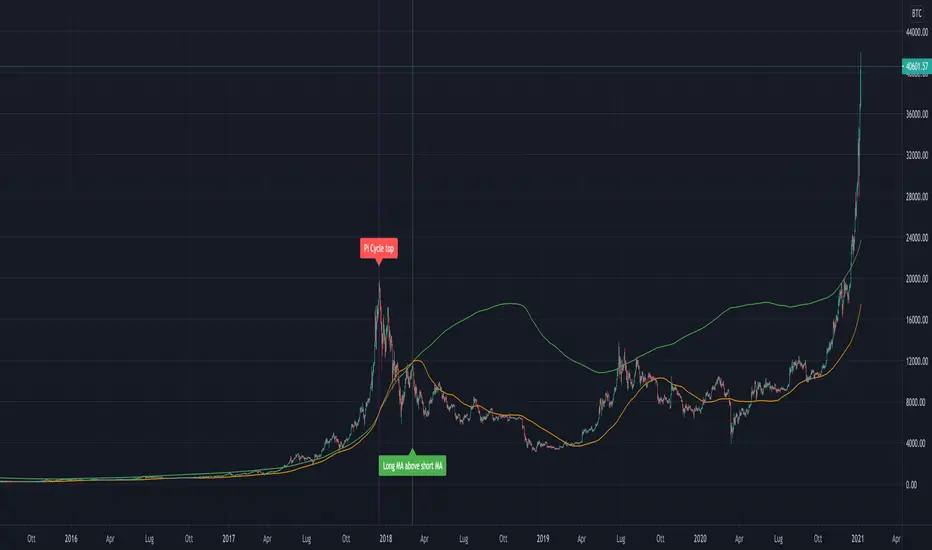
Pi Cycle Bitcoin Top IndicatorThe script implements the Pi Cycle Top indicator
This indicator identifies tops in the bitcoin market cycle. Historically, the Pi Cycle Top indicator has called out tops in the price of bitcoin within three days.
The script is very easy to use and it is possible to change the following parameters:
the time interval (default value is day);
the days of long moving average (default value is 365)
the days of short moving average (default value is 111)
show the moving average plots
show the Pi Cycle Top label highlighting the cross-point
[5F] Bitcoin Hash Rate + Miners revenue-═════════════════════════-
📋 Description :
This script display the Bitcoin' Hash Rate and the Miners revenue based on the data provided by Quandl.
Hashrate is displayed in TH/s : trillion hashes per second with an moving average.
Miners revenue is calculated by : (the number of bitcoins mined per day + transaction fees) * market price
The dates of previous halving are also displayed.
🛠 Note :
There is a multiplier on the miners revenue that you can configurate. It's only used to bring the 2 curves closer together for better visibility but the multiplier don't affect the revenue's data.
You can choose between different types of moving average for the hashrate's signal : SMA, EMA, DEMA, TEMA, WMA, VWMA or TMA.
You can show and hide each elements of the indicator
Thanks to all Pinecoders who share their work with the community.
-═════════════════════════-

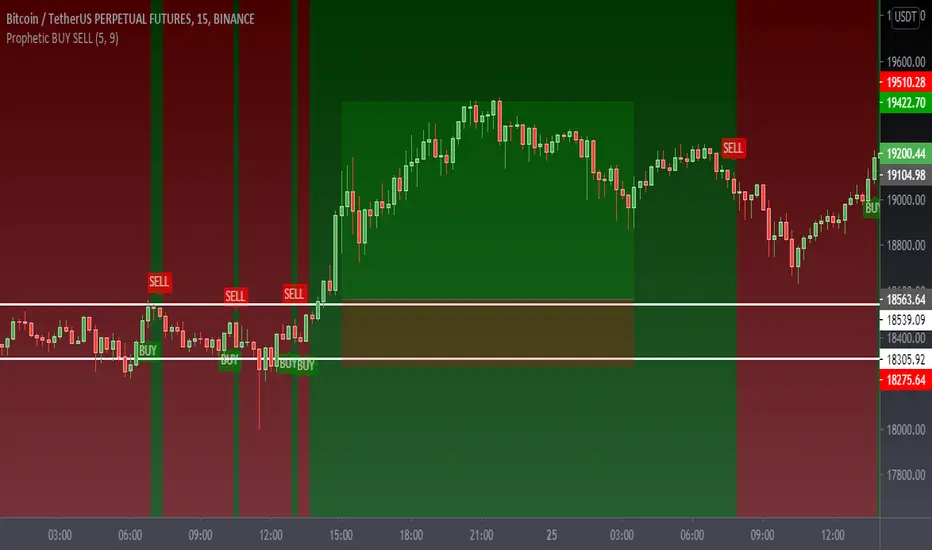
Prophetic BUY SELL IndicatorThis premium indicator will help you to do quick scalping on Cryptocurrencies, Forex, and Stocks.
This indicator is very simple to understand.
Green BUY Alert - Buy Signal Market is up
Red SELL Alert - Sell Signal Market is down
Caution:- Do not use it during market being choppy or sideways
Once the BUY signal appears the background changes green and same with SELL it turns red
can change the color according to requirements
It also has a moving average which also changes the color as the candles close above the MA or the below Default color are green and red
Please Like Share and Follow and if required please contact:- @mobudd (TELEGRAM)
or Ping me on trading view
Guys, It takes effort so please do not ask for free access.
You're always welcome to share any type of suggestion & feedback.
The WaveRider - Help me to exit position!Hello,
I always like to refer to my previous articles to allow people to understand where am I in terms of knowledge at the time when I write this article.
BTC and ETH Long strategy version 1
BTC and ETH Long strategy version 2
Although some part of my crypto trading is automated via HaasOnline software, I like to take discretionary trades to feel the excitement of manual trading, especially during bull market :).
I write this new article and script because I did struggle to decide when to exit a recent LONG position on Ethereum.
Most of the novice traders struggles to know when to exit the position when gains are made.
The is exactly what happens to many people trading cryptos in the beginning of this bull market.
We always want more, we want to ride the wave as much as possible.
We see the gains growing every day and don't want to exist the position because tomorrow will bring more gains.
Yes, but sometimes there is a small retracement, the price is bleeding slowly but we want to hold because the price will move UP again in one of two days.
So the big question is went to exit (or not).
This subject is a difficult one because we are humans and highly influenced by our psychology.
Depending on the mood we are in, we can take different decisions.
If we are not feeling good and we are not in good mood, we will probably close a winning position as soon as a retracement comes in to keep our gains because we see this retracement as something bad.
On the other side, if we feel good and are in a good mood that day, we might take to opposition decision and keep the trade running as we believe that this retracement is something healthy for the price to allow it to continue to move up.
For novice traders, these emotions can impact the way how we trade and create frustrations if we exit a position too soon or too late.
So, why not to let a script giving us advices on this decision? If we are not sure if we should exit or not, this script might help us to take a better decision.
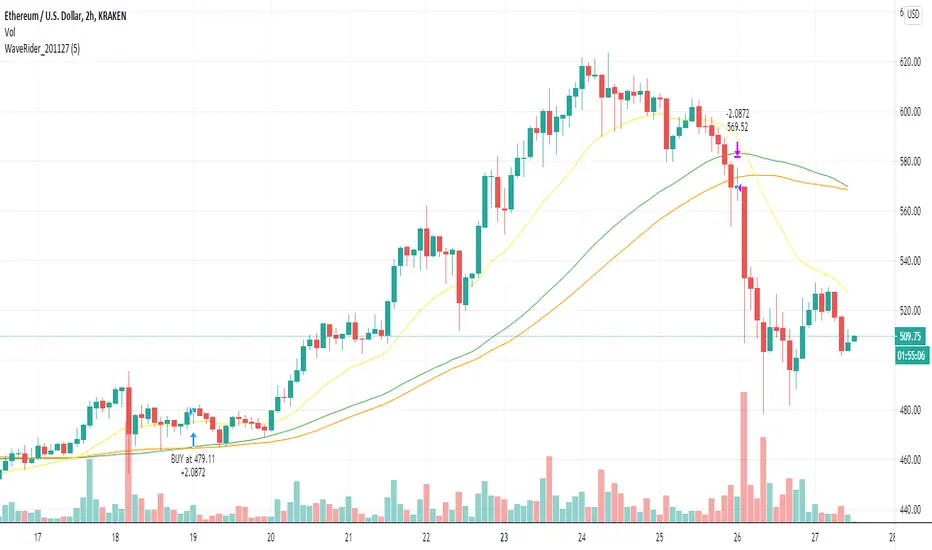
I have named this script the "WaveRider" because it is supposed to be used during bull market only when the asset is moving up.
Best time frame to use with crypto such as Bitcoin and Ethereum are 2H, 4H and 6H candles.
Even if it can also give you entry points to open a trade, the goal of this script is more to give you exit points.
So, if you have opened a trade manually and you are wondering if this is the right time to close it, this script is made for you.
Technically, entry points are based on 2 Moving averages (slow and fast). We can enter in position when crossing over.
The Position can be closed if the same Moving averages are crossing down. In addition, it will exit if the price suddenly drops below the Moving average.
I know it sounds simple and stupid, but sometimes we don't ask ourselves the right questions when taking the decision to exit a position. So, this script will remind you the basic stuff to consider before closing your position.
I hope that such idea will help you to take good exit decisions in the future.
Let me know if you need more details or want to access it.
[5F] Total circulating Bitcoin-═════════════════════════-
📋 Description :
This script displays several informations about Bitcoin :
the maximum number of Bitcoin
number of mined BTC
number of unmined BTC
calcul them in %
shows the previous halving date
📆 Note : need to be in dayli resolution or higher
Thanks to all Pinecoders who share their work with the community.
-═════════════════════════-

BTC and ETH Long strategy - version 2I wrote my first article in May 2020. See below
BTC and ETH Long strategy - version1
After 6 months, it is now time to check the result of my script for the last 6 months.
XBTUSD (4H): 14/05/2020 --> 22/11/2020 = +78% in 4 trades
ETHXBT (4H): 14/05/2020 --> 22/11/2020 = +21% in 9 trades
ETHUSD (4H): 14/05/2020 --> 22/11/2020 = +90% in 6 trades
Using the signals from this strategy to trade manually has shown that this was a bit frustrating because of the low rate of winning trades.
If you have to enter 100 trades and see 75% of them failing and 25% winning, this is frustrating. For sure the strategy makes good money but it is difficult to hold this mentality.
So, I have reviewed and modified it to get a higher winning rate.
After few days of work, tests and validation, I managed to get a wining rate close to 60%.
The key element was also to decrease the number of trades by using a higher time frame. (4H candles instead of 2H candles).
- Entry in position is based on
MACD, EMA (20), SMA (100), SMA (200) moving up
AND EMA (20) > SMA (100)
AND SMA (100) > SMA (200)
- Exit the position if: Stoploss is reached OR EMA (20) crossUnder SMA (100)
The goal of this new script is to be able to follow the signals manually and only make few trades per years.
I have also validated it against some other altcoins where some are giving very good results.
Here are some results for 2020 (from 01/01/2020 until now (22/11/2020). Those results are the one I get when using 4H candles.
ETH/USD: +144% in 8 trades.
BTC/USD: +120% in 7 trades.
ETH/BTC: +33% in 9 trades.
ICX/USD: +123% in 10 trades.
LINK/USD: +155% in 11 trades.
MLN/USD: +388% in 8 trades.
ADA/USD: +180% in 7 trades.
LINK/BTC: +97% in 10 trades.
The best is that above results are without considering compound effect. If you re-invest all gains done in each new trade, this will give you the below results :)
ETH/USD: +189% in 8 trades.
BTC/USD: +260% in 7 trades.
ETH/BTC: +29% in 9 trades.
ICX/USD: +112% in 10 trades.
LINK/USD: +222% in 11 trades.
MLN/USD: +793% in 8 trades.
ADA/USD: +319% in 7 trades.
LINK/BTC: +103% in 10 trades.
As you can see, the results are good and the number of trades for 11 months is not big, which allows the trader to place orders manually.
But still, I'm lazy :), so, I have also coded this strategy in HaasScript language which allows you to automate this strategy using the HaasOnline software specialized in automated crypto trading.
I hope that this strategy will give you ideas or will be the starting point for your own strategy.
Let me know if you need more details.

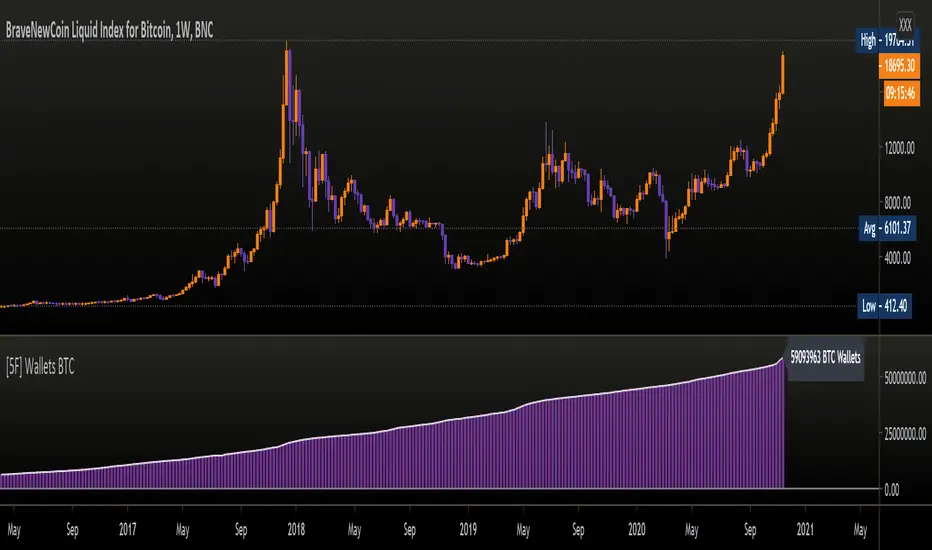
[5F ] Number of Bitcoin wallets-═════════════════════════-
This is a simple script that displays the total number of Bitcoins wallets based on the data provided by Quandl.
Use it in dayli resolution minimum
Refresh every day
Thanks to all Pinecoders who share their work with the community.
-═════════════════════════-
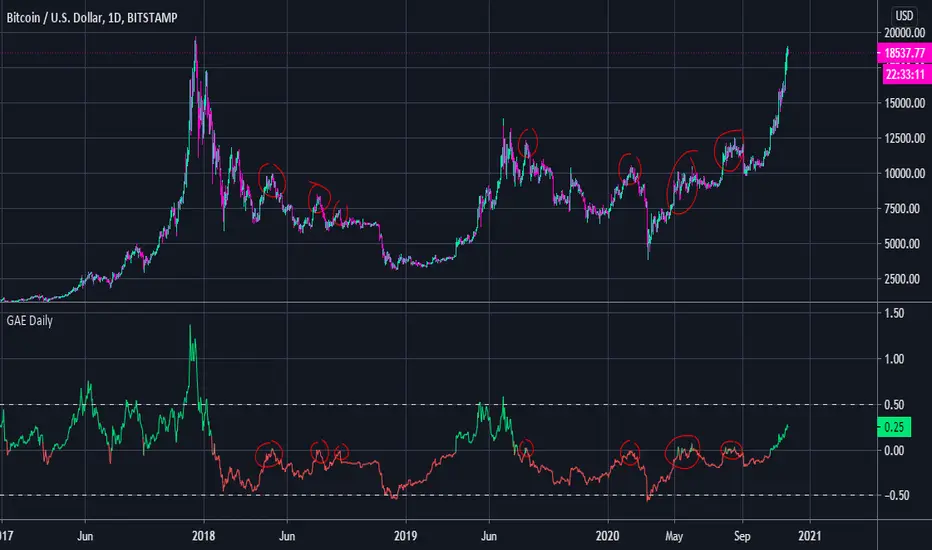
General Accumulation Evaluation BULL or BEAR Daily TrendGeneral Accumulation Evaluation by Lordchicken aka Chikun
This indicator is ONLY useful on the daily time frame and ONLY on BTC.
It will show you the general trend of BTC.
Basic:
X > 0 = Bullish trend
X < 0 = Bearish trend
X > 0.5 = Overbought
X < -0.5 = Oversold
Advanced:
If X < 0 and tries to go above 0 that's a good place to short
The end of a Bull/Bear trend is often shown with a strong reaction of X going above/beneath 0.