Altsignals-Running EquityThis is a backtested for the running equity for our Altsignals Indicator PRO+ and SLIM+.
It shows you the performance of each trade, shows you periodical equity, resets the equity after each period to 0, shows histograms after each trade.
This is an easy visual tool following Gainzys style to see how the algorithm performed previously and which settings might be the most or more profitable ones in the near future.
The source of calculation to choose a value between one and close.
Added to show LONG ONLY and SHORT ONLY Equity for LONG ONLY or SHORT ONLY strategies.
Best regards, Altsignals
Bitcoin (Cryptocurrency)

Cyatophilum BITCOIN Daily IndicatorFree indicator
To get it, add it to your favorites using the button below, then you will find it on your chart in the "favorites scripts" tab
I wanted to have a tool that would quickly show me an overview of the Bitcoin chart each day, and receive alerts when something was happening, so I made this indicator.
Optimized for Bitcoin / USD on the daily timeframe, this indicator uses many technical tools such as a double Donchian channel, momentum, volume, RSI, divergences and moving averages.
HOW TO USE
Signals - You can create Automated Alerts corresponding to the graphic labels on chart.
BUY: Most bullish signal. Go long or buy bitcoin if you haven't already.
⚠️ REVERSAL: The bear trend might be over soon. Prepare some stable coins on your exchange to make sure you are ready to trade.
⚠️ RISE: Very bullish signal meaning a lot of people are buying. At this point you should just follow the sheep herd and buy.
⚠️ DROP: A drop is very likely to happen. Take your profits even though the rally can continue. Most of the time the price will drop significantly.
SELL: Most bearish signal. Go short or sell bitcoin.
Note: Use 'Once per bar close' option when creating alerts to get the exact same signals as on the chart, but only at candle close. Otherwise use 'Oncer per bar' to get them as soon as possible but the graphic-signal can disappear (unvalidated) at candle close.
Parameters
"Show 3 EMAs": Show a 50, 100 and 200 EMA. Usefull for golden/death cross.
"Channel_Length" Length in bars for the double Donchian Channel. Default is 30.
Any feedback is welcome!
To get access to my private strategies, use the link below


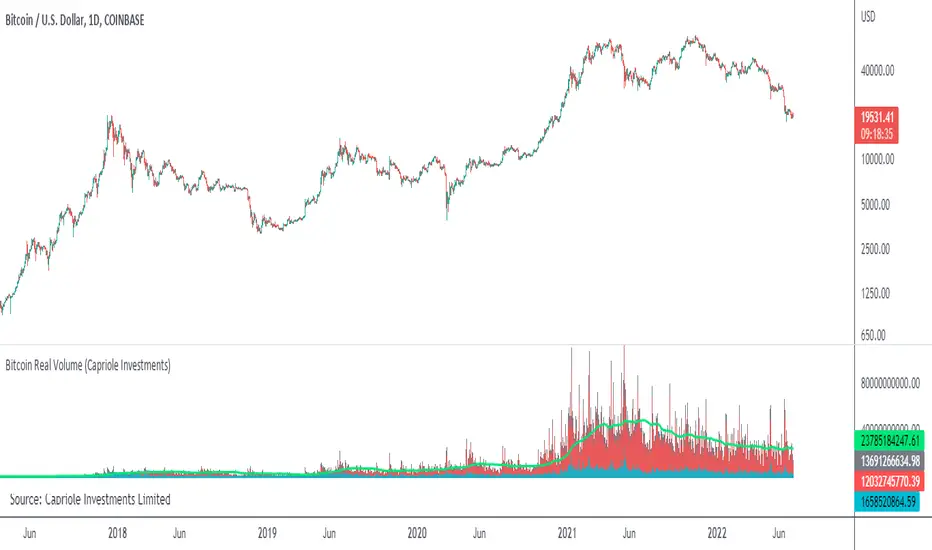
Bitcoin Real VolumeBitcoin’s Real Volume
An accurate read on the change in Bitcoin’s volume profile over time.
Based on 2019 reports by Bitwise and Alameda Research.
Please see the script code notes for assumptions and details on data selection.
Follow me for more information on this script.
BTC Traffic LightsTracks BTC price of various exchanges across several time frames
Time frames:
1 minute
5 minutes
15 minutes
30 minutes
1 hour
4 hour
8 hour
1 day
8 red lights: dump incoming
8 green lights: pump incoming

Multi-Exchange Volume (30 Tickers) by kurtsmock + BV + rVolauthor: kurtsmock
Fully Customizable ticker set. Up to 30 Tickers. Bitcoin set as default.
-- IMPORTANT NOTE: --
30 Exchanges are a lot. It can take a while to load. You can fully customize this indicator to your liking. Here's how:
1. Load indicator
2. Open Settings
3. Uncheck the switch box for exchanges you want unincluded
4. At the bottom of the settings menu click "Defaults" and hit "Save as Default"
5. To turn them all back on, hit "Reset Settings" in that same "Defaults" menu and click "Save as Default" again.
Also, you don't have to use this with Bitcoin. This works with any asset, just change the ticker in the settings.
There's a lot going on with this indicator so the following is descriptions and instructions to help you better understand what's going on here. Thanks!
Goal:
- To provide a mechanism for assets on multiple exchanges to have their volume evaluated together
Edge:
- Having better and more complete volume information
Notes:
- The Default Exchanges for this indicator are highest volume bitcoin exchanges, but may contain "fake volume"
- Indicator is set for Bitcoin by default. However, you can change the tickers to reflect any asset you want
////// rVol //////
Goal:
- To understand how much volume is being executed relative to the same candle on previous days/periods
Edge:
- Higher rVol implies higher volatility and market interest.
- High rVol = higher than average volume . Markets move on volume so higher than average volume indicates increased market activity/volatility
- rVol is an indirect measure of active or anticipated volatility
Definitions:
- rVol: The volume of a period compared to the Average Volume of that same period in past sessions
- Important to note it does NOT add up the last 10 (default) candles, but rather the last 10 candles at session intervals.
- Example:
-- On a Tuesday, 1h chart it will add up the last ten Tuesday, 9:00 am candles, not including the current, active candle.
-- It then averages those lookback candles.
-- It then plots the percentage relationship between the most recent candle and the average of the lookback candles
-- Avg Vol of Lookback candles = 5000,
-- Volume of most recent candle = 4000: Output = rVol = 80:
-- Volume of most recent candle was 80% of the average volume in the 9 am time period of the last ten Tuesdays in the 9 am, 1h period
Notes:
- rVol does not add current candle volume into lookback sum. So, you set lookback to be: (not including the current day)
- rVol is on a switch. So, if you want to see rVol instead of volume, hit the switch in the settings
- If you want to see both, load 2 instances of the indicator.
////// Better-er Volume //////
Goal:
To Identify:
- When a candle closes at the highest volume * range relative to the lookback period and close > open
- When a candle closes at the highest volume * range relative to the lookback period and close < open
- When a candle closes at the highest volume / price relative to the lookback period
Edge:
- Identifies beginnings of price expansion, climax of price expansion, breakouts, pivots, and take profit points on the volume chart
Notes:
- Based generally on Barry Taylor's "Better Volume" indicator and ideas from Pascal Willain's book "Value in Time."
- Better-er Volume rules are applied to both Total Volume or rVol.
-- When rVol is displayed Better-er Volume is applied to rVol
-- When Total Volume is displayed Better-er Volume is applied to Total Volume
// Plot Key: //
Green Triangle Up = Often marks the beginning and/or end of price expansion to the upside
Red Triangle Up = Often marks the beginning and/or end of price expansion to the downside
Yellow Square = High Volume but Tight Range. Implies a Battle of Bulls and Bears. High Liquidity area. Provided Liquidity is not enough to move price. Thick Limit Order Book.
Purple Triangle Up or Down = Implies high market participation. Typically at the end of expansion when very significant s/r is hit
category: volume Volatility
tags: Volume rVol relativevolume Bitcoin cryptocurrency bettervolume
Many More Volume Indicators Coming Out Soon!

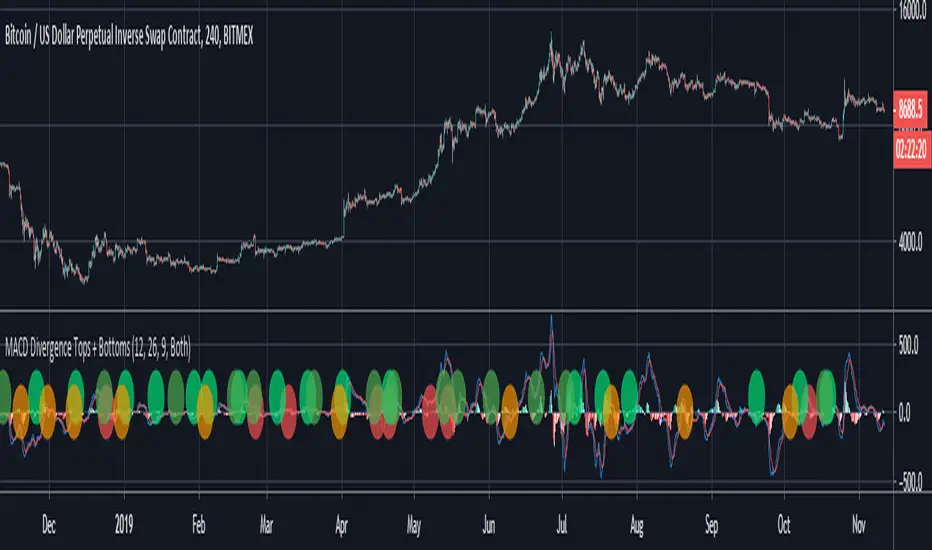
MACD Divergence Tops + BottomsMACD Indicator which plots local peaks and troughs in divergence.
"Classic" Divergence is specified as:
- A higher price, with reduced MACD high --> Potential Sell Point
- A lower price, with higher MACD low --> Potential Buy Point
"Alternative" Divergence is specified as:
- A higher MACD high, with reduced price --> Potential Sell Point
- A lower MACD low, with higher price --> Potential Buy Point
MACD Divergence should be used in combination with other indicators. This indicator identifies local tops and bottoms, with potential for macro trend shifts.
BitMex Liquidation & Bankruptcy PlotsThis script was created for the Bull Bear Bots community to help users manage their risk with respect to avoiding the dreaded liquidation emails from BitMex.
Colour legend:
Dark Green - Liquidation point for Longs
Light Green - Bankruptcy point for Longs
Dark Red - Liquidation point for Shorts
Light Red - Bankruptcy point for Shorts
Disclaimer:
As BitMex do not publish the exact calculations for liquidation, this should be used as an approximation only as the results are slightly offset to what the official calculator provides. This issue is not unique to this script and if you cross-check all the other online calculators with the official one, you will find the same issue.

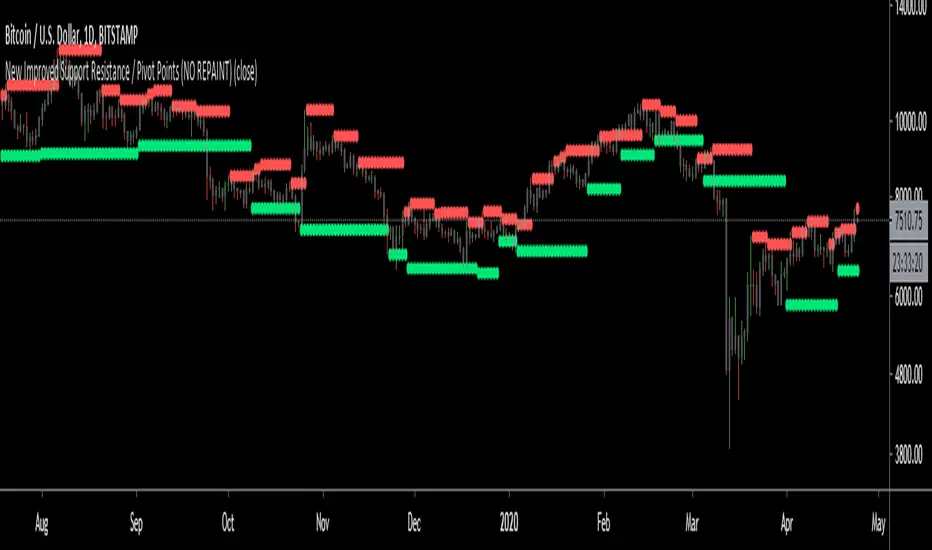
New Improved Support Resistance / Pivot Points (NO REPAINT)This indicator plots local pivot points / support resistance levels in real time (No Repaint). I created this indicator based on my own research and testing (i.e. it is not just a a Pinescript adaptation of some other indicator available online).
The Problem with Similar Indicators Which Are Currently Available On TradingView:
Inaccurate placement of swing/pivot/SR points (making your screen cluttered with meaningless levels).
Repainting (meaning the historical values change as new data becomes available; this is misleading and not very useful when trading in real time).
Have a long delay before confirming/plotting the new pivot points (20/20 hindsight...).
Require you to specify a lookback period and simply looks for the highest or lowest value over that time frame (which isn't very useful since it disregards all of the swings in between).
Do not show all of the historical swing levels, only the most recent ones.
My Solution:
Accurately places swing/pivot/SR points on local highs and lows once a short term trend is over (allowing you to easily identify reversal points).
Does not repaint (the historic values shown are exactly what would have been seen upon the close of the given candles in live trading; this means you can use this indicator for live trading).
Has minimal lag. New swing lows/highs are typically identified by this indicator on the candle which immediately following the swing point (this allows for better entries/exits rather than waiting for the price to run too far in the wrong direction before confirmation).
No lookback period required. The indicator will automatically identify new swings regardless how long the run lasts.
Allows you to adjust for more/less sensitivity.
P.S.: Future developments will be using these levels to create an automatic plot of fibonacci retracement levels.
QuantNomad - Significant Pivot Reversal Strategy AlertsAlerts for "Significant Pivot Reversal Strategy":
As one of the ways to filter out insignificant levels I decided to check that pivot point is not above/below neighbors, but check that it's above/below at least by a certain amount.
I use ATR, so in params, you can set length of ATR and also ATR multiplier. The new level will be calculated only if PP will be above/below neighbors by atr * atr_mult.
It seems this approach might help in some cases.

Bitcoin Difficulty RibbonThe Diffiulty Ribbon speaks to the impact of miner selling pressure on Bitcoin`s price action. When network difficulty reduces its rate of climb, miners are going out of business, leaving only the strong miners who proportionally need to sell less of their coins to remain operational, this leads to less sell pressure and more room for bullish price action. The best times to buy Bitcoin are zones where the ribbon compresses. The ribbon consists of simple moving averages of Bitcoin network difficulty so the rate of change of difficulty can be easily seen.
The author of this indicator is Willy Woo (@woonomic).

NixTrading Margin ZonesCreated by Super55
This one is the most accurate and precise margin zones indicator available. It is fine-tuned for bitcoin trading, but can also be used for all popular assets (XAUUSD , EURUSD , Oil etc.) that have futures traded on Chicago Mercantile Exchange (CME). Margin requirements data for each market is taken from the CME, then a key price for each specific time period is determined. The result is a set of reliable support and resistance zones that are best used for intraday trading. The data should be checked and updated daily.
This is a private, "invite only" indicator. I don't sell nor promote it.
__
For Russian-speaking followers: Предыдущая версия была заблокирована из-за большого количества русских слов. Буду краток: это лучший индикатор маржинальных зон на сегодня. Коэффициенты зон, которые мы используем на биткойне, имеют множитель x2 по сравнению со стандартным процентным обозначением (+50 = +25%). Доступ только для членов нашего сообщества.

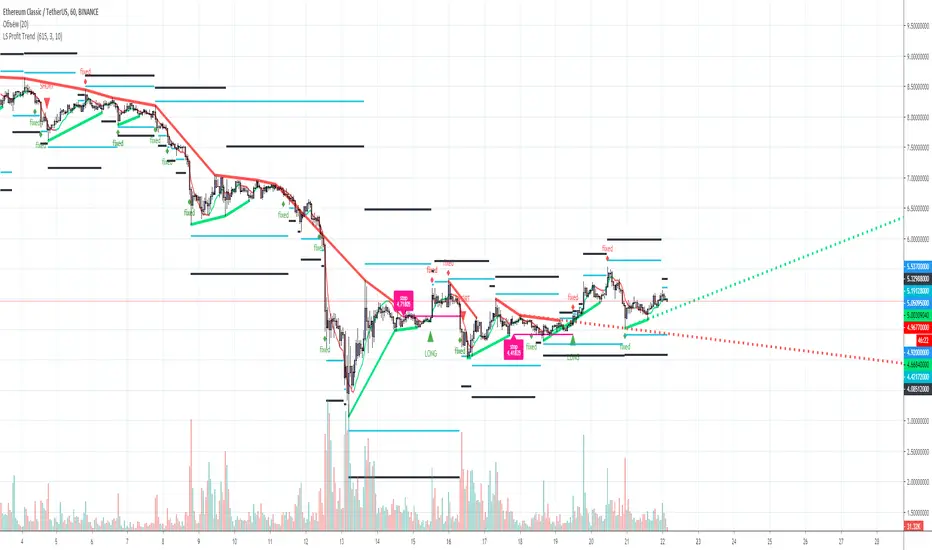
L&S PROFIT SCALP Indicator for scalp trades for TF 1-15 minutes. 1-4 signals per day depending on the currency pair. Suitable for all crypto exchanges, Forex, binary options. Signals+ take profit Levels.

L&S PROFIT TREND Trend indicator for TF from 1 hour and above, for any trading pair, any exchange, binary options. Signals+ Take profit levels. 90% good signal and take profit 1.
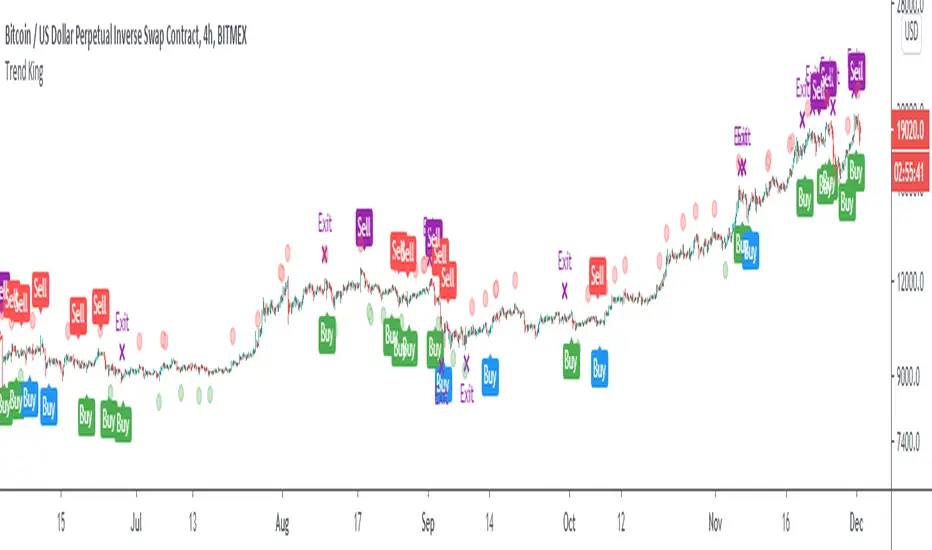
Trend KingIntroducing “Trend King”.
The alpha generating strategy built for Crypto.
“Trend King” combines 4 proprietary indicators. It buys and sells based on:
Short-term momentum
Long-term momentum
Volume compression
Volatility breakouts
The strategy was built on 2 years of BitMEX data (XBTUSD) and backtested on 9 years of Bitcoin data (BLX). Finally, the strategy was validated on multiple large market cap cryptocurrencies, including Ethereum (ETHUSD), without parameter adjustment.
Strategy backtesting checks include:
Used 0.12% fees. 60% more than the actual BitMex/Binance fees of 0.075%.
No Heikin-Ashi Candles (to avoid fake results)
No Stop-losses (to avoid fake order execution)
Market Orders Only (to avoid fake order execution)
The results speak for them self.
See the positive excess return from the “Trend King” strategy returns versus a simple Bitcoin “Buy-and-Hold” strategy. Best functionality on the Daily and 4HR timeframes.
**For Access: Contact me on TradingView or Twitter.
Altsignals-Indicator SLIM+ (lifetime)The Altsignals indicator combines various indicators together in an effort to predict accurate and non-bias money making signals. Altsignals Indicator takes out the contradiction so you don’t have to deal with the headaches when you decide to long or short.
There are institutions, whales, and algorithmic bots everywhere in this market, there’s no doubt you’re at a disadvantage. Altsignals Indicator is the secret weapon you need to give you an edge to win in this market.
All-in-one indicator
Supports all trading pairs
Enable Signal Notifications
Fair one-time fee
Risk management features
Works on all markets and all timeframes
Perfect for beginners and people with day-jobs
Common sense required while using this indicator.
Are you experiencing paralysis from analysis? Do you feel like some indicators contradict each other? Don’t know if its worth the risk? If you’re fairly new to trading, then this product is the right fit for you!
Altsignals Indicator is here replace traditional indicators, it does exactly the opposite of all the questions above, telling you exactly when to buy and when to sell, thus giving you the assurance you need to improve your odds of trading.
It takes all aspects into consideration, it utilises multiple indicators such as Divergences, Elliott Waves , Ichimoku , MACD , MACD Histogram, RSI , Stoch , CCI , Momentum, OBV, DIOSC, VWMACD, CMF and multiple EMAs before making a decision.
Simply choose a Power level, set your Take profits and Stop Loss and enjoy trading.

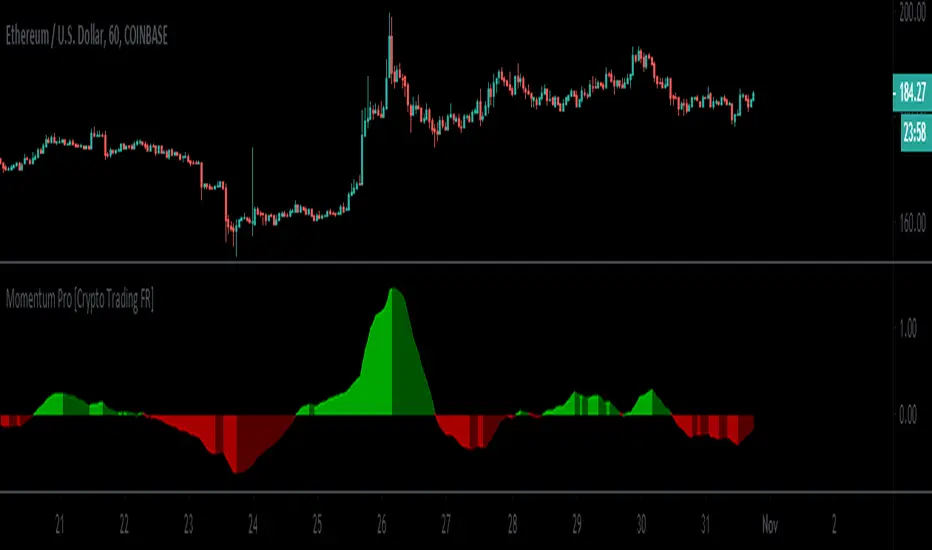
Momentum Pro [Crypto Trading FR]Momentum Pro is a script geared toward identifying price trends.
It is calculated to best fits the set of data being analyzed whatever the timeframe used.
Trend Pulse Pro V2Trend Pulse Pro V2 (Non Repaint)
TradingView Account Needed: Free
You don't need to be an expert to use Trend Pulse Pro.
Just follow the signals and that's all and use simple Fibonacci levels to find stop loss and take profit!
You can increase the win rate even more by following some simple technical analysis, for example, when trend breaks (price break signal level) you can use that as support become resistance level (sell) or resistance becomes support (buy):
No complex things. No waste of time.
And although you won't win 100% of the trades (no signals can guarantee that), your trading will surely improve a lot!
Even someone with almost no trading experience can read the simple trading rules given in the included user guide, watch the how-to videos and follow Trend Pulse Pro’s signals to consistently make smarter trades.
With Trend Pulse Pro you will get accurate buy and sell signals every time there is a new trading opportunity so that you never miss any big price movements and makes your trading both easier and more profitable.
How to use the signals and alerts:
Trend Pulse Pro automatically analyze trend and price action to give you a signal when there's a good trade.
These trend signals and alerts are derived from live data but the stability of our code allows it to not repaint.
Trend Pulse Pro allow you to easily determine the trend and will give you buy and sell entry levels.
Works on all markets on all time frames so it's suitable for scalpers, day and swing traders.
If you want more details, the link is in the signature.
Disclaimer:
Past performance is not indicative of future performance. No representation is being made that any results discussed within the service and its related media content will be achieved. All opinions, news, research, analyses, prices or other information is provided as general market commentary and not as investment advice. TradingWalk, their members, shareholders, employees, agents, representatives and resellers do not warrant the completeness, accuracy or timeliness of the information supplied, and they shall not be liable for any loss or damages, consequential or otherwise, which may arise from the use or reliance of the TradingWalk service and its content. © 2019 TradingWalk.
TradingWalk indicators are built for TradingView. TradingWalk is on no way a part of TradingView.

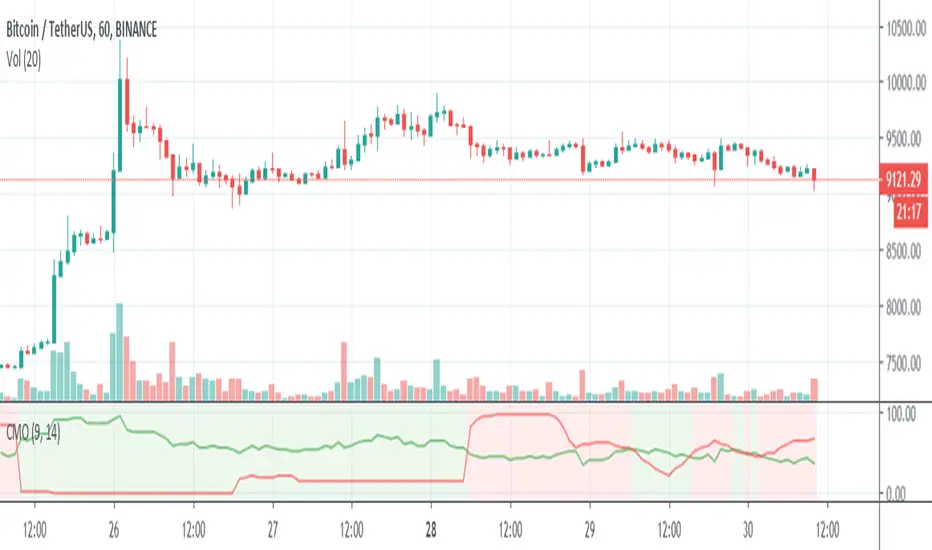
CMOCMO is reading the values of price movements.
Long ==> the green line is over the red one OR the background is green
short ==> the red line is over the green one OR the background is red
POVPOV is the Power of Volume so it gives the status of volume if buying or selling
Long ==> The teal line is over the orange one.
short ==> The orange line is over the teal one.

The Extensive IndicatorThe extensive Indicator reads many kinds of signals and price movements.
Basically,
Long ==> Plus symbol (+) is green and at least 2 other symbols are green ### stop loss when plus symbol is red and any 2 other symbols are red.
Short ==> Plus symbol (+) is red and at least 2 other symbols are red ### stop loss when plus symbol is green and any 2 other symbols are green.

AOOAOO is just working with volume so it's perfect for cryptocurrency and refers if the people are buying or selling.
Long ==> background is green
short ==> background is red

AMAAMA is a mixed indicator that includes exponential moving average and support and resistance levels by each candle and gives you the best value to go long or short.
it reads the volume as well which you could see it on the background color.
once the price closed over the green line then you can make a long order (buy) and the stop loss if the price closed under the red line, and vice versa.
the black line is just to make it as additional support and resistance level
Long ==> price closed over black and green lines ### stop loss if price closed under the black and red lines
short ==> price closed under black and red lines ### stop loess if price closed over the black and green lines.
Background refers to the volume movements so if it's green means people are buying and if red means selling.
I attached EMA and special moving average indicator so you can make them as support and resistance levels once you see price is closing to one of them.
