Stochastic Bollinger BandsThis indicator started off as a bit of an experiment, but it ended up looking quite useful.
It plots closing price (which can be changed) in relation to the bollinger bands upper and lower bands. This relationship is then run through a Stochastic function much like RSI is with StochasticRSI.
This plot line is smoothed with the K Smoothing value in the settings, and then this plot line is smoothed again with he D Smoothing value to give a signal line.
When the plot lines are outside the horizontal upper and lower limit lines, then this indicates that price is outside the bollinger bands. This can indicate entry and exit signals.
In the background, there is an area plotting a stochastic version of the Bollinger Band width. This would show periods of high and low volatility as it relates to previous volatility.
The stochastic length for the width is set to be very long (144 periods) in order to encapsulate a long range of values to compare to.
Default Settings:
==============
Source: The data point in which to compare to the upper and lower Bollinger Bands - set to close.
BB Length: The length in periods to generate the moving average used for the bands - set at 20 periods.
Mult: This is the multiplier used in the calculations for the bands - set at 2.
BB Width Stochastic Length: This is how far back it looks to compare the current width of the bands to previous widths - set at 144 periods..
BB Stochastic Length: This is how far back to compare closing price in relation to the bands - set at 14 periods..
K Smoothing: This is used to smooth the Stochastic Bollinger band value - set at 3 periods.
D Smoothing: This is a moving average of the smoothed K value in order to provide a signal line - set at 3 periods..
Moving Average Type: This allows you to use either a Simple moving average or an Exponential moving average - set for SMA.
------------------------------------------------------------------------------------------------
Kindest Regards
Created 2018 - by @Squiggles#8806
LTC Tip Jar: LX4bUBdjiRPsagUbZoAczSGgDC4YqTJL7w
Profit Trailer Feeder affiliate link: cryptoprofitbot.com
Bollinger Bands Width (BBW)

MACD+BB (SH v1.1)Twitter: @DrSHelmet. All credit and thanks to @cryptobiasfunke for this strategy.
Disclaimer: I take no responsibility for your usage of this indicator.
Description:
Indicator version: 1.1
This custom script plots the MACD histogram, applies Bollinger bands to the histogram, and then colours the Bollinger bands in different colours depending on whether the bands are contracting or expanding.
Suggested strategy:
Periods of low volatility, seen in a Bollinger band pinch, are followed by large moves (BB expansion). A contraction of the MACD BB may similarly precede a significant move in price. This indicator allows you to see when such a move may be starting, by watching for colour change (default: blue-->orange) on the BB lines after a BB pinch has occured. If the MACD histogram is increasing in magnitude and surfing the BB in a certain direction, this suggests a price move is starting in the direction of the histogram.
Intended for short-timeframe scalping (<1hr charts), but initial testing suggests some validity on higher timeframes.

Bollinger Bear Sniper/StudyThis is a simple study with buys and sells alerts. This study uses Bollinger Bands to identify strong candles, buys in the middle of candle and sells on the close of candle without holding any position longer than the period of the candle. This is for those who want to make small profit or loss and move on rather than hodling in down trend market. With this approach, bags and hodling are avoided. You either gain on each candle or lose. When your gains are more than your loses then you are in good business.
Since buys are made on candles that have shown strong upward movement and sells on the close of the same candle, loses or completely minimized. This ensures that higher percentage of the transactions result in profit. This works best when use on 30 minutes or above candles.
Use it at your own risk we are NOT responsible.

Bollinger Bear SniperThis script uses Bollinger Band but with different interpretation. The upper Bollinger Band is the resistant level, the lower Bollinger Band is the base or support level. The Commodity Channel Index (CCI) and the Bollinger Bandwidth helps us avoid high risk.
The script identifies candles that are marking bold upward moves in prices and fires buy signal. Sales signals are fired when the candle closes in positive. The idea is to buy and sell on the same candle or next positively closed candle. This is anti-bear-anti-bags strategy. You either make profit or loss holding no bag. When you gain more than lose you are in business. This script is set to gain more than lose. We however offer no guarantee, expressed or implied. We are NOT responsible.
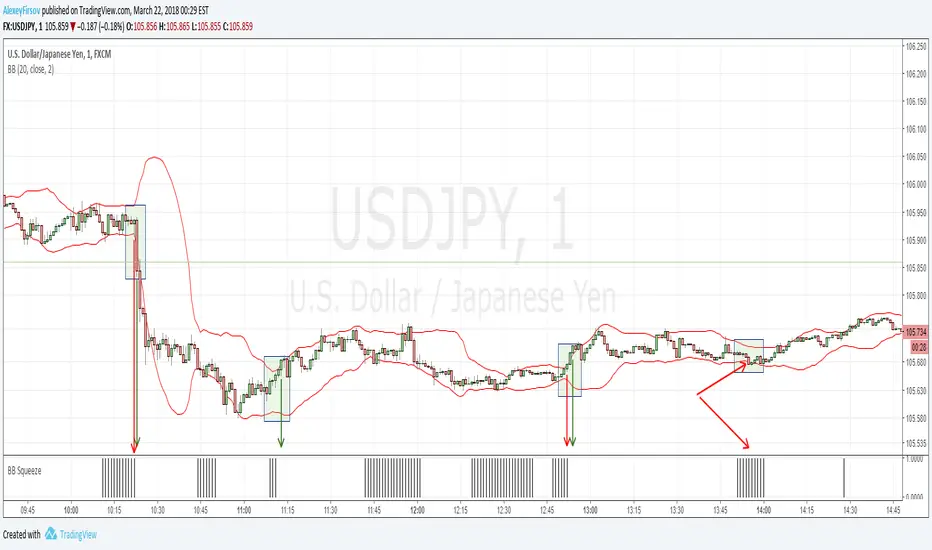
Bollinger Bands SqueezeEnglish:
Simple histogram, showing Squeeze of Bollinger Bands.
Usage is simple - when price is in Squeeze, no entries in any direction. For using with Bollinger Bands indicator, including binary options.
Russian
Простой индикатор, наглядной отображающий стадию Сжатия лент Боллинджера.
Простой в использовании - когда цена в Сжатии - не входим в сделку. Особенно эффективен при связке с индикатором лент Боллинджера и входе в сделку при раскрытии лент. Также применим для бинарных опционов
Example/Пример
Chauvenet RadiusThe Chauvenet criterion is a well-known criterion of selection and rejection of the data used by the Physics. It establishes that in an experiment is well to discard the data whose distance from the average is greater than a certain number of the delta.
In the stock market if prices move away from the average with a volatility too high are suspect. This principle is embodied in the Chauvenet floor with the definition of two asymptotes and two data areas rejection.
The Chauvenet Radius is the quadratic sum of the delta (distance from average) and sigmoid (volatility) and is therefore an obvious market stability index. In fact the moments when price strongly moves away from the average with high volatility coincide with the moments of high instability of the market.
It can be considered an evolution of John Bollinger method introduced during the '80.
Source: www.performancetrading.it