Volume TI65**TI65 (Trend Intensity 65)** is a technical indicator designed to measure the strength and momentum of a trend over two distinct periods. It compares a short-term 7-period simple moving average (SMA) with a long-term 65-period SMA, producing a ratio that helps traders identify shifts in market momentum and trend direction.
- When the **TI65 value is greater than 1**, it indicates that the short-term moving average is above the long-term average, suggesting increasing momentum and a potentially bullish trend.
- When the **TI65 value drops below 1**, it signals weakening short-term momentum relative to the longer-term trend, often interpreted as a bearish or consolidating phase.
This indicator can be applied to both price and volume data, making it useful for identifying periods of strong volume surges or price movements. By observing changes in the TI65 ratio, traders can pinpoint low-risk entry points for trend-following strategies and quickly recognize periods of market transition.
TI65 is commonly used by momentum and breakout traders for screening strong candidates and confirming the sustainability of ongoing trends. It is simple, effective, and easily implemented via custom scripts on popular platforms like TradingView.
Breadth Indicators

8 Médias Exponenciais (Config.)This indicator provides a highly flexible system of eight fully customizable moving averages (MAs), allowing traders to visualize short-, medium-, and long-term market trends with precision and adaptability. Each of the eight moving averages can be independently configured by the user, both in period length and type — supporting either Simple Moving Average (SMA) or Exponential Moving Average (EMA).

st 47Усредненный Ишимоку (Custom: 9/48/96) [V6]st47 — Volume in Clouds
This indicator is a custom Ichimoku Cloud modification that dynamically reacts to market volume.
The color intensity of the Kumo (cloud) changes depending on the current trading volume — brighter clouds indicate stronger activity, while dimmer ones reflect low participation.
Key Features:
• Based on the Ichimoku Cloud system (8/48/96 settings)
• Volume-sensitive cloud visualization
• Works on any timeframe and pair
• Supports multi-ticker averaging (BTCUSDT, BTCUSDT.P, etc.)
• Displays additional volume histogram below the chart
Purpose:
Helps visualize both trend structure and the strength behind it by combining Ichimoku logic with real-time volume dynamics.

Broad Market for Crypto + index# Broad Market Indicator for Crypto
## Overview
The Broad Market Indicator for Crypto helps traders assess the strength and divergence of individual cryptocurrency assets relative to the overall market. By comparing price deviations across multiple assets, this indicator reveals whether a specific coin is moving in sync with or diverging from the broader crypto market trend.
## How It Works
This indicator calculates percentage deviations from simple moving averages (SMA) for both individual assets and an equal-weighted market index. The core methodology:
1. **Deviation Calculation**: For each asset, the indicator measures how far the current price has moved from its SMA over a specified lookback period (default: 24 hours). The deviation is expressed as a percentage: `(Current Price - SMA) / SMA × 100`
2. **Market Index Construction**: An equal-weighted index is built from selected cryptocurrencies (up to 15 assets). The default composition includes major crypto assets: BTC, ETH, BNB, SOL, XRP, ADA, AVAX, LINK, DOGE, and TRX.
3. **Comparative Analysis**: The indicator displays both the current instrument's deviation and the market index deviation on the same panel, making it easy to spot relative strength or weakness.
## Key Features
- **Customizable Asset Selection**: Choose up to 15 different cryptocurrencies to include in your market index
- **Flexible Configuration**: Toggle individual assets on/off for display and index calculation
- **Current Instrument Tracking**: Automatically plots the deviation of whatever chart you're viewing
- **Visual Clarity**: Color-coded lines for easy differentiation between assets, with the market index shown as a filled area
- **Adjustable Lookback Period**: Modify the SMA period to match your trading timeframe
## How to Use
### Identifying Market Divergences
- When the current instrument deviates significantly above the index, it shows relative strength
- When it deviates below, it indicates relative weakness
- Assets clustering around zero suggest neutral market conditions
### Trend Confirmation
- If both the index and your asset are rising together (positive deviation), it confirms a broad market uptrend
- Divergence between asset and index can signal unique fundamental factors or early trend changes
### Entry/Exit Signals
- Extreme deviations from the index may indicate overbought/oversold conditions relative to the market
- Convergence back toward the index line can signal mean reversion opportunities
## Settings
- **Lookback Period**: Adjust the SMA calculation period (default: 24 hours)
- **Asset Configuration**: Select which cryptocurrencies to monitor and include in the index
- **Display Options**: Show/hide individual assets, current instrument, and market index
- **Color Customization**: Personalize colors for better visual analysis
## Best Practices
- Use on higher timeframes (4H, Daily) for more reliable signals
- Combine with volume analysis for confirmation
- Consider fundamental news when assets show extreme divergence
- Adjust the asset basket to match your trading focus (DeFi, L1s, memecoins, etc.)
## Technical Notes
- The indicator uses `request.security()` to fetch data from multiple symbols
- Deviations are calculated independently for each asset
- The zero line represents perfect alignment with the moving average
- Index calculation automatically adjusts based on active assets
## Default Assets
1. BTC (Bitcoin) - BINANCE:BTCUSDT
2. ETH (Ethereum) - BINANCE:ETHUSDT
3. BNB (Binance Coin) - BINANCE:BNBUSDT
4. SOL (Solana) - BINANCE:SOLUSDT
5. XRP (Ripple) - BINANCE:XRPUSDT
6. ADA (Cardano) - BINANCE:ADAUSDT
7. AVAX (Avalanche) - BINANCE:AVAXUSDT
8. LINK (Chainlink) - BINANCE:LINKUSDT
9. DOGE (Dogecoin) - BINANCE:DOGEUSDT
10. TRX (Tron) - BINANCE:TRXUSDT
Additional slots (11-15) are available for custom asset selection.
---
This indicator is particularly useful for cryptocurrency traders seeking to understand market breadth and identify opportunities where specific assets are diverging from overall market sentiment.

Crypto Index Price# Crypto Index Price - Indicator Description
## 📊 What is this indicator?
**Crypto Index Price** is an indicator for creating your own cryptocurrency index based on an equal-weighted portfolio. It allows you to track the overall dynamics of the cryptocurrency market through a composite index of selected assets.
## 🎯 Key Features
- **Up to 20 assets in the index** — create an index from any trading pairs
- **Equal-weighted methodology** — each asset has the same weight in the index
- **Moving average** — optional trend filter for the index
- **Flexible visualization settings** — customizable colors and line thickness
## 📈 How to Use
The indicator is displayed in a separate pane below the chart and shows:
1. **Blue line** — crypto index value
2. **Orange line** (optional) — moving average of the index
### Trading Applications:
- **Identify overall market trend** — if the index is rising, most coins are in an uptrend
- **Divergences** — divergence between your asset and the index may signal local opportunities
- **Signal confirmation** — use the index to confirm trading decisions on individual coins
- **Market condition filter** — trade longs when index is above MA, shorts when below
## ⚙️ Settings
### Assets (Symbols)
- **Asset 1-10** — main cryptocurrencies (default: BTC, ETH, BNB, SOL, XRP, ADA, AVAX, LINK, DOGE, TRX)
- **Asset 11-20** — additional slots for index expansion
### Visual Parameters
- **Index line color** — main line color (default: blue)
- **Line width** — from 1 to 5 pixels
- **Show moving average** — enable/disable MA
- **MA period** — moving average calculation period (default: 20)
- **MA color** — moving average line color (default: orange)
## 💡 Recommendations
- For a top coins index, use 5-10 largest cryptocurrencies by market cap
- For an altcoin index, add medium and small coins from your sector
- Use MA to filter false signals and identify the global trend
- Compare individual asset behavior with the index to find anomalies
## ⚠️ Important
The indicator uses equal-weighted methodology — each coin contributes equally regardless of price or market cap. This differs from cap-weighted indices and may provide a different market perspective.
---
*This indicator is intended for analysis and is not trading advice. Always conduct your own analysis before making trading decisions.*
---

MACD with Smart Entry Signals & Trend Filter
This advanced MACD indicator combines traditional MACD analysis with intelligent entry signal detection and an optional EMA trend filter. It identifies high-probability entry points by analyzing histogram patterns, consolidation phases, and trend continuation setups.
### Key Features
**🎯 Smart Entry Detection**
- **Consolidation Breakouts**: Identifies exits from consolidation zones (weak bars) with strong momentum
- **Trend Reversals**: Detects potential trend changes after extended weak phases
- **Correction/Continuation Patterns**: Recognizes brief corrections within strong trends that offer continuation opportunities
**📊 Enhanced MACD Visualization**
- Color-coded histogram showing four distinct states:
- Strong Bullish (dark green): Rising histogram above zero
- Weak Bullish (light green): Falling histogram above zero
- Weak Bearish (light red): Rising histogram below zero
- Strong Bearish (dark red): Falling histogram below zero
**🔍 Multi-Layer Filtering System**
- **Candle Size Filter**: Eliminates signals during high volatility/large candle ranges
- **EMA Trend Filter**: Optional filter ensuring entries align with the dominant trend direction
- Visual markers for rejected signals (orange X for candle size, blue E for EMA trend)
**⚙️ Customizable Parameters**
- Adjustable MACD periods (default: 34/144/9)
- Configurable consolidation bar requirements
- Flexible correction pattern detection
- EMA trend filter with adjustable sensitivity
- Multiple alert types for all signal conditions
### How to Use
1. **Enable/disable filters** based on your trading style and market conditions
2. **Green triangles (L)**: Long entry signals when all conditions are met
3. **Red triangles (S)**: Short entry signals when all conditions are met
4. **Rejected signal markers**: Help you understand why certain setups were filtered out
5. **Background coloring**: Provides visual confirmation of signal zones and correction patterns
### Alert System
Comprehensive alerts for:
- Long and short entry signals
- Specific pattern types (consolidation, reversal, continuation)
- Rejected signals (helps refine strategy)
- Traditional MACD histogram crossovers
### Best Practices
- Use the EMA trend filter in trending markets to avoid counter-trend trades
- Adjust candle size filter based on your instrument's typical volatility
- Consider combining with support/resistance levels for confirmation
- Test different consolidation bar settings for your timeframe
### Parameters Summary
- Fast/Slow Length: MACD calculation periods
- Signal Smoothing: Signal line period
- Consolidation Bars: Minimum weak bars before breakout
- Max Candle Range: Filter for oversized candles
- EMA Period & Sensitivity: Trend filter configuration
---
*This indicator is designed for traders who want a systematic approach to identifying MACD-based entry opportunities with built-in risk management through filtering.*

BTC LL->HH Liquidity Sweep / BOS / Retest / 4H Bias v6_8BTC LL->HH Liquidity Sweep / BOS / Retest / 4H Bias v6_8


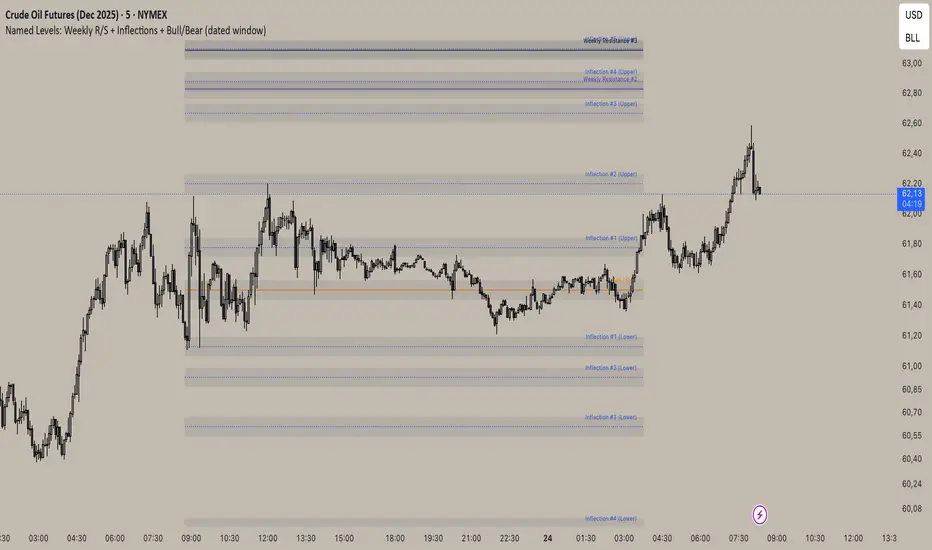
Inflection/ Bull Bear/ Weekly R&S VisualizerDisplay: Weekly Support/ Resistance, Inflection Levels, Bullbear
Adjust: Line Color, strength, style, opacity
Add: Zone around Inflection Level
Complete Indicator Analysis By: arisutikno📊 3 MAIN COMPONENTS
1. EMA (Exponential Moving Average)
Function: Detect price trends and momentum
Periods: 8, 21, 50, 100, 200 + SMA 200
Purpose:
EMA 8-21: Short-term trend
EMA 50-100: Medium-term trend
EMA 200: Long-term trend
2. FIBONACCI RETRACEMENT & EXTENSION
Function: Identify support/resistance levels and profit targets
Retracement Levels: 0.5, 0.618, 0.786 (pullback areas)
Extension Levels: 1.272, 1.618, 2.0 (profit targets)
Purpose: Determine trading entry and exit points
3. DYNAMIC SUPPORT & RESISTANCE
Function: Detect important price levels
Based on: High/Low within specific period
Purpose: Identify potential price reversal areas
⚙️ ADDITIONAL FEATURES
Individual Toggles: Enable/disable each component
Color Customization: Adjust colors according to preference
Clean Visualization: Neat lines and labels, no clutter
Advanced Multi-Timeframe Trend & Signal System═══════════════════════════════════════════════════════════════
ADVANCED MULTI-TIMEFRAME TREND & SIGNAL SYSTEM v1.0
═══════════════════════════════════════════════════════════════
Created by: Zakaria Safri
License: Mozilla Public License 2.0
A comprehensive technical analysis tool designed for traders seeking
multi-dimensional market insights. This indicator combines proven
technical analysis methods with modern visualization techniques.
═══════════════════════════════════════════════════════════════
KEY FEATURES
═══════════════════════════════════════════════════════════════
✓ SUPERTREND SIGNAL GENERATION
- Customizable sensitivity settings
- Clear long/short entry signals
- Automatic trend direction detection
- ATR-based dynamic calculations
✓ MULTI-TIMEFRAME DASHBOARD
- Real-time trend analysis across 6 timeframes
- Synchronized trend confirmation
- Customizable table position and size
- Current: 1M, 5M, 15M, 1H, 1D coverage
✓ QQE REVERSAL DETECTION
- Quantitative Qualitative Estimation algorithm
- Early reversal signal identification
- Adjustable RSI and smoothing parameters
- Confirmation-based plotting
✓ DYNAMIC SUPPORT & RESISTANCE
- Pivot-based level calculation
- Quick and standard pivot detection
- Color-coded zones (8 levels)
- Automatic level updates
✓ MOMENTUM BREAKOUT SIGNALS
- Ichimoku-inspired calculations
- Bullish and bearish breakout detection
- Visual zone highlighting
- Trend confirmation filters
✓ RISK MANAGEMENT SYSTEM
- ATR-based stop loss calculation
- Multiple take profit targets (TP1, TP2, TP3)
- Customizable risk-to-reward ratios
- Dynamic price level tracking
- Hit detection markers
✓ VOLATILITY BANDS
- Keltner Channel implementation
- Multiple band layers (3 levels)
- EMA-based calculations
- Adaptive to market conditions
✓ TREND CLOUD VISUALIZATION
- Dual moving average cloud
- Clear trend direction indication
- Customizable color scheme
- Trend bar coloring
═══════════════════════════════════════════════════════════════
HOW TO USE
═══════════════════════════════════════════════════════════════
SETUP:
1. Add indicator to your chart
2. Configure sensitivity in Core Signals section
3. Enable desired features (signals, reversals, breakouts)
4. Set up risk management levels if trading
5. Position MTF dashboard to preference
SIGNAL INTERPRETATION:
• LONG Signal: Price crosses above Supertrend
• SHORT Signal: Price crosses below Supertrend
• REV (Reversal): QQE indicates potential trend change
• Diamond Breakouts: Momentum shift confirmation
• T1/T2/T3: Take profit level hits
MULTI-TIMEFRAME ANALYSIS:
• Green (BULL): Higher timeframe supports uptrend
• Red (BEAR): Higher timeframe supports downtrend
• Use for trend alignment and confirmation
• Best results when multiple timeframes align
RISK MANAGEMENT:
• Enable Stop Loss for automatic SL calculation
• Activate TP levels based on trading style
• Adjust Risk-to-Reward ratio (1:1 to 1:10)
• Monitor hit detection circles for exits
═══════════════════════════════════════════════════════════════
TECHNICAL SPECIFICATIONS
═══════════════════════════════════════════════════════════════
CALCULATIONS:
• Supertrend: ATR-based with customizable multiplier
• QQE: Modified RSI with Wilders smoothing
• Keltner Channels: EMA basis with ATR bands
• Pivots: Standard left/right bar methodology
• Support/Resistance: Multi-level pivot analysis
PARAMETERS:
• Supertrend Sensitivity: 0.5 to 10.0 (default: 2.0)
• RSI Period: 5 to 50 (default: 14)
• QQE Multiplier: 1.0 to 10.0 (default: 4.238)
• Risk-to-Reward: 1 to 10 (default: 4)
TIMEFRAMES:
Compatible with all timeframes. MTF dashboard displays:
• 1 Minute (1M)
• 5 Minutes (5M)
• 15 Minutes (15M)
• 1 Hour (1H)
• 1 Day (1D)
• Current chart timeframe
═══════════════════════════════════════════════════════════════
CUSTOMIZATION OPTIONS
═══════════════════════════════════════════════════════════════
VISUAL:
• Professional color scheme (Cyan/Orange)
• Adjustable table position (9 positions)
• Table size options (tiny/small/normal/large)
• Transparent zone highlighting
• Clean, modern label design
TOGGLES:
• Enable/disable any feature independently
• Show/hide signals, reversals, breakouts
• Toggle S/R levels and zones
• Control trend cloud and bands
• Master trend line optional
ALERTS:
The indicator provides visual signals that can be used with
TradingView's alert system by setting alerts on the indicator.
═══════════════════════════════════════════════════════════════
BEST PRACTICES
═══════════════════════════════════════════════════════════════
✓ Combine signals for higher probability setups
✓ Use MTF dashboard for trend confirmation
✓ Respect S/R levels for entry/exit planning
✓ Monitor QQE reversals at key price levels
✓ Adjust sensitivity based on asset volatility
✓ Test on demo/paper trading first
✓ Use proper risk management always
═══════════════════════════════════════════════════════════════
IMPORTANT DISCLAIMER
═══════════════════════════════════════════════════════════════
This indicator is a technical analysis tool and does NOT:
• Guarantee profitable trades
• Provide financial advice
• Predict future price movements with certainty
• Replace proper risk management
• Substitute for personal due diligence
Past performance does not indicate future results. All trading
involves risk. Users should:
- Understand the indicator's logic
- Test thoroughly before live trading
- Use appropriate position sizing
- Never risk more than they can afford to lose
- Consult financial advisors if needed
═══════════════════════════════════════════════════════════════
CODING STANDARDS
═══════════════════════════════════════════════════════════════
This indicator follows PineCoders Coding Conventions:
✓ Proper variable naming (prefixes: i_, f_, c_)
✓ Clear function documentation
✓ Organized code structure
✓ Type declarations
✓ Efficient calculations
✓ No repainting (confirmed signals)
✓ Proper use of request.security
═══════════════════════════════════════════════════════════════
SUPPORT & UPDATES
═══════════════════════════════════════════════════════════════
Version: 1.0
Author: Zakaria Safri
License: MPL 2.0
Last Updated: 2024
For questions, feedback, or suggestions, please comment below.
═══════════════════════════════════════════════════════════════
#trading #signals #supertrend #multiTimeframe #QQE #reversals
#supportResistance #riskManagement #trendAnalysis #momentum

ADR Color CodedAbove 1 is green, below 1 is red.
Color coded to provide better visibilty when identifying divergences with volume and price

Distance % from sma/ema + Percentile BandsThis script is breadth indicator for long term bull and bear markets.
Default settings:
AU:
- 200m SMA
- Percentile Lookback: 99%
- Lookback Period: 240 M
AG: TBD
SPX: TBD
Multi-Timeframe EMA Trend Dashboard with Volume and RSI Filters═══════════════════════════════════════════════════════════
MULTI-TIMEFRAME EMA TREND DASHBOARD
═══════════════════════════════════════════════════════════
OVERVIEW
This indicator provides a comprehensive view of trend direction across multiple timeframes using the classic EMA 20/50 crossover methodology, enhanced with volume confirmation and RSI filtering. It aggregates trend information from six timeframes into a single dashboard for efficient market analysis.
The indicator is designed for educational purposes and to assist traders in identifying potential trend alignments across different time horizons.
═══════════════════════════════════════════════════════════
FEATURES
═══════════════════════════════════════════════════════════
MULTI-TIMEFRAME ANALYSIS
• Monitors 6 timeframes simultaneously: 1m, 5m, 15m, 1H, 4H, 1D
• Each timeframe analyzed independently using request.security()
• Non-repainting implementation with proper lookahead settings
• Calculates overall trend strength as percentage of bullish timeframes
EMA CROSSOVER SYSTEM
• Fast EMA (default: 20) and Slow EMA (default: 50)
• Bullish: Fast EMA > Slow EMA
• Bearish: Fast EMA < Slow EMA
• Neutral: Fast EMA = Slow EMA (rare condition)
• Visual EMA plots with optional fill area
VOLUME CONFIRMATION
• Optional volume filter for crossover signals
• Compares current volume against moving average (default: 20-period SMA)
• Categorizes volume as: High (>1.5x average), Normal (>average), Low (70), oversold (<30), and neutral zones
• Used in quality score calculation
• Optional display toggle
SUPPORT & RESISTANCE DETECTION
• Automatic detection using highest/lowest over lookback period (default: 50 bars)
• Plots resistance (red), support (green), and mid-level (gray)
• Step-line style for clear visualization
• Optional display toggle
QUALITY SCORING SYSTEM
• Rates trade setups from 1-5 stars
• Considers: MTF alignment, volume confirmation, RSI positioning
• 5 stars: 4+ timeframes aligned + volume confirmed + RSI 50-70
• 4 stars: 4+ timeframes aligned + volume confirmed
• 3 stars: 3+ timeframes aligned
• 2 stars: Exactly 3 timeframes aligned
• 1 star: Other conditions
VISUAL DASHBOARD
• Clean table display (position customizable)
• Color-coded trend indicators (green/red/yellow)
• Extended statistics panel (toggleable)
• Shows: Trends, Strength, Quality, RSI, Volume, Price Distance
═══════════════════════════════════════════════════════════
TECHNICAL SPECIFICATIONS
═══════════════════════════════════════════════════════════
CALCULATIONS
Trend Determination per Timeframe:
• request.security() fetches EMA values with gaps=off, lookahead=off
• Compares Fast EMA vs Slow EMA
• Returns: 1 (bullish), -1 (bearish), 0 (neutral)
Trend Strength:
• Counts number of bullish timeframes
• Formula: (bullish_count / 6) × 100
• Range: 0% (all bearish) to 100% (all bullish)
Price Distance from EMA:
• Formula: ((close - EMA) / EMA) × 100
• Positive: Price above EMA
• Negative: Price below EMA
• Warning when absolute distance > 5%
ANTI-REPAINTING MEASURES
• All request.security() calls use lookahead=barmerge.lookahead_off
• Dashboard updates only on barstate.islast
• Historical bars remain unchanged
• Crossover signals finalize on bar close
═══════════════════════════════════════════════════════════
USAGE GUIDE
═══════════════════════════════════════════════════════════
INTERPRETING THE DASHBOARD
Timeframe Rows:
• Each row shows individual timeframe trend status
• Look for alignment (multiple timeframes same direction)
• Higher timeframes generally more significant
Strength Indicator:
• >66.67%: Strong bullish (4+ timeframes bullish)
• 33.33-66.67%: Mixed/choppy conditions
• <33.33%: Strong bearish (4+ timeframes bearish)
Quality Score:
• Higher stars = better confluence of factors
• 5-star setups have strongest multi-factor confirmation
• Lower scores may indicate weaker or conflicting signals
SUGGESTED APPLICATIONS
Trend Confirmation:
• Check if multiple timeframes confirm current chart trend
• Higher agreement = stronger trend confidence
• Use for position sizing decisions
Entry Timing:
• Wait for EMA crossover on chart timeframe
• Confirm with higher timeframe alignment
• Volume above average preferred
• RSI not in extreme zones
Divergence Detection:
• When lower timeframes diverge from higher
• May indicate trend exhaustion or reversal
• Requires additional confirmation
CUSTOMIZATION
EMA Settings:
• Adjust Fast/Slow lengths for different sensitivities
• Shorter periods = more responsive, more signals
• Longer periods = smoother, fewer signals
• Common alternatives: 10/30, 12/26, 50/200
Volume Filter:
• Enable for higher-quality signals (fewer false positives)
• Disable in always-liquid markets or for more signals
• Adjust MA length based on typical volume patterns
Display Options:
• Toggle EMAs, S/R levels, extended stats as needed
• Choose dashboard position to avoid chart overlap
• Adjust colors for visibility preferences
═══════════════════════════════════════════════════════════
ALERTS
═══════════════════════════════════════════════════════════
AVAILABLE ALERT CONDITIONS
1. Bullish EMA Cross (Volume Confirmed)
2. Bearish EMA Cross (Volume Confirmed)
3. Strong Bullish Alignment (4+ timeframes)
4. Strong Bearish Alignment (4+ timeframes)
5. Trend Strength Increasing (>16.67% jump)
6. Trend Strength Decreasing (>16.67% drop)
7. Excellent Trade Setup (5-star rating)
Alert messages use standard placeholders:
• {{ticker}} - Symbol name
• {{close}} - Current close price
• {{time}} - Bar timestamp
═══════════════════════════════════════════════════════════
LIMITATIONS & CONSIDERATIONS
═══════════════════════════════════════════════════════════
KNOWN LIMITATIONS
• Lower timeframe data may not be available on all symbols
• 1-minute data typically limited to recent history
• request.security() subject to TradingView data limits
• Dashboard requires screen space (may overlap on small screens)
• More complex calculations may affect load time on slower devices
NOT SUITABLE FOR
• Highly volatile/illiquid instruments (many false signals)
• News-driven markets during announcements
• Automated trading without additional filters
• Markets where EMA strategies don't perform well
DOES NOT PROVIDE
• Exact entry/exit prices
• Stop-loss or take-profit levels
• Position sizing recommendations
• Guaranteed profit signals
• Market predictions
═══════════════════════════════════════════════════════════
BEST PRACTICES
═══════════════════════════════════════════════════════════
RECOMMENDED USAGE
✓ Combine with price action analysis
✓ Use appropriate risk management
✓ Backtest on historical data before live use
✓ Adjust settings for specific market characteristics
✓ Wait for higher-quality setups in important trades
✓ Consider overall market context and fundamentals
NOT RECOMMENDED
✗ Using as standalone trading system without confirmation
✗ Trading every signal without discretion
✗ Ignoring risk management principles
✗ Trading without understanding the methodology
✗ Applying to unsuitable markets/timeframes
═══════════════════════════════════════════════════════════
EDUCATIONAL BACKGROUND
═══════════════════════════════════════════════════════════
EMA CROSSOVER STRATEGY
The Exponential Moving Average crossover is a classical trend-following technique:
• Golden Cross: Fast EMA crosses above Slow EMA (bullish signal)
• Death Cross: Fast EMA crosses below Slow EMA (bearish signal)
• Widely used since the 1970s in various markets
• More responsive than SMA due to exponential weighting
MULTI-TIMEFRAME ANALYSIS
Analyzing multiple timeframes helps traders:
• Identify alignment between short and long-term trends
• Reduce false signals from single-timeframe noise
• Understand market context across different horizons
• Make informed decisions about trade duration
VOLUME ANALYSIS
Volume confirmation adds reliability:
• High volume suggests institutional participation
• Low volume signals may indicate false breakouts
• Volume precedes price in many market theories
• Helps distinguish genuine moves from noise
═══════════════════════════════════════════════════════════
TECHNICAL IMPLEMENTATION
═══════════════════════════════════════════════════════════
CODE STRUCTURE
• Organized in clear sections with proper commenting
• Uses explicit type declarations (int, float, bool, color, string)
• Constants defined at top (BULLISH=1, BEARISH=-1, etc.)
• Functions documented with @function, @param, @returns
• Follows PineCoders naming conventions (camelCase variables)
PERFORMANCE OPTIMIZATION
• var keyword for table (created once, not every bar)
• Calculations cached where possible
• Dashboard updates only on last bar
• Minimal redundant security() calls
SECURITY IMPLEMENTATION
• Proper gaps and lookahead parameters
• No future data leakage
• Signals finalize on bar close
• Historical bars remain static
═══════════════════════════════════════════════════════════
VERSION INFORMATION
═══════════════════════════════════════════════════════════
Current Version: 2.0
Pine Script Version: 5
Last Updated: 2024
Developed by: Zakaria Safri
═══════════════════════════════════════════════════════════
SETTINGS REFERENCE
═══════════════════════════════════════════════════════════
EMA SETTINGS
• Fast EMA Length: 1-500 (default: 20)
• Slow EMA Length: 1-500 (default: 50)
VOLUME & MOMENTUM
• Use Volume Confirmation: true/false (default: true)
• Volume MA Length: 1-500 (default: 20)
• Show RSI Levels: true/false (default: true)
• RSI Length: 1-500 (default: 14)
PRICE ACTION FEATURES
• Show Price Distance: true/false (default: true)
• Show Key Levels: true/false (default: true)
• S/R Lookback Period: 10-500 (default: 50)
DISPLAY SETTINGS
• Show EMAs on Chart: true/false (default: true)
• Fast EMA Color: customizable (default: cyan)
• Slow EMA Color: customizable (default: orange)
• EMA Line Width: 1-5 (default: 2)
• Show Fill Between EMAs: true/false (default: true)
• Show Crossover Signals: true/false (default: true)
DASHBOARD SETTINGS
• Position: Top Left/Right, Bottom Left/Right
• Show Extended Statistics: true/false (default: true)
ALERT SETTINGS
• Alert on Multi-TF Alignment: true/false (default: true)
• Alert on Trend Strength Change: true/false (default: true)
═══════════════════════════════════════════════════════════
RISK DISCLAIMER
═══════════════════════════════════════════════════════════
This indicator is provided for educational and informational purposes only. It should not be considered financial advice or a recommendation to buy or sell any security.
IMPORTANT NOTICES:
• Past performance does not indicate future results
• All trading involves risk of capital loss
• No indicator guarantees profitable trades
• Always conduct independent research and analysis
• Use proper risk management and position sizing
• Consult a qualified financial advisor before trading
• The developer assumes no liability for trading losses
By using this indicator, you acknowledge that you understand these risks and accept full responsibility for your trading decisions.
═══════════════════════════════════════════════════════════
SUPPORT & CONTRIBUTIONS
═══════════════════════════════════════════════════════════
FEEDBACK WELCOME
• Constructive comments appreciated
• Bug reports help improve the indicator
• Feature suggestions considered for future versions
• Share your experience to help other users
OPEN SOURCE
This code is published as open source for the TradingView community to:
• Learn from the implementation
• Modify for personal use
• Understand multi-timeframe analysis techniques
If you find this indicator useful, please consider:
• Leaving a thoughtful review
• Sharing with other traders who might benefit
• Following for future updates and releases
═══════════════════════════════════════════════════════════
ADDITIONAL RESOURCES
═══════════════════════════════════════════════════════════
RECOMMENDED READING
• TradingView Pine Script documentation
• PineCoders community resources
• Technical analysis textbooks on moving averages
• Multi-timeframe trading strategy guides
• Risk management principles
RELATED CONCEPTS
• Trend following strategies
• Moving average convergence/divergence
• Multiple timeframe analysis
• Volume-price relationships
• Momentum indicators
═══════════════════════════════════════════════════════════
Thank you for using this indicator. Trade responsibly and continue learning!
═══════════════════════════════════════════════════════════

Wick Bias - by TenAMTraderWick Bias - by TenAMTrader
Wick Bias helps traders quickly visualize market pressure by analyzing candle wicks and bodies over a user-defined number of bars. By comparing top and bottom wicks, the indicator identifies whether buying or selling pressure has been dominant, providing a clear Indicator Bias signal (Bullish, Bearish, or Neutral).
Key Features:
Shows Top Wicks %, Bottom Wicks %, and optional Body % for recent candles.
Highlights Indicator Bias to indicate short-term market trends.
Fully customizable colors for table rows and bias labels.
Option to show or hide body percentage.
Alerts trigger on bias flips, with optional on-chart labels.
Table can be placed in any chart corner.
Updates in real-time with each new bar.
Recommended Use:
Ideal for intraday and swing traders looking for a quick visual cue of short-term market momentum.
Can be combined with other technical analysis tools to confirm trade setups or potential reversals.
Disclaimer / Legal Notice:
This indicator is for educational and informational purposes only. It is not financial advice and should not be used as the sole basis for trading decisions. Past performance does not guarantee future results. Users are responsible for their own trades. The developer is not liable for any losses or damages resulting from the use of this indicator.


Cyclical Phases of the Market🧭 Overview
“Cyclical Phases of the Market” automatically detects major market cycles by connecting swing lows and measuring the average number of bars between them.
Once it learns the rhythm of past cycles, it projects the next expected cycle (in time and price) using a dashed orange line and a forecast label.
In simple terms:
The indicator shows where the next potential low is statistically expected to occur, based on the timing and depth of previous cycles.
⚙️ Core Logic – Step by Step
1️⃣ Pivot Detection
The script uses the built-in ta.pivotlow() and ta.pivothigh() functions to find local turning points:
pivotLow marks a local swing low, defined by pivotLeft and pivotRight bars on each side.
Only confirmed lows are used to define the major cycle points.
Each new pivot low is stored in two arrays:
cycleLows → price level of the low
cycleBars → bar index where the low occurred
2️⃣ Cycle Identification and Drawing
Every time two consecutive swing lows are found, the indicator:
Calculates the number of bars between them (cycle length).
If that distance is greater than or equal to minCycleBars, it draws a teal line connecting the two lows — visually representing one complete cycle.
These teal lines form the historical cycle structure of the market.
3️⃣ Average Cycle Length
Once there are at least three completed cycles, the script calculates the average duration (mean number of bars between lows).
This value — avgCycleLength — represents the dominant periodicity or cycle rhythm of the market.
4️⃣ Forecasting the Next Cycle
When a valid average cycle length exists, the model projects the next expected cycle:
Time projection:
Adds avgCycleLength to the last cycle’s ending bar index to find where the next low should occur.
Price projection:
Estimates the vertical amplitude by taking the difference between the last two cycle lows (priceDiff).
Adds this same difference to the last low price to forecast the next probable low level.
The result is drawn as an orange dashed line extending into the future, representing the Next Expected Cycle.
5️⃣ Forecast Label
An orange label 🔮 appears at the projected future point showing:
Text:
🔮 Upcoming Cycle Forecast
Price:
The label marks the probable area and timing of the next cyclical low.
(Note: the date/time calculation currently multiplies bar count by 7 days, so it’s designed mainly for daily charts. On other timeframes, that conversion can be adapted.)
📊 How to Read It on the Chart
Visual Element Meaning Interpretation
Teal lines Completed historical cycles (low to low) Show actual periodic rhythm of the market
Orange dashed line Projection of the next expected cycle Anticipated path toward the next cyclical low
Orange label 🔮 Upcoming Cycle Forecast Displays expected price and bar location
Average cycle length Internal variable (bars between lows) Represents the dominant cycle period
📈 Interpretation
When teal segments show consistent spacing, the market is following a stable rhythm → cycles are predictable.
When cycle spacing shortens, the market is accelerating (volatility rising).
When it widens, the market is slowing down or entering accumulation.
The orange dashed line represents the next expected low zone:
If the market drops near this line → cyclical pattern confirmed.
If the market breaks well below → cycle amplitude has increased (trend weakening).
If the market rises above and delays → a new longer cycle may be forming.
🧠 Practical Use
Combine with oscillators (e.g., RSI or TSI) to confirm momentum alignment near projected lows.
Use in conjunction with volume to identify accumulation or exhaustion near the expected turning point.
Compare across timeframes: weekly cycles confirm long-term rhythm; daily cycles refine short-term entries.
⚡ Summary
Aspect Description
Purpose Detect and forecast recurring market cycles
Cycle basis Low-to-Low pivot analysis
Visuals Teal historical cycles + Orange forecast line
Forecast Next expected low (price and time)
Ideal timeframe Daily
Main outputs Average cycle length, next projected cycle, visual cycle map

NWOG/NDOG + EHPDA🌐 ENGLISH DESCRIPTION
Hybrid NWOG/NDOG + EHPDA – Advanced Gaps & Event Horizon Indicator
(Enhanced with Real-Time Alerts and Info Table)
📊 Overview
This advanced indicator combines automatic detection of weekly gaps (NWOG) and daily gaps (NDOG) with the Event Horizon (EHPDA) concept, now featuring customizable alerts and a real-time info table for a more efficient trading experience. Designed for traders who operate based on institutional price structures, liquidity zones, and SMC/ICT confluences.
✨ Key Features
1. Gap Detection & Visualization
NWOG (New Week Opening Gap): Identifies and visualizes the gap between Friday’s close and Monday’s open.
NDOG (New Day Opening Gap): Detects daily gaps on intraday timeframes.
Enhanced visualization: Semi-transparent boxes, price levels (top, middle, bottom), and lines extended to the current bar.
Customizable labels: Display gap formation date and price levels (optional).
2. Event Horizon (EHPDA)
Automatically calculates the Event Horizon level between two non-overlapping gaps.
Dashed line marking the equilibrium zone between bullish and bearish gaps.
3. Advanced 5pm-6pm Mode
Special option to detect the Sunday-Monday gap using 4H bars.
4. Real-Time Alerts
New gaps (NWOG/NDOG): Immediate notification when a new gap forms.
Gap fill: Alert when price completely fills a gap.
Event Horizon active: Notification when the Event Horizon level is triggered.
5. Info Table
Real-time display: number of active gaps, Event Horizon status, time remaining until weekly/daily close.
Customizable: position, size, and style.
🎨 Customization
Configurable colors for bullish gaps, bearish gaps, and Event Horizon line.
Customizable price labels and date format.
📈 Use Cases
Reversal trading, price targets, liquidity zones, SMC/ICT confluences.
⚙️ Recommended Settings
Timeframes: Daily and intraday (15m, 1H, 4H, etc.).
NWOG: Enable on all timeframes.
NDOG: Enable only on intraday.
Max Gaps: 3-5 for clean charts, 10-15 for historical analysis.
📝 Important Notes
Works best on 24/5 markets (Forex, Crypto).
Gaps automatically close when filled.
Event Horizon only appears with at least 2 non-overlapping gaps.

Trí Nguyễn TrendM30 → M15 Reversal (Engulfing/Doji/Hammer)Trend follow M30
Entry M15 (Engulfing/Doji/Hammer)

Divergences: Price × RSI × OBV The Triple Confirmation Divergence indicator is a sophisticated momentum and volume-based tool designed to identify high-probability trend exhaustion points and potential reversals. It moves beyond traditional single-indicator divergence analysis by synthesizing signals from three core pillars of technical analysis: Price Action, Momentum, and Volume Flow.
This indicator works better on the time frames: 1H, 4H, 1D, 1W and 1M.

Multi-Timeframe Stochastic (4x) z Podświetlaniemnowy skrypt bez etykietek o wyprzedaniu i wykupieniu