SIDD EMA RSI Supertrend Signal Table🔥 SIDD EMA RSI SuperTrend Multi-Timeframe Signal Table
**SIDD EMA RSI SuperTrend Signal Table** is a **clean, powerful multi-timeframe trend confirmation dashboard** designed for traders who want **clarity, confluence, and speed** — all in one glance.
This indicator **does NOT repaint** and uses **industry-standard trend logic** combining **EMA structure, RSI momentum, and SuperTrend direction** across **6 different timeframes**.
---
## 🧠 Core Logic Behind the Indicator
This script works on **three independent trend engines**, displayed together in a compact table:
### ✅ 1️⃣ EMA Trend (Structure Based)
* Uses **EMA 50 vs EMA 200**
* **Bullish** → EMA 50 above EMA 200
* **Bearish** → EMA 50 below EMA 200
* Captures **primary market structure**
### ✅ 2️⃣ RSI Trend (Momentum Based)
* RSI Length: **14**
* **Bullish** → RSI > **55**
* **Bearish** → RSI ≤ **55**
* Helps confirm **trend strength & momentum**
### ✅ 3️⃣ SuperTrend (Price Action Based)
* ATR Length: **10**
* Factor: **3.0**
* Clearly defines **trend direction & trailing bias**
* Excellent for **entry & exit alignment**
---
## ⏱️ Multi-Timeframe Coverage
The table analyzes trends across **6 configurable timeframes**:
* Intraday → **5m, 15m, 1H**
* Swing → **4H, Daily**
* Positional → **Weekly**
Each timeframe shows:
* 📈 EMA Trend
* 📊 RSI Trend
* 🔁 SuperTrend Direction
Color-coded for instant readability:
* 🟢 Bullish
* 🔴 Bearish
* ⚪ Neutral
---
## 🎯 How to Use This Indicator
✔ **Trend Trading**
Trade only when **EMA + RSI + SuperTrend align** across higher & lower timeframes.
✔ **Intraday Confirmation**
Use higher TF (1H / 4H) bias and take entries on lower TF.
✔ **Avoid Chop & False Signals**
If signals are mixed → market is likely **sideways or risky**.
✔ **Swing & Positional Trades**
Daily + Weekly alignment gives **high-probability setups**.
---
## ⚙️ Customization Options
* Adjustable **timeframes**
* Table **position** (Top/Bottom – Left/Right)
* Table **size** (Extra Small / Small / Normal)
* Custom **colors, borders & text**
* Optimized for **minimal chart clutter**
---
## ⚠️ Disclaimer
This indicator is a **trend confirmation & decision-support tool**.
Always combine with **price action, support/resistance, and proper risk management**.
Breadth Indicators

All-in-One Momentum Composite The Four Components (and Why They're Chosen)
RSI (Relative Strength Index) – Classic overbought/oversold oscillator (14-period default). Measures speed and change of price movements.
Stochastic (%D line) – Smoothened momentum indicator that compares closing price to the price range over a period. Excellent at spotting reversals in ranging markets.
WaveTrend – Very popular in crypto and forex communities (originally by LazyBear). It’s essentially a momentum oscillator based on overbought/oversold channels, similar to a faster, smoother RSI/Stochastic hybrid. Known for early divergence signals and clean crossovers.
MACD Histogram – Captures momentum changes and trend strength via the difference between fast and slow EMAs. The histogram shows acceleration/deceleration.

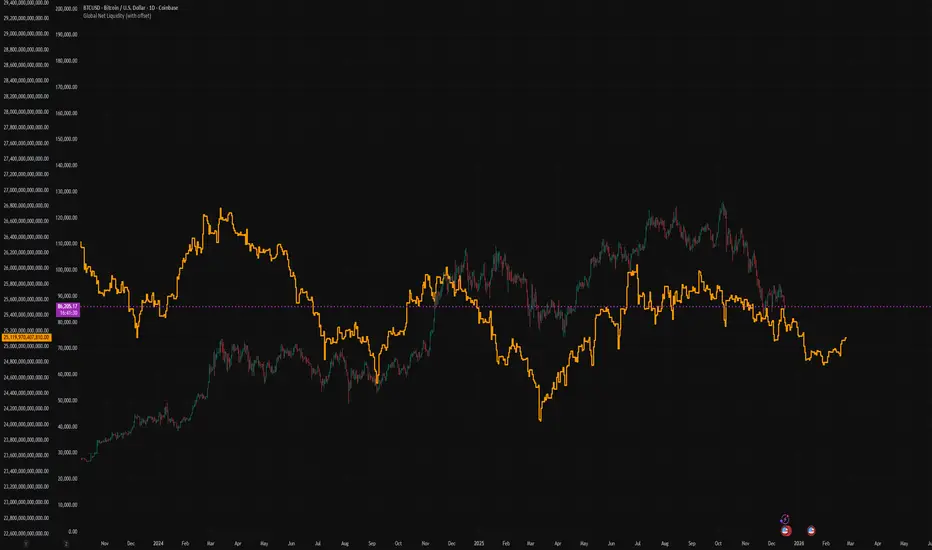
Global Net Liquidity (with offset Trail2Crypto)Click settings and set the offset to 70 days to have the perfect fit.
Varun's StrategyBuy and Sell strategy designed for a 1 minute chart to buy when RSI drops under 25 and sell when RSI exceeds 75

NSE Swing Breadth NSE Swing Breadth – Market Health Dashboard (0–200, % from Neutral)
Overview
NSE Swing Breadth – Market Health Dashboard is a market-wide health and regime indicator designed to track internal strength and participation across Large-, Mid-, and Small-cap indices in the Indian equity market.
Instead of focusing on price alone, this tool measures how strongly each segment is behaving relative to its own swing trend, normalizes those movements, and combines them into a single Market Health score. The result is a clean, objective dashboard that helps traders identify Risk-On, Caution, and Risk-Off regimes.
This indicator is best used for position sizing, exposure control, and timing aggressiveness, rather than individual stock entries.
Data Used
The indicator internally tracks three broad NSE indices:
Large Caps → NIFTY100EQUALWEIGHT
Mid Caps → NIFTYMIDCAP150
Small Caps → NIFTYSMLCAP250
Using equal-weighted and broad indices ensures the signal reflects true market participation, not just index heavyweights.
Core Logic
1. Swing Strength Model
For each index, the script calculates normalized swing strength:
Price is compared to its EMA swing baseline
The deviation from the EMA is normalized using the EMA of absolute deviations
This creates a volatility-adjusted strength value, allowing fair comparison across market regimes
This answers the question:
Is this segment pushing meaningfully above or below its recent trend?
2. Strength Converted to % from Neutral (Baseline = 100)
Each segment’s strength is converted into percentage-style points around a neutral baseline of 100:
100 = Neutral
+15 = +15% strength above neutral
–20 = –20% weakness below neutral
These values are plotted as three smooth lines:
Blue → Large Caps
Orange → Mid Caps
Purple → Small Caps
This makes relative leadership and divergence immediately visible.
3. Market Health Score (0–100)
The indicator combines all three segments into a single Market Health score:
Large Caps → 40% weight
Mid Caps → 35% weight
Small Caps → 25% weight
Extreme values are clamped to avoid distortion, and the final score is normalized to a 0–100 scale:
70–100 → Strong, broad participation
40–69 → Mixed / unstable participation
0–39 → Weak, risk-off conditions
Visual Components
📊 Market Health Histogram
A vertical histogram displays Market Health (0–100) with enhanced visibility:
🟢 Green (≥ 70) → Strong Risk-On regime
🟠 Orange (40–69) → Caution / Transition
🔴 Red (< 40) → Risk-Off regime
The histogram is visually compact and designed to reflect true market health, not exaggerated spikes.
📈 Strength Lines (Baseline = 100)
Three strength lines show % deviation from neutral:
Above 100 → Positive internal strength
Below 100 → Internal weakness
These lines help identify:
Leadership (which segment is driving the market)
Early deterioration (small/mid caps weakening first)
Broad confirmation (all segments rising together)
Dashboard Tables
📌 Market Regime Table (Bottom-Left)
Displays the current market regime:
🟢 RISK ON
🟡 CAUTION
🔴 RISK OFF
Along with the exact Market Health score (0–100).
📌 Strength Table (Top-Right)
Shows Large / Mid / Small cap strength as % from neutral, for example:
+18% → 18% above neutral
–12% → 12% below neutral
This avoids misleading interpretations and keeps values intuitive and actionable.
How to Use This Indicator
Risk-On (Green)
Favor full position sizes, trend-following strategies, and broader participation trades.
Caution (Orange)
Reduce leverage, tighten stops, and be selective. Expect choppiness.
Risk-Off (Red)
Prioritize capital protection, reduce exposure, and avoid aggressive longs.
This indicator is not an entry signal — it is a market environment filter.
⚠️ Important Style Setting (Required)
For correct visualization:
Settings → Style → Uncheck “Labels on price scale”
This prevents the indicator’s internal 0–200 model scale from interfering with the chart’s price scale and keeps the pane clean and readable.
Summary
NSE Swing Breadth – Market Health Dashboard provides a clear, objective view of market internals, helping traders align their risk with the true underlying condition of the market — not just price movement.
It is especially effective for:
Market regime identification
Exposure management
Avoiding false breakouts in weak breadth environments

HydraBot v1.2 publicenglish description english description english description english description english description english description english description english description english description

Timeframe Overlay 24HrDaily High–Low Box (00:00–23:59)
This indicator highlights each trading day with a shaded box spanning from 00:00 to 23:59 (based on the selected timezone) and covering the day’s highest and lowest price.
• Green box when the day closes above its open
• Red box when the day closes below its open
• Historical days are fully drawn for easy comparison
• Current day box builds dynamically as new candles form
Useful for visualising daily range, market bias, and intraday structure across all timeframes.

RMI Valid FVG & IFVGRMI • Valid FVG & iFVG (Smart Money Concept)
RMI • Valid FVG & iFVG is a precision-focused Fair Value Gap indicator designed for traders who follow Smart Money Concepts (SMC) / ICT logic and want to filter out low-quality, random gaps.
This indicator does not plot every FVG.
It highlights only structurally relevant FVGs that form in the direction of the trend and have a high probability of being filled.
Core Features
Bullish & Bearish Fair Value Gaps
Inverse Fair Value Gaps (iFVG)
Trend-aligned FVG filtering
Automatic invalidation after mitigation
Clean background zones for clear visibility
Optimized for intraday trading
Adjustable settings for scalping, intraday & swing trading
Smart Filtering Logic
FVGs are validated using market structure context
Only FVGs that form within the active trend are displayed
Weak or low-probability gaps are ignored
Inverse FVGs appear after strong displacement and rejection
Zones are visually faded once mitigated
This helps reduce chart noise and keeps the focus on high-probability reaction zones.
Best Use Cases
Entry refinement after BOS / CHoCH
Confluence with liquidity grabs
Premium / discount zone trading
Intraday & session-based trading
Works well with ICT, SMC, price action & structure-based strategies
Recommended Timeframes
Scalping: M1 – M5
Intraday (default): M5 – M15
Swing Trading: M15 – H1
(Default settings are optimized for intraday trading.)
Important Notes
This is not a signal indicator
No repainting
No buy/sell arrows
Designed as a decision-support tool, not an automated system
Always combine with proper risk management and confirmation.
RMI • Precision over noise.
Trade structure, not randomness.

MA20 ATR Trend Failure FilterA volatility-adaptive filter designed to identify early trend invalidation.
This indicator combines a 20-period Moving Average (MA20) with Average True Range (ATR) to dynamically define a lower volatility boundary.
When price closes below this boundary, it signals that the current trend is no longer valid and risk is increasing.
Core Concept(核心思想)
MA defines the trend baseline
ATR measures current market volatility
MA − k × ATR forms a dynamic risk threshold
A close below this threshold = trend failure
👉 中文补充:
这不是反转指标,而是趋势失效过滤器,用于避免在趋势已经被破坏后继续持仓或加仓。
How It Works
Calculate MA20 as the trend reference
Calculate ATR(14) as volatility proxy
Build adaptive bands:
Upper Band = MA20 + k × ATR
Lower Band = MA20 − k × ATR
If close < Lower Band, trend is considered failed
The ATR multiplier k automatically adjusts the tolerance based on volatility, avoiding rigid fixed-percentage rules.
Visual Elements
Yellow line: MA20
Green band: MA20 + k × ATR
Red band: MA20 − k × ATR (key risk boundary)
Red triangle + “FAIL” label: Trend failure signal
Optional background shading to highlight risk zones
Typical Use Cases
Trend-following strategies (exit / reduce exposure)
Breakout strategies (filter false continuation)
Risk management overlay (non-intrusive, no repaint)
Combine with HMA, SuperTrend, structure-based entries
👉 中文补充:
非常适合作为**“不该再拿”的客观判断条件**,而不是频繁交易信号。
Why This Indicator
Volatility-adaptive (ATR-based)
No future data, no repaint
Simple logic, strong risk control
Works across stocks, crypto, futures, indices
This tool is designed to answer one question only:
Is the current trend still valid?
Parameters
MA Length (default: 20)
ATR Length (default: 14)
ATR Multiplier k (default: 0.8)
Lower k → stricter risk control
Higher k → more tolerance, fewer false signals SSE:600595


Forexsebi - NASDAQ Psychological Levels - TrendflowTrendflow is an advanced TradingView indicator combining psychological price levels with trend and multi-timeframe analysis.
The indicator automatically plots psychological levels in around the current price. Each level is visualized using horizontal lines and price zones (boxes) to clearly highlight potential support and resistance areas.
Psychological Levels – Trendflow ist ein fortschrittlicher TradingView-Indikator , der wichtige psychologische Preislevel mit einer klaren Trend- und Multi-Timeframe-Analyse kombiniert.
Trend Analysis with SMAs
SMA 50 & SMA 200 plotted directly on the chart
Individually toggleable
Clear color separation for fast trend recognition
Multi-Timeframe SMA Trend Table
Trend status (BULLISH / BEARISH / NEUTRAL) across:
5M, 15M, 1H, 4H, 1D
Logic: Price relative to SMA 50 & SMA 200
Color-coded, easy-to-read table
Info Box
Current Gold price
Nearest psychological level above and below price
Alert System
Alerts when price approaches a psychological level
User-defined alert distance

MNQ Quant Oscillator Lab v2.1MNQ Quant Oscillator Lab v2.1 — Clean Namespaces
Adaptive LinReg Oscillator + Auto Regime Switching + MTF Confirmation + MOEP Gate + Research Harness
MNQ Quant Oscillator Lab is a research-grade oscillator framework designed for MNQ/NQ (and other liquid futures/indices) on 1-minute and intraday timeframes. It combines a linear-regression-based detrended oscillator with quant-style normalization, adaptive parameterization, regime switching, multi-timeframe confirmation, and an optional MOEP (Minimum Optimal Entry Point) gate. The goal is to provide a customizable signal laboratory that is stable in real time, non-repainting by default, and suitable for systematic experimentation.
What this indicator does
1) Core oscillator (quant-normalized)
The indicator computes a linear regression (LinReg) detrended signal and expresses it as a z-scored oscillator for portability across volatility regimes and assets. You can switch the oscillator “transform family” via Oscillator type:
LinReg Residual / Residual Z: detrended residual (mean-reversion sensitive)
LinReg Slope Z: regression slope (trend-derivative sensitive)
LogReturn Z: log-return oscillator (momentum-style)
VolNorm Return Z: volatility-normalized returns (risk-scaled)
This yields a single oscillator that is comparable over time, not tied to raw point values.
2) Adaptive length (dynamic calibration)
When enabled, the regression length is automatically adapted using a volatility-regime proxy (ATR% z-scored → logistic mapping). High volatility typically shortens the effective lookback; low volatility allows longer lookbacks. This helps the oscillator remain responsive during expansions while staying stable in compressions.
Important: the adaptive logic is implemented with safe warmup behavior, so it will not throw NaN errors on early bars.
3) Adaptive thresholds (dynamic bands)
Instead of static overbought/oversold levels, the indicator can compute dynamic upper/lower bands from the oscillator’s own distribution (rolling mean + sigma). This creates thresholds that adjust automatically to regime changes.
4) Auto regime switching (Trend vs Mean Reversion)
With Auto regime switch enabled, the indicator selects whether to behave as a Trend system or a Mean Reversion system using an interpretable heuristic:
Trend regime when EMA-spread is strong relative to ATR and ATR is rising
Otherwise defaults to Mean Reversion
This prevents running mean-reversion logic in trend breakouts and reduces “mode mismatch.”
5) Multi-timeframe (MTF) confirmation (optional)
MTF confirmation can be enabled to require that the higher timeframe oscillator sign aligns with the direction of the signal. This is useful for reducing noise on MNQ 1m by requiring higher-timeframe structure agreement (e.g., 5m or 15m).
6) MOEP Gate (optional “institutional” filter)
The MOEP gate is a confluence score filter intended to reduce low-quality signals. It aggregates multiple components into a 0–100 score:
BB/KC squeeze condition
Expansion proxy
Trend proxy
Momentum proxy (RSI-based)
Volume catalyst (volume z-score)
Structure break (highest/lowest break)
You can set:
Score threshold (minimum score required)
Minimum components required (forces diversity of evidence)
When enabled, a signal must satisfy both oscillator logic and MOEP confluence conditions.
7) Research harness (NON-CAUSAL, OFF by default)
A built-in research mode evaluates signals using future bars to compute basic forward excursion statistics:
MFE (max favorable excursion)
MAE (max adverse excursion)
Simple win-rate proxy based on MFE vs MAE
This feature is strictly for offline analysis and tuning. It is disabled by default and should not be considered “live-safe” because it uses future information for evaluation.
Signals and interpretation
Mean Reversion regime
Long: oscillator is below the lower band and turns back upward across it
Short: oscillator is above the upper band and turns back downward across it
Trend regime
Long: oscillator crosses above zero (optionally requires structure break confirmation)
Short: oscillator crosses below zero (optionally requires structure break confirmation)
Hybrid
When Hybrid is selected (manual mode), the indicator allows both trend and mean-reversion triggers, but still respects the filters and gates you enable.
Recommended starting configuration (MNQ 1m)
If you want stable, high-quality signals first, then expand into research:
Use RTH only: ON
Auto regime switch: ON
Adaptive length: ON
Adaptive bands: ON
MTF confirmation: OFF initially (turn ON later with 5m)
MOEP Gate: OFF initially (turn ON after you confirm base behavior)
Research harness: OFF (only enable for tuning studies)
Practical notes / transparency
The indicator is designed to be stable on live bars (optional confirmed-bar behavior reduces flicker).
No repainting logic is used for signals.
Any “performance” numbers shown under Research harness are not tradable metrics; they are forward-looking evaluation outputs intended strictly for experimentation.
Disclaimer
This script is provided for educational and research purposes only and does not constitute financial advice. Futures trading involves substantial risk, including the possibility of loss exceeding initial investment.

ORB Strategy + Backtesting (fixed timestamp) - Lines Adjusted⚡ ORB Strategy + Backtesting (Pine Script v5)
This script implements a complete Opening Range Breakout (ORB) strategy, featuring built-in backtesting, advanced TP/SL visualization, full style customization, and a performance dashboard. It is designed for traders who want to clearly evaluate breakout performance directly on the chart.
🕑 ORB Window Configuration
🔹 Session selection: choose between Market Timezone or Custom Session.
🔹 Timezone support: configurable from UTC-8 to UTC+12.
🔹 Daily limit: option to allow only one trade per day.
🔹 Risk/Reward (RR) settings:
Configurable TP1, TP2, and TP3 levels.
Stop Loss calculated dynamically from the ORB range.
📊 Backtesting Engine
🔹 Interactive dashboard showing trades, wins, losses, and win rate.
🔹 Adjustable partial exits for each TP (TP1, TP2, TP3).
🔹 Automatic calculation of percentage-based profit and loss.
🔹 Tracks total trades, total profit, and average profit per trade.
🎨 Visual Customization
🔹 Fully customizable colors:
ORB high/low lines and range fill.
Buy/Sell entry labels.
TP and SL lines with background zones.
🔹 Line style and thickness options (solid, dotted, dashed).
🔹 Visibility controls for each TP/SL level.
🔹 Clear profit and loss zones drawn directly on the chart.
🚀 Trading Logic
🔹 LONG entries: triggered when price breaks above the ORB high.
🔹 SHORT entries: triggered when price breaks below the ORB low.
🔹 Automatic calculation of Stop Loss and TP1, TP2, TP3 based on ORB range and RR.
🔹 Customizable BUY / SELL labels displayed at entry.
✅ TP / SL Detection
🔹 Real-time detection of TP1, TP2, TP3, and SL hits.
🔹 Prevents double counting of the same level.
🔹 Extended TP/SL lines with shaded zones for better clarity.
📈 Backtesting Dashboard
🔹 Displayed in the top-right corner of the chart.
🔹 Shows:
Total trades
Wins / Losses
Win rate (%)
Total profit (%)
Average profit per trade
🔹 Fully customizable panel color.
✨ Summary
This script combines:
Opening Range detection
Breakout trading logic with advanced risk management
Professional-grade visualizations
Integrated historical performance tracking
High customization for sessions, styles, and colors
💡 Ideal for traders who want to trade ORB setups with clarity, structure, and measurable results.

Trading Dashboard + Daily SMAsThis indicator is an all-in-one workspace overlay designed for futures and intraday traders. It consolidates critical market internals, session statistics, and daily technical levels into a single, highly customizable dashboard.
The goal of this script is to reduce chart clutter by placing essential data into a clean table while overlaying key Daily Moving Averages onto your intraday timeframe.
Key Features:
1. Comprehensive Market Internals Dashboard Monitor the health of the broad market directly from your chart. The dashboard includes real-time data for:
VIX: Volatility Index.
TICK & TRIN: Sentiment and volume flow indicators.
Breadth Data: ADD, ADV, and DECL (Advance/Decline lines and volume).
Multi-Ticker Watch: Monitor 3 additional assets (Defaults: NQ, RTY, YM) with real-time price and % change.
2. Session Statistics & Probabilities Automated calculation of intraday statistics based on a user-defined lookback period (default 100 days):
RTH Data: Tracks Regular Trading Hours Open, Close, and Range.
Contextual ATR: Compares current RTH range to the 14-day ATR.
Probabilities: Displays historical probabilities for "Gap Fill," "Break of Yesterday's High," and "Break of Yesterday's Low."
3. Daily SMAs on Intraday Charts Plot key Daily Simple Moving Averages (21, 50, 200) directly on your lower timeframe charts (1m, 5m, etc.) without switching views.
Fully Customizable: Toggle each SMA on/off individually.
Color Control: Users can change the color of every SMA line to fit their theme.
4. "Dark Mode" Optimized The dashboard features a specific "Very Dark Grey" (#121212) background by default, designed to reduce eye strain and blend seamlessly with dark-themed trading setups.
Settings & Customization:
Session Times: Define your specific RTH start and end times.
Symbols: All ticker symbols (VIX, ADD, NQ, etc.) can be customized in the settings menu to match your data provider.
Visibility: Every element in the table and every SMA line has a toggle switch. You only see what you need.
Visuals: Change table position, text size, and line colors.
Author's Instructions: Configuration Guide
This script relies on specific ticker symbols to pull data for Market Internals (TICK, TRIN, ADD) and the Watchlist. Depending on your data subscription plan (CME, CBOE, etc.), you may need to adjust the default symbols to match what you have access to.
1. How to Change Symbols
Add the indicator to your chart.
Hover over the indicator name in the top-left corner and click the Settings (Gear Icon).
Scroll to the "Symbols" section.
Click inside the text box for the symbol you want to change.
2. Common Symbol Formats If the default symbols show "N/A" or "Error," try these alternatives based on your data feed:
TICK (NYSE Tick)
Default: USI:TICK (Requires specific data)
Alternative: TVC:TICK (General TradingView feed)
Alternative: TICK (Generic)
TRIN (Arms Index)
Default: USI:TRIN
Alternative: TVC:TRIN
Alternative: TRIN
Breadth (ADD/ADV/DECL)
ADD (Advance-Decline Line): Try USI:ADD, TVC:ADD, or ADD
ADV (Advancing Volume): Try USI:ADV, TVC:ADV, or UVOL (Up Volume)
DECL (Declining Volume): Try USI:DECL, TVC:DECL, or DVOL (Down Volume)
VIX
Standard: CBOE:VIX or TVC:VIX
3. Setting Up the Ticker Watchlist (Ticker 1, 2, 3) The script defaults to "Continuous Contracts" (indicated by the 1!), which automatically rolls to the front month.
Nasdaq: CME_MINI:NQ1!
S&P 500: CME_MINI:ES1!
Russell 2000: CME_MINI:RTY1!
Dow Jones: CBOT_MINI:YM1!
Note: If you want to watch a specific contract month (e.g., December 2025), enter the specific code like NQZ2025.
4. Troubleshooting "N/A" Data If a cell in the table is empty or says "N/A":
Verify you are not viewing the chart on a timeframe that excludes the data (though dynamic_requests=true usually handles this).
Ensure you have the correct data permission for that specific symbol.
Market Closed: Some internal data points only populate during the active NYSE session (09:30 - 16:00 ET).
Disclaimer: This tool is for informational purposes only and does not constitute financial advice. Past probabilities do not guarantee future results.

RS vs Indexes By Shashi MishraRS vs Indexes giving details about strength of the sripts against the TIDE which is indexes that you can follow , for example small cap index 100 / 250

Adaptive 2-Pole Trend Bands [supfabio]Adaptive 2-Pole Trend Bands is a volatility-aware trend filtering indicator designed to identify the dominant market direction while providing dynamic reference zones around price.
Instead of relying on traditional moving averages, this indicator uses a two-pole digital filter to smooth price action while maintaining responsiveness. Around this central trend line, a multi-band structure based on ATR is applied to help traders evaluate pullbacks, extensions, and potential exhaustion areas within a trend.
Core Concept
The indicator is built around three key ideas:
Digital Trend Filtering
Volatility-Adjusted Bands
Trend Persistence Measurement
These components work together to separate meaningful price movement from noise and to provide context for how far price has moved relative to recent volatility.
Two-Pole Trend Filter
At its core, the indicator uses a two-pole smoothing filter, which produces a cleaner trend curve than common moving averages.
Compared to standard averages, this approach:
Reduces market noise
Produces smoother transitions
Responds faster to genuine trend changes
Avoids excessive lag in trending markets
The result is a trend line that represents the structural direction of price, rather than short-term fluctuations.
Adaptive Multi-Band System
Around the central trend filter, the indicator plots four independent volatility-based bands, each derived from the Average True Range (ATR).
Each band represents a different degree of price extension:
Band 1: Shallow pullbacks and minor reactions
Band 2: Moderate extensions within a trend
Band 3: Strong directional moves
Band 4: Extreme extensions relative to recent volatility
Because the bands are ATR-based, they automatically adapt to changing market conditions, expanding during high volatility and contracting during calmer periods.
This makes the indicator suitable for both slow and fast markets without manual recalibration.
Trend State Detection
The color of the central filter dynamically reflects trend persistence, not just direction:
Sustained upward movement highlights bullish conditions
Sustained downward movement highlights bearish conditions
Transitional phases are visually distinct, helping identify regime changes
This logic is based on how long price has maintained directional behavior, reducing sensitivity to isolated candles or short-lived spikes.
Practical Applications
This indicator can be used as:
A trend filter for discretionary or systematic strategies
A context tool to evaluate pullbacks versus overextension
A risk reference to avoid entries in extreme price zones
A confirmation layer when combined with price action or momentum tools
It performs consistently across different asset classes, including futures, cryptocurrencies, forex, indices, and equities.
Configuration
Key parameters such as filter length, damping factor, and band multipliers are fully configurable, allowing traders to adapt the indicator to different timeframes and trading styles.
Important Notes
This indicator does not predict future price movement
It does not generate guaranteed buy or sell signals
Best results are achieved when used in combination with sound risk management and additional confirmation tools
Past behavior does not imply future performance
Disclaimer
This indicator is provided for educational and analytical purposes only and should not be considered financial advice.
Se quiser, posso:
Criar uma versão resumida para a primeira linha da publicação
Ajustar o texto para um tom mais técnico ou mais comercial
Traduzir para português mantendo o inglês como idioma principal
Revisar o título para SEO dentro da Biblioteca Pública

Session Range Control [PointAlgo]Session Range Control (SRC)
The Session Range Control (SRC) indicator provides a structured view of intraday price behavior by tracking where the current price sits within the session’s high–low range and how today’s volatility compares to the Average Daily Range (ADR). It combines range analytics, momentum context, volatility interpretation, and visual cues to help traders understand session strength and shifts in intraday conditions.
Core Concept
Every trading session forms a unique high and low. SRC continuously reads these values and calculates the Position in Range, expressed on a scale from 0% to 100%:
0% → Price at Day Low
100% → Price at Day High
50% → Mid-range equilibrium
By normalizing price into a percentage, traders can quickly interpret where market pressure is concentrated during the session.
Trend Zones and Market State
SRC divides the range into logical zones to show the likely sentiment of the session:
1. Strong Uptrend Zone (Above Threshold)
When price consistently holds above the user-defined upper threshold (e.g., 60%), the indicator marks a Strong Uptrend.
This typically reflects:
Persistent intraday buying pressure
Price acceptance near the upper part of the range
Reduced likelihood of deep pullbacks
2. Strong Downtrend Zone (Below Threshold)
When price remains below the lower threshold (e.g., 40%), SRC signals a Strong Downtrend, indicating:
Dominant intraday selling
Consistent pressure keeping price near session lows
3. Bullish / Bearish Zones
Between the midline and strong thresholds, SRC displays softer trend zones:
Above 50% = Bullish Zone
Below 50% = Bearish Zone
These zones help classify whether price is trending, balanced, or drifting.
4. Neutral Territory
When price hovers around the mid-level without conviction, the indicator treats it as a neutral or undecided phase.
Signal Logic :
SRC includes built-in momentum shift signals based on range transitions:
Long Signal
Triggered when price crosses upward through 50%, often showing:
A shift from intraday weakness to strength
Buyers gaining control of the session
Short Signal
Triggered when price crosses downward through 50%, suggesting:
Loss of intraday strength
Sellers taking control
These signals help highlight potential turning points inside the session.
Extreme Levels :
SRC highlights the top and bottom 10% of the range:
> 90% = Extreme High (Overbought intraday condition)
< 10% = Extreme Low (Oversold intraday condition)
These conditions can be useful for identifying overextended movements or potential reaction zones.
ADR Comparison and Volatility Context :
The indicator also measures how today’s price range compares to the Average Daily Range (ADR):
Range Expanding: Today’s range is significantly larger than the ADR
Indicates heightened volatility
Often associated with trending or breakout environments
Range Compressing: Today’s range is much smaller
Suggests low volatility
Common before breakout phases
Characteristic of consolidation or balanced markets
This volatility context helps traders assess whether the session is behaving within normal boundaries or deviating significantly.
Dashboard Overview :
When enabled, the dashboard summarizes key intraday metrics in a structured table:
Trend status (Strong Uptrend, Strong Downtrend, Bullish, Bearish, Neutral)
Range position (%)
Signal status (Long Cross, Short Cross, Extreme High/Low, or None)
Day range calculation
Range vs ADR (%)
Day High / Day Low
Current price level
Simplified action label based on current conditions
This provides a quick reference system to interpret both trend and volatility at a glance without analyzing the full chart visually.
Visual Elements
SRC includes:
Colored dynamic plot for easy trend recognition
Horizontal reference lines at key levels (0%, 50%, 100%, strong-trend thresholds)
Background shading during extreme zone conditions
A separate ADR comparison plot
These visuals ensure the indicator remains intuitive regardless of chart style or timeframe.
Alerts
The script includes alert conditions for:
Long cross
Short cross
Strong trend detection
Extreme high / extreme low
These allow users to automate notifications during key market events without manually monitoring the chart.
Customization Options
Users can configure:
ADR length
Strong trend thresholds
Dashboard visibility
Dashboard position on chart
This makes SRC adaptable to different trading instruments and intraday styles.
Usage Notes
Works best on intraday timeframes where session boundaries are clearly defined.
Designed for analytical interpretation—trend bias, volatility phase, and range structure.
Can complement other tools such as moving averages, volume, or market structure analysis.
Disclaimer :
This indicator is intended for chart analysis and educational purposes only.
It does not generate financial, investment, or trading advice.
Users should validate signals with additional research and apply proper risk management.

MAJOR PA Zones + Structure + Targets (Gray/Purple)This script highlights major price-action structure (HH/HL/LH/LL), marks BOS/CHOCH events, and draws key supply/demand zones to help visualize trend shifts and potential targets.

BALANCED Strategy: Intraday Pro + Smart DashboardWelcome to the BALANCED Strategy: Intraday Pro.
This all-in-one indicator is designed for Intraday traders looking to capture trend movements while effectively filtering out sideways market noise. It combines the power of Supertrend for direction, EMA 100 for the baseline trend, and rigorous validation via RSI and ADX.
The script also integrates a complete Risk Management system with targets based on the Golden Ratio (Fibonacci) and a real-time Dashboard.
⏳ Recommended Timeframes
This algorithm is optimized for Intraday volatility:
M5 (5 Minutes) ⭐️: Ideal for quick Scalping. The ADX filter is crucial here to avoid false signals.
M15 (15 Minutes) 🏆: The "Sweet Spot." It offers the best balance between signal frequency and trend reliability.
M30 / H1: For a "Swing Intraday" approach—calmer, fewer signals, but higher precision.
Not recommended for M1 (1 Minute) with default settings (too much noise).
🚀 How It Works
The algorithm follows a strict 3-step logic to generate high-quality signals:
1. Trend Identification (The Engine)
Supertrend: Determines the immediate direction.
EMA 100: Acts as a background trend filter. We only buy above and sell below the EMA.
2. Noise Filtering (Safety)
ADX (Average Directional Index): The signal is only validated if there is sufficient volatility (Configurable threshold, default 12) to avoid "chop markets" (flat markets).
RSI (Relative Strength Index): Strict momentum filter. Buy only if RSI > 50, Sell if RSI < 50.
3. Entry Confirmation (The Trigger)
The script doesn't just rely on a crossover. It waits for "Price Action" confirmation: the candle must close higher than the previous one (for Long) or lower (for Short) to validate the entry.
🛡️ Risk Management (Money Management)
This is the core strength of this tool. Upon signal validation, the script automatically calculates and plots:
Stop Loss (SL): Based on volatility (ATR). It places the stop at the recent Low/High with a safety padding.
Take Profit (TP): Two modes available:
Fibonacci Mode (Default): Targets the 1.618 extension (Golden Ratio) of the risk taken.
Fixed Ratio Mode: Targets a manual Risk/Reward ratio (e.g., 2.0).
📊 The Dashboard
Located at the bottom right, the smart dashboard provides vital info at a glance:
Signal Time: To check if the alert is fresh.
Type (LONG/SHORT): Color-coded (Green/Pink).
Tech Data: RSI and ADX values at the moment of the signal.
Exact Prices: Entry Level, Target (TP), and Stop Loss (SL).
⚙️ Configurable Settings
Sensitivity: Adjust the Supertrend factor (Default 2.0).
Filters: Toggle the RSI filter ON/OFF or adjust the ADX threshold.
Execution: Choose between Fibonacci Target (1.618) or a Manual Ratio.
⚠️ Disclaimer: This tool is a technical decision aid and does not constitute financial investment advice. Always use prudent risk management and backtest the indicator on your preferred assets before live use.

CODEX OB V1CODEX OB V1 is a multi-purpose Smart Money Concepts (SMC) indicator that automatically detects and visualizes key institutional trading elements such as Order Blocks, Fair Value Gaps, Rejection Blocks, Break of Structure, Pivots, High Volume Bars, and several qualitative SMC signals.
This tool helps traders identify institutional footprints and displacement-based setups with high clarity.

LL-HL PivotThis indicator scans for the bullish structure known as a Higher Low (HL) across multiple lengths simultaneously, automatically selects the most suitable pattern, and plots it on the chart.
Below is a detailed explanation of how it works.
1. Basic Calculation Method (Definition of LL and HL)
This indicator is built on TradingView’s ta.pivotlow function.
Detecting Pivot Lows
For a given length, a Pivot Low is identified as the lowest point among the candles within the specified range to the left and right.
LL and HL Determination
LL (Lowest Low): The most recent Pivot Low is treated as the previous low.
HL (Higher Low): When a new Pivot Low forms above the previous LL, it is recognized as an HL, and the setup is considered “complete.”
Identifying the Pivot Line
During the LL–HL structure, the highest high between them is identified and used as the breakout level (Pivot Line / resistance), where a horizontal line is drawn.
2. Multi-Length Scanning
Unlike standard indicators that use only one length (e.g., Length = 5), this indicator evaluates a full range of lengths.
Min Length to Max Length
Example: Min = 2, Max = 10
Internally, it functions as if nine separate indicators (Length 2, 3, 4 … 10) are running simultaneously.
This allows the indicator to capture:
Small waves (short-term pullbacks)
Larger waves (broader structural moves)
3. Priority Mode System
Because multiple lengths are calculated at the same time, different LL–HL patterns may appear simultaneously.Priority Mode determines which setup is selected and displayed.
A. Lowest LH
Selects the pattern with the lowest pivot line (intermediate high).
Advantages:
Produces the lowest possible entry price
B. Longest Length
Selects the pattern with the longest length.
Advantages:
Focuses on larger structures and broader waves
Filters out noise
C. Shortest Length
Selects the pattern with the shortest length.
Advantages:
Reacts quickly to small moves
Useful for scalping or fast trend-following
Captures very short-term pullbacks
4. Additional Behavior and Features
Real-Time Invalidation
If price breaks below the confirmed HL, the structure is immediately considered invalid.
All previously drawn lines and labels are removed instantly, preventing outdated structures from remaining on the chart.
Pivot Line Extension
As long as the HL remains intact, the Pivot Line (breakout level) continues extending to the right.
Alerts
An alert can be triggered the moment price breaks above the Pivot Line on a closing basis.

