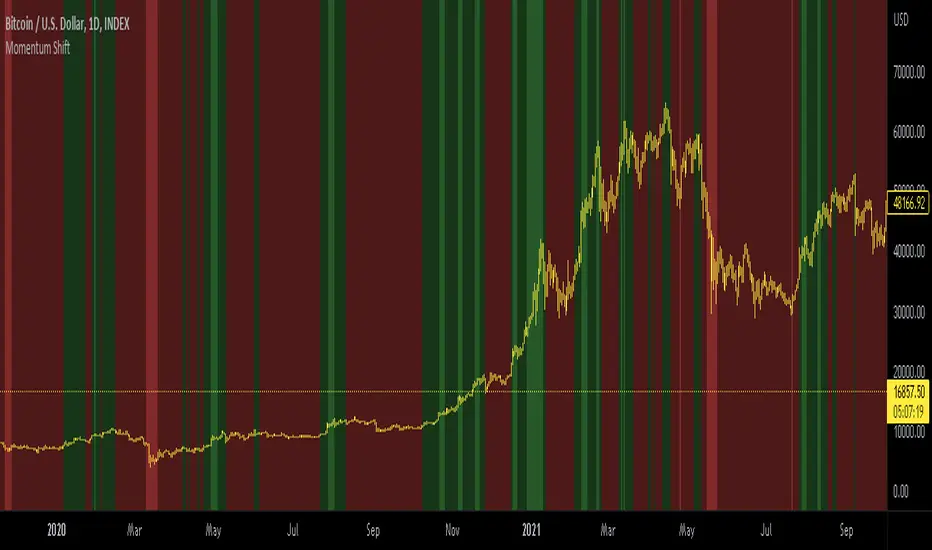
Momentum shift CCI, MACD, RSI, AligatorIndicator for BTC only.
This indicator combines CCI MACD RSI AND William's alligator.
Bullish macd cross, RSI over 50, bullish William cross and positive CCI result in green background. Otherwise red background is displayed.
For better visibility extreme values can be displayed with greater color saturation. 1D BTCUSD is best with default values.
For other TFs Bull side and bear side values can be tweaked.
For bright red we may assume price to be `greatly oversold.
For bright green we may seek some profit taking.
BTCUSDT
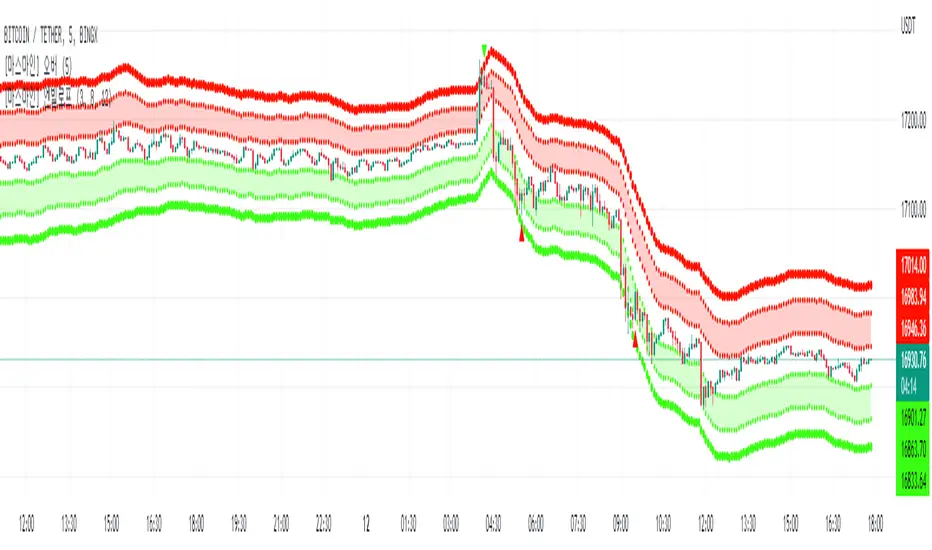
MarsMine_EnvelopThis indicator is an indicator for use in 5-minute period day trading strategies.
The indicator derives a power power based on past closing prices and substitutes the power value into a multiplier of Euler's constant to derive a range.
Bands were increased by substituting multiples into the derived range, and each band has a role.
You will enter a buy or sell between the first and second bands, and become comfortable on the opposite first band.
The third band is set as a stop loss standard.
이 지표는 5분봉 단타 매매 전략에서 사용하기 위한 보조지표입니다.
해당 지표는 과거 종가를 기반으로 멱수를 도출해내고 해당 멱수값을 오일러 상수의 승수에 대입하여 범위를 도출해냅니다.
도출해 낸 범위에 멀티플을 대입하여 밴드를 증가 시켰으며 각 밴드들은 역할이 존재합니다.
첫번째와 두번째 밴드 사이에서 매수 또는 매도 진입을 하게 되며, 반대의 첫번째 밴드에서 익절하게 됩니다.
세번째 밴드는 손절기준으로 설정합니다.
Time Based Crypto DayTrade StrategyThis is a time based strategy, designed to enter and exit within the same day of the week, using different hours for entry and exit.
The script is long only direction, and it has no risk management inside, so use it with caution.
At the same time you can also calculate each individual hour return within a certain day, and make your own idea about the best moments to be enter.
In order to filter a bit from the bad trades, I have applied an ATR filter, to check if that volatility is rising in order to help eliminate some of the bad trades when there is no volatility around.
For this example, on BTC, it seems that for the last years, on tuesday and thursday, enterring at the beginning of the daily candle, 01:00hours and exit at 00:00 hours, seems to give positive results giving the idea that can be converted in some sort of edge into our favor.
However dont take this entirelly for granted and conduct your own searches

Bitcoin Long Time Cycle Detection (RGB Box)Hi!
I tried to analyze bitcoin's cycles since the beggining at INDEX:BTCUSD (on 1D timeframe) using some tools like Moving Averages and Ichimoku Cloud and Fibonacci Levels based on ATH prices of each cyle. Each cycle type is represented by colors:
1- Green is when the price is going to have a new ATH compared to the last ATH
2- Red is when the price is going to move down from the last ATH
3- Blue is when the price seems not going down anymore and moving up go get to the last ATH
The result is very interesting because each cycle has similar behaviours. The Main cycle is when there is a Green, Red and Blue and then there will be a Green again for the new cycle.
Logic of detecting Red part some times makes a Red between two Green s (which is normal but it makes a bit difference in the behaviour of the last part of that shorter Red part) so the valuable part is the Blue !
You can see the interesting noticable similarity of the Blue 's price movement and duration (written in the boxes).
What I understood from this model about each part was:
In the Greens, strongest candles of the whole market appear with higher volumes. which are the shortest parts too.
in the Reds, we see a lot of hammer candles here, price moves down step by step (unless it is going to have a NEW ATH which makes the duration of Red part vert shorter than the main Red parts before the Blue). Temporary resistances make some range channels but finally the price will go down a lot!
in the Blues, the main weak uptrend from the bottom which is finally going to see its last ATH price, but very slowly and weakly compared to the Green part. Some times there will be a lot of temporary downtrends too but in the end, price is going up. this part maybe the best time to buy for long time holding.
What makes this model interesting is that cycles match fundamental events like HALVING and periodic cycle analyses based on that.
In the last cylce we haven't seen the Blue Signal yet! so there should be alot of more patient till we say there will be no more down.
I hope it gives you more insight on the long term trend of crypto. I would be glad to hear your ideas to improve the model.

[Sniper] SuperTrend + SSL Hybrid + QQE MODHi. I’m DuDu95.
**********************************************************************************
This is the script for the series called "Sniper".
*** What is "Sniper" Series? ***
"Sniper" series is the project that I’m going to start.
In "Sniper" Series, I’m going to "snipe and shoot" the youtuber’s strategy: to find out whether the youtuber’s video about strategy is "true or false".
Specifically, I’m going to do the things below.
1. Implement "Youtuber’s strategy" into pinescript code.
2. Then I will "backtest" and prove whether "the strategy really works" in the specific ticker (e.g. BTCUSDT) for the specific timeframe (e.g. 5m).
3. Based on the backtest result, I will rate and judge whether the youtube video is "true" or "false", and then rate the validity, reliability, robustness, of the strategy. (like a lie detector)
*** What is the purpose of this series? ***
1. To notify whether the strategy really works for the people who watched the youtube video.
2. To find and build my own scalping / day trading strategy that really works.
**********************************************************************************
*** Strategy Description ***
This strategy is from " QQE MOD + supertrend + ssl hybrid" by korean youtuber "코인투데이".
"코인투데이" claimed that this strategy will make you a lot of money in any crypto ticker in 15 minute timeframe.
### Entry Logic
1. Long Entry Logic
- Super Trend Short -> Long
- close > SSL Hybrid baseline upper k
- QQE MOD should be blue
2. Short Entry Logic
- Super Trend Long -> Short
- close < SSL Hybrid baseline lower k
- QQE MOD should be red
### Exit Logic
1. Long Exit Logic
- Super Trend Long -> Short
2. Short Entry Logic
- Super Trend Short -> Long
### StopLoss
1. Can Choose Stop Loss Type: Percent, ATR, Previous Low / High.
2. Can Chosse inputs of each Stop Loss Type.
### Take Profit
1. Can set Risk Reward Ratio for Take Profit.
- To simplify backtest, I erased all other options except RR Ratio.
- You can add Take Profit Logic by adding options in the code.
2. Can set Take Profit Quantity.
### Risk Manangement
1. Can choose whether to use Risk Manangement Logic.
- This controls the Quantity of the Entry.
- e.g. If you want to take 3% risk per trade and stop loss price is 6% below the long entry price,
then 50% of your equity will be used for trade.
2. Can choose How much risk you would take per trade.
### Plot
1. Added Labels to check the data of entry / exit positions.
2. Changed and Added color different from the original one. (green: #02732A, red: #D92332, yellow: #F2E313)
3. SuperTrend and SSL Hybrid Baseline is by default drawn on the chart.
4. If you check EMA filter, EMA would be drawn on the chart.
5. Should add QQE MOD indicator manually if you want to see QQE MOD.
**********************************************************************************
*** Rating: True or False?
### Rating:
→ 3.5 / 5 (0 = Trash, 1 = Bad, 2 = Not Good, 3 = Good, 4 = Great, 5 = Excellent)
### True or False?
→ True but not a 'perfect true'.
→ It did made a small profit on 15 minute timeframe. But it made a profit so it's true.
→ It worked well in longer timeframe. I think super trend works well so I will work on this further.
### Better Option?
→ Use this for Day trading or Swing Trading, not for Scalping. (Bigger Timeframe)
→ Although the result was not good at 15 minute timeframe, it was quite profitable in 1h, 2h, 4h, 8h, 1d timeframe.
→ Crypto like BTC, ETH was ok.
→ The result was better when I use EMA filter.
### Robust?
→ Yes. Although result was super bad in 5m timeframe, backtest result was "consistently" profitable on longer timeframe (when timeframe was bigger than 15m, it was profitable).
→ Also, MDD was good under risk management option on.
**********************************************************************************
*** Conclusion?
→ I recommend you not to use this on short timeframe as the youtuber first mentioned.
→ In my opinion, I can use on longer timeframe like 2h or bigger with EMA filter, stoploss and risk management.

[Sniper] SSL Hybrid + QQE MOD + Waddah Attar StrategyHi. I’m DuDu95.
**********************************************************************************
This is the script for the series called "Sniper".
*** What is "Sniper" Series? ***
"Sniper" series is the project that I’m going to start.
In "Sniper" Series, I’m going to "snipe and shoot" the youtuber’s strategy: to find out whether the youtuber’s video about strategy is "true or false".
Specifically, I’m going to do the things below.
1. Implement "Youtuber’s strategy" into pinescript code.
2. Then I will "backtest" and prove whether "the strategy really works" in the specific ticker (e.g. BTCUSDT) for the specific timeframe (e.g. 5m).
3. Based on the backtest result, I will rate and judge whether the youtube video is "true" or "false", and then rate the validity, reliability, robustness, of the strategy. (like a lie detector)
*** What is the purpose of this series? ***
1. To notify whether the strategy really works for the people who watched the youtube video.
2. To find and build my own scalping / day trading strategy that really works.
**********************************************************************************
*** Strategy Description ***
This strategy is from "SSL QQE MOD 5MIN SCALPING STRATEGY" by youtuber "Daily Investments".
"Daily Investments" claimed that this strategy will make you some money from 100 trades in any ticker in 5 minute timeframe.
### Entry Logic
1. Long Entry Logic
- close > SSL Hybrid Baseline.
- QQE MOD should turn into blue color.
- Waddah Attar Explosion indicator must be green.
2. Short Entry Logic
- close < SSL Hybrid Baseline
- QQE MOD should turn into red color.
- Waddah Attar Explosion indicator must be red.
### Exit Logic
1. Long Exit Logic
- When QQE MOD turn into red color.
2. Short Entry Logic
- When QQE MOD turn into blue color.
### StopLoss
1. Can Choose Stop Loss Type: Percent, ATR, Previous Low / High.
2. Can Chosse inputs of each Stop Loss Type.
### Take Profit
1. Can set Risk Reward Ratio for Take Profit.
- To simplify backtest, I erased all other options except RR Ratio.
- You can add Take Profit Logic by adding options in the code.
2. Can set Take Profit Quantity.
### Risk Manangement
1. Can choose whether to use Risk Manangement Logic.
- This controls the Quantity of the Entry.
- e.g. If you want to take 3% risk per trade and stop loss price is 6% below the long entry price,
then 50% of your equity will be used for trade.
2. Can choose How much risk you would take per trade.
### Plot
1. Added Labels to check the data of entry / exit positions.
2. Changed and Added color different from the original one. (green: #02732A, red: #D92332, yellow: #F2E313)
3. SSL Hybrid Baseline is by default drawn on the chart.
4. If you check EMA filter, EMA would be drawn on the chart.
5. Should add QQE MOD and Waddah Attar Explosion indicator manually if you want to see QQE MOD.
**********************************************************************************
*** Rating: True or False?
### Rating:
→ 1.5 / 5 (0 = Trash, 1 = Bad, 2 = Not Good, 3 = Good, 4 = Great, 5 = Excellent)
### True or False?
→ False
→ Doesn't Work on 5 minute timeframe. Also, it doesn't work on crypto.
### Better Option?
→ Use this for Day trading or Swing Trading, not for Scalping. (Bigger Timeframe)
→ Although the result was bad at 5 minute timeframe, it was profitable in 1h, 2h, 4h, 8h, 1d timeframe.
→ BTC, ETH was ok.
→ The result was better when I use EMA filter (only on longer timeframe).
### Robust?
→ So So. Although result was bad in short timeframe (e.g. 30m 15m 5m), backtest result was "consistently" profitable on longer timeframe.
→ Also, MDD was not that bad under risk management option on.
**********************************************************************************
*** Conclusion?
→ Don't use this on short timeframe.
→ Better use on longer timeframe with filter, stoploss and risk management.

[D] Dudu 95 Strategy Template ver.1.1.Hello Guys! Nice to meet you all!
This is my Second script after changing My Profile Name!
I updated my strategy template before - I added some filter conditions (EMA, ADX, DMI).
If there's something to update, I will update this script!
Thank you!
-----
I made this based on the open source strategies by jason5480, kevinmck100, myncrypto.
Thank you All!
### Filter
1. Can Choose whether to use filter.
2. Filters Based on ATR, EMA, ADX, and DMI are ready to use.
### StopLoss
1. Can Choose Stop Loss Type: Percent, ATR, Previous Low / High.
2. Can Chosse inputs of each Stop Loss Type.
### Take Profit
1. Can set Risk Reward Ratio for Take Profit.
- To simplify backtest, I erased all other options except RR Ratio.
- You can add Take Profit Logic by adding options in the code.
2. Can set Take Profit Quantity.
### Risk Manangement
1. Can choose whether to use Risk Manangement Logic.
- This controls the Quantity of the Entry.
- e.g. If you want to take 3% risk per trade and stop loss price is 6% below the long entry price,
then 50% of your equity will be used for trade.
2. Can choose How much risk you would take per trade.
### Plot
1. Added Labels to check the data of entry / exit positions.
2. Changed and Added color different from the original one. (green: #02732A, red: #D92332, yellow: #F2E313)

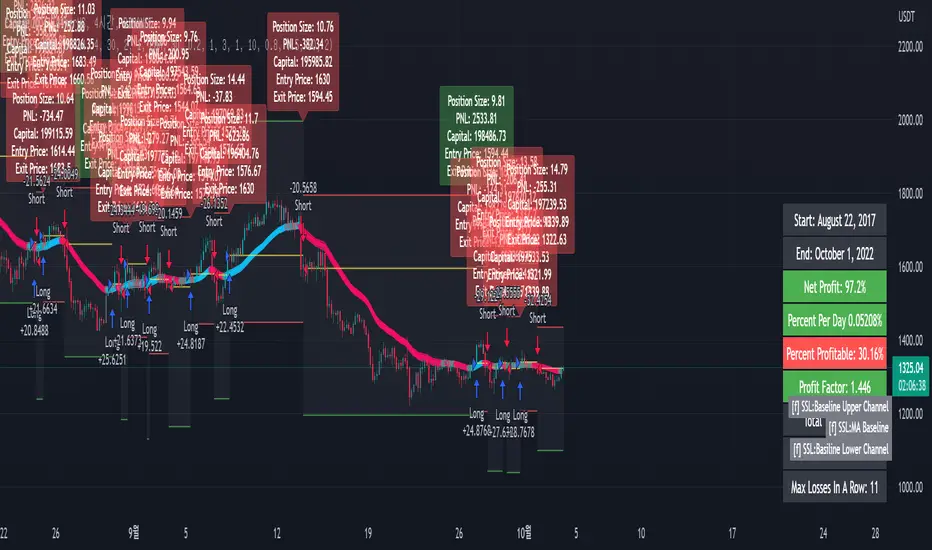
[fpemehd] SSL Baseline StrategyHello Guys! Nice to meet you all!
This is my third script!
This Logic is trend following logic, This detects long & short trends based on SSL Hybrid Baseline.
This fits to the longer time frame like 4hr and 1d.
### Long Condition
1. close > SSL Hybrid baseline upper k
- Baseline is the ma of close price. (You can choose ma type and length)
- Upper k is the upper Keltner Channel.
### Short Condition
1. close < SSL Hybrid baseline lower k
- Baseline is the ma of close price. (You can choose ma type and length)
- Lower k is the lower Keltner Channel.
### Etc
1. Added Stoploss based on highest high or lowest low with lookback.
2. Strategy Template is based on @kevinmck100 template. Thank you!
MA Simple Strategy with SL & TP & ATR FiltersHello Guys! Nice to meet you all!
This is my second script!
This Logic is trend following logic, This detects long & short trends by comparing the value of MAs.
This fits to the longer time frame.
### Long Condition
1. Compare 4 MAs (you can chose MA Type)
- Shortest MA (MA 1)
- Shorter MA (MA 2)
- Normal MA (MA 3)
- Longer MA (MA 4)
2. If MA 1 > MA 2 > MA 3 > MA 4, then Enter Long Position
- ‘The arrangement of MAs in descending orders’ is the proxy of the long trend.
### Short Condition
1. Compare 4 MAs (you can chose MA Type)
- Shortest MA (MA 1)
- Shorter MA (MA 2)
- Normal MA (MA 3)
- Longer MA (MA 4)
2. If MA 1 < MA 2 < MA 3 < MA 4, then Enter Short Position
- ‘The arrangement of MAs in ascending orders’ is the proxy of the short trend.
### Close Condition
1. When trend Changes
- When (MA 1 > MA 2 > MA 3 > MA 4) breaks or (MA 1 < MA 2 < MA 3 < MA 4) breaks.
2. When the price hits the stoploss
3. When the price hits the take profit level (basically 50% of qty will be closed)
### Etc
1. Trend filter (ATR should be bigger than SMA of ATR)
- If the volatility of price is to small (ATR), then there could be false signal. To filter this out, I used the condition ‘ATR should be larger than SMA of ATR’.
2. Stoploss
- Enabled Stoploss based on ATR, Percent, Risk-Reward Ratio,
- Enabled Trailing Stoploss.
3. Choose MA Type
- You can choose MA Type
+ Thanks for the stoploss template @jason5480

EMA + Bullish Engulfing Candle Pattern StrategyHello Guys! Nice to meet you all!
This is my first open source script!
### Long Condition
1. Bullish Engulfing Candle
2. No doge Candle
3. Present volume should be bigger than the previous volume (20%)
4. Trend filter (with 2 EMAs)
### Close Condition
1. When trend Changes
2. When Bearish Engulfing Candle appears
###
No stop loss and take profit.

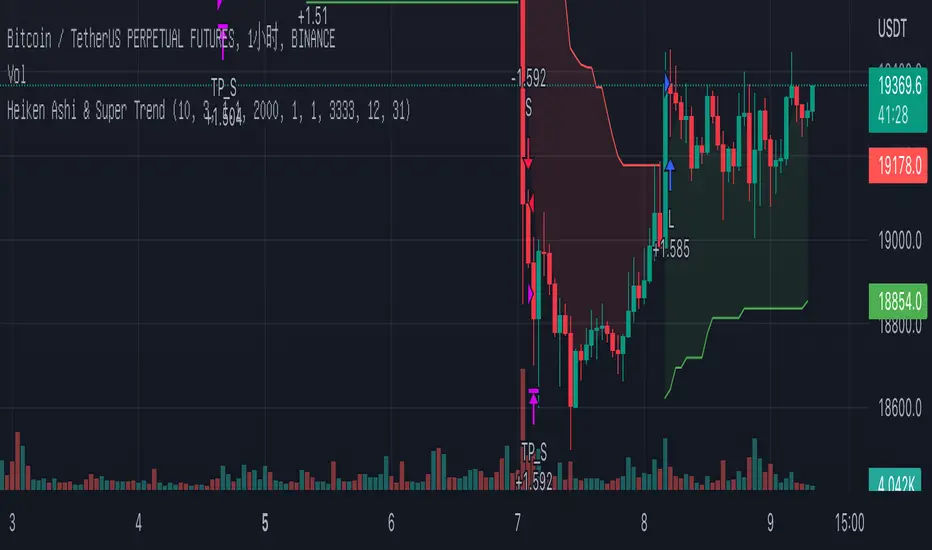
Heiken Ashi & Super TrendThis is one of my open source 1h strategies
It works on Binance: BTCUSDTPERP charts
This strategy involves two indicators
1. Heiken Ashi - a typical technical indicator to help highlight and clarify the current trend. This somehow allows the chart to ignore unnecessary fluctuations and make the trend more visible.
2.Super Trend - - One of the most common ATR-based indicators, the SuperTrend indicator is useful to help you catch big trends.
Buy entry conditions are as follows.
1. The Super Trend indicator running on the Heiken Ashi chart gives a buy signal.
2. Buy at the current market price and take profit at 1% of the normal k-line at this time.
Take profit
TP - 1%
Stop Loss
None
Volume Buy/Sell (by iammaximov)Buy/Sell Volume
Buy/Sell volume based on total bar amplitude (high/low price) and close/open (for calculate vbuy > vsell or vbuy < vsell)

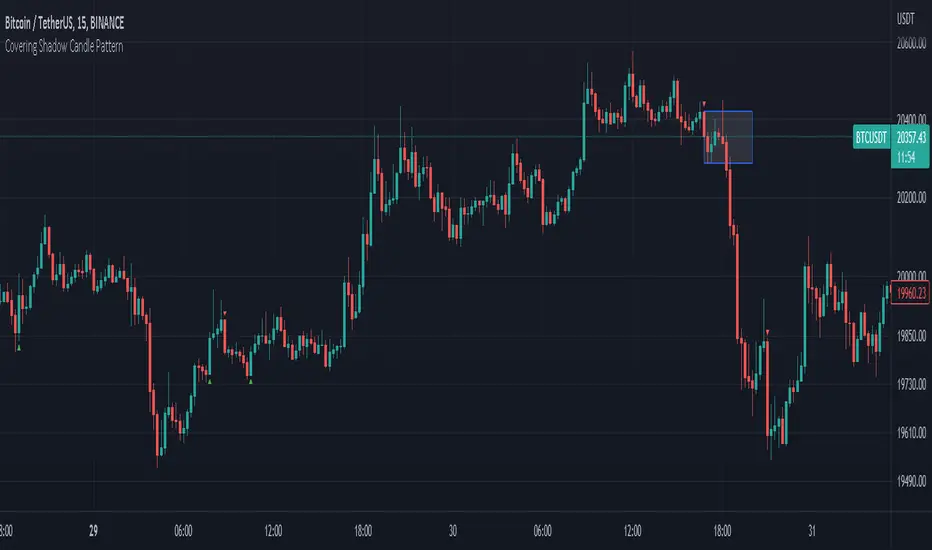
Covering Shadow Candle PatternThis indicator shows 3 types of objects on chart:
1. downward red triangle above a candle: 3 green candles followed by a fourth red candle of which the low price is lower than the low of the 3 previous green candles, this is usually the sign of reversal from upward movement to a downward one.
2. 1. upward green triangle below a candle: 3 red candles followed by a fourth green candle of which the high price is higher than the high of the 3 previous red candles, this is usually the sign of reversal from downward movement to a upward one.
3. boxes: these boxes are drawn when the patterns of cases 1 and 2 fails to perform as expected which means we have some important areas at that level so it can be a resistance or support zone .
Supply and Demand MultiTimeFrameWhat Is the Law of Supply and Demand?
The law of supply and demand is a theory that explains the interaction between the sellers of a resource and the buyers for that resource . The theory defines the relationship between the price of a given good or product and the willingness of people to either buy or sell it. Generally, as price increases, people are willing to supply more and demand less and vice versa when the price falls. ( -Investopedia )
This Indicator Help's you to find possible Supply and Demand zones formed on chart on MultiTimeFrame.
All the Supply Zones are colored RED and are above the current price. It will vanish once price crosses over it.
All the Demand Zones are colored GREEN and are below the current price. It will vanish once price crosses under it.
Only Untested Zone are plotted on chart.
These zones can be plotted on Chart TimeFrame as well as MultiTimeFrame(Higher). That can be selected from Input Section.
Concept Behind the Zones
1. Rally Base Rally
2. Drop Base Drop
3. Drop Base Rally
4. Rally Base Drop
Drop base rally
Rally base drop
rally base rally
drop base drop
For Supply zones we try to find "Drop Base Drop" and "Rally Base Drop" , and plot RED zones on the width of base. Base can include any number of candle ranging from 1 to 6. This can be controlled from Input Section
For Demand zones we try to find "Rally Base Rally" and "Drop Base Rally" , and plot GREEN zones on the width of base. Base can include any number of candle ranging from 1 to 6. This can be controlled from Input Section
How to Trade
We recommend to use 5-8 time Higher TimeFrame as Supply and Demand Zones. For Example if chart is at 5 min Timeframe then Zones should be plotted on 25 min to 40 min TImeframe.
And when Price reaches closer to Supply/ Demand Zone then use some other indicator to confirm the reversal from that level, like trendline , moving average etc.
Targets should be nearest Supply/ Demand Zone .

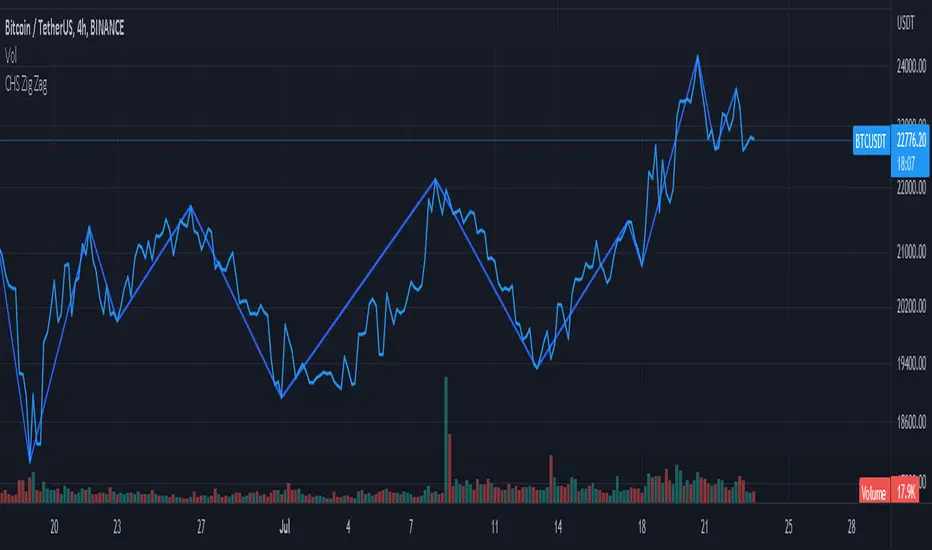
CHS Zig ZagCHS ZigZag stands for Changeable Source ZigZag
The original ZigZag indicator offered by TradingView doesn't have the ability to measure the tips and troughs based on closing prices (line chart), however, this indicator is capable of receiving an input from user that determines the price source used for further calculations.
The default inputs of the original ZigZag indicator have been also changed in order to make it adapt to pivots formed on line chart but users can change arbitrarily.
[BUBBLENUKE] BOB The Reversal Trader Indicator=============================================================: BOB The Reversal Trader :=============================================================
COMPONENTS:
- VWAP Anchored at Friday CME close
- Bitcoin CME close
- Volume bars
DESCRIPTION:
BOB is a mean-reversion trading system focused in BTCUSDT asset in the 30M time frame. The system is divided into 2 types of entries:
WEEKENDS:
BOB will trigger his entry when the price of Bitcoin is at one of the two deviations from the VWAP anchored at Friday CME close
INTRA-WEEK:
BOB will trigger its entry when the price of Bitcoin is at one of the two deviations from the VWAP anchored at the Friday CME close or when a volume candle indicates a reversal

[BUBBLENUKE] BOB The Reversal Trader=============================================================: BOB The Reversal Trader :=============================================================
COMPONENTS:
- VWAP Anchored at Friday CME close
- Bitcoin CME close
- Volume bars
SETTINGS:
- Asset: BTCUSDTPERP
- Time frame: 30M
- Hard TP %: 1.5
- Hard SL %: 40
- Trading Session Start (UTC): 4
- Trading Session End (UTC): 17
DESCRIPTION:
BOB is a mean-reversion trading system focused in BTCUSDT asset in the 30M time frame. The system is divided into 2 types of entries:
WEEKENDS:
BOB will trigger his entry when the price of Bitcoin is at one of the two deviations from the VWAP anchored at Friday CME close and BOB will take your profits when the price returns to the VWAP. When BOB hits Sunday and the CME reopens, BOB will close all your open positions.
INTRA-WEEK:
BOB will trigger its entry when the price of Bitcoin is at one of the two deviations from the VWAP anchored at the Friday CME close or when a volume candle indicates a reversal. BOB will take your profits when the price returns to the VWAP or when the HARD TP % is reached (1.5% by default). When BOB hits Friday and the CME closes, BOB will close all your open positions.

RSI OverlayThis is the stock RSI index using the Price as the midline.
It can be useful to view information normally displayed in a second pane overlaid on the price chart. As far as I know, this has not been done for one of the most widely used indicators, the Relative Strength Index.
This can be overlaid anywhere on the chart and every parameter is variable. If you'd like to change the position, the RSI, midline, upper line, and lower line are scaled with a factor "*close/x"
To change the position on the chart, simply change the "X" until you are pleased with the location.
The RSI MA was distracting so I removed it. I also published this indicator including the MA, titled "RSI Overlay with MA."

BTC Active Address Momentum (On-chain)This indicator shows the difference between the % change in BTC price and the % change in BTC’s active addresses (BTC’s utility value).
- Dark red: Extreme overbought conditions
BTC price is increasing too fast and outgrows the increase in its utility value
(RSI of % change difference > 70)
- Light red: Overbought conditions
BTC price is increasing too fast and outgrows the increase in its utility value
(RSI of % change difference > 60)
- Dark green: Extreme oversold conditions
BTC price is dropping too fast and outruns the decrease in its utility value
(RSI of % change difference < 30)
- Light green: Oversold conditions
BTC price is dropping too fast and outruns the decrease in its utility value
(RSI of % change difference < 40)
*Not financial advice.

BTC Active Address Trend (On-chain)This indicator compares the % change in BTC price and the % change in BTC’s active addresses (BTC’s utility value).
1. % changes in BTC price & active addresses
- Orange line: BTC’s price change (%)
- Gray line: BTC’s active address change (%)
- Red/Yellow/Green lines: Bollinger bands for change in active address
2. Trend:
- Green circles: Bullish Sentiment Trend
Market sentiment is bullish and BTC price outgrows the increase in its utility value (overpricing)
- Red circles: Bearish Sentiment Trend
Market sentiment is bearish and BTC price drops more than the decrease in its utility value (underpricing)
3. Potential Re-Entries:
- Green/Red triangles: potential bullish/bearish entries
When % change of BTC price gets similar to that of active addresses
*Not financial advice.

SOPR SignalThe script uses Glassnode's SOPR on-chain data to identify:
1. Sentiment Trends:
- Green circle on bottom (Bullish) -> Investors are selling in profits
- Red circle on top (Bearish) -> Investors are selling in losses
2. Short-term Entries:
- Small green circle on SOPR (Bullish) -> Approaching investor purchase price in bull run -> not willing to sell -> decrease supply
- Small red circle on SOPR (Bearish) -> Approaching break even price in bear run -> chance to get out -> increase supply
3. Potential Trend Change:
- Yellow circle on top/bottom -> Potential trend changing soon

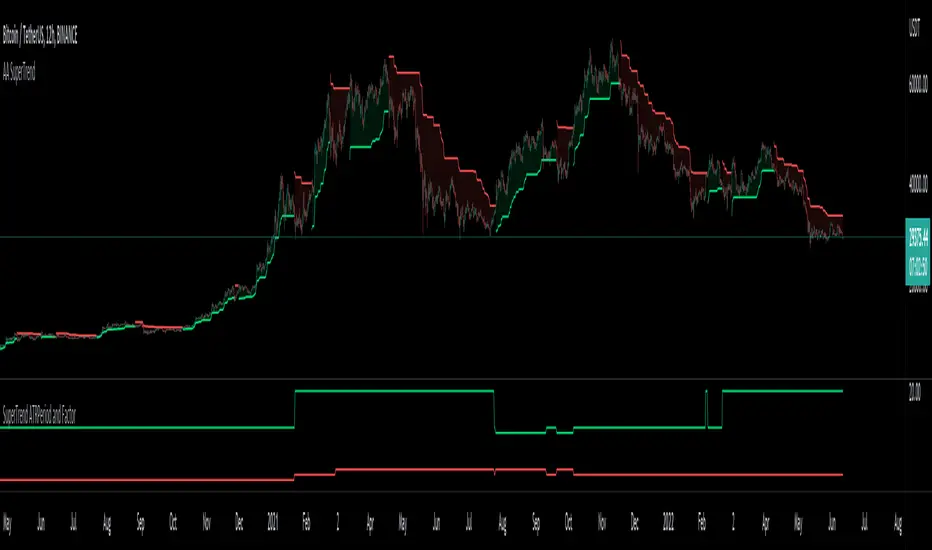
Auto Adjust SuperTrend Indicator SuperTrend
It is a standard ATR (Average True Range)-based Trailing Indicator. The indicator takes two default values ATR Period and Factor. The standard settings for Super Trend I have seen are 10,3 or 10,2. These settings will not work for all the instruments, and we end up manually changing these settings. This is where Auto-Adjust Supertrend adds value. Auto-Adjust SuperTrend finds the optimized settings for ATRPeriod and Multiple using a defined algorithm to check all the different ATR Periods and Factors. It backtests different combinations of ATR Period and Factors and Indicator switches to these profitable settings as soon as it detects most profitable setting among given range in the settings.
Default ATR Period : 10 to 20
Default Factor : 2 to 5
The above settings can be altered in the indicator settings. Please do keep in mind that the performance of the indicator reduces as we increase the default settings range.
Alerts are available as well
Pls contact me for access.
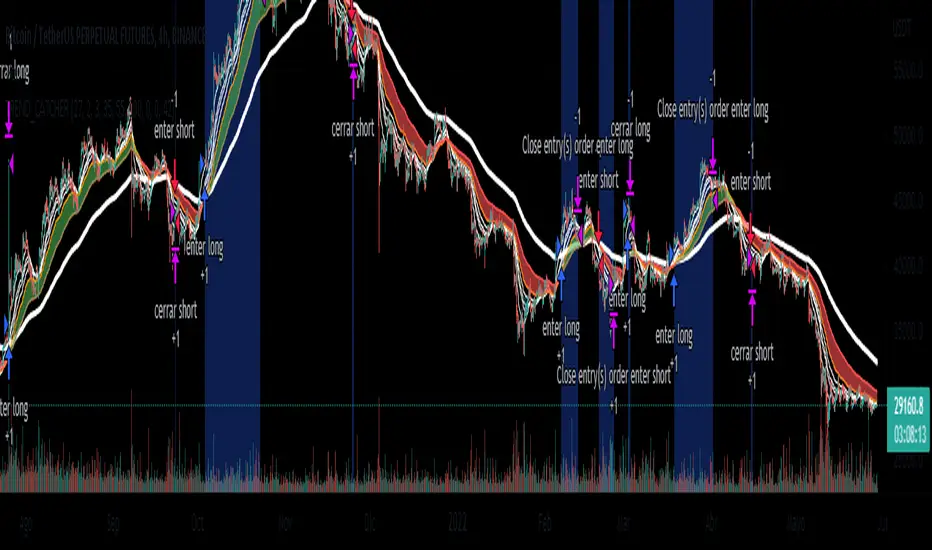
EMA_TREND_CATCHERSimple strategy based on the crossing of moving averages of 50,100 and 200 periods. Designed to identify trends
You are ready to use trading bots (all you have to do is fill in "Variables for Alert"). However, it can also be used for discretionary operations.
BTCUSDT FUTURES BINANCE
4H