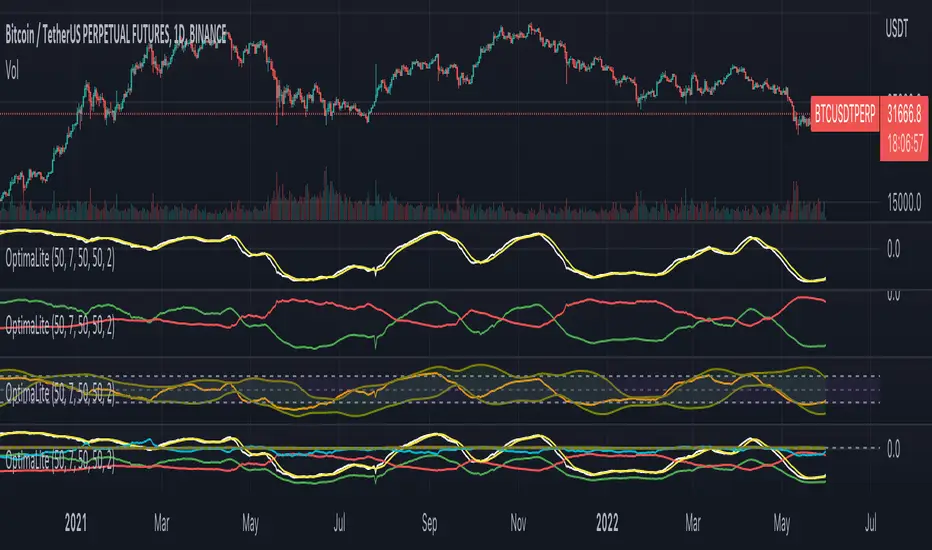
OptimaLiteThe OptimaLite algorithm performs the calculation of the integrated profits and losses for all the buyers and sellers that they have for the given “Calculation period” back in history for every time point. The idea is based on the principle of the accumulation and distribution of the capital among the market participants leading to the price trend change.
The indicator consists of the several components (signal lines):
1) “Return” – the main signal that reflects the integrated profits and losses delta (the “Return” moving average is added)
2) “Profit” and “Loss” – integrated profits and losses correspondingly
3) “Return Normalized” – the normalized “Return” for a given period of time
4) “Return High Frequency” – the “Return” signal compensated with the short-term fluctuations by RSI
How to use the indicator:
– Highs and lows of the indicator are associated with the overbought and oversold conditions points correspondingly.
– Crosses of the moving average with the main indicator line are associated with the trend change
– Divergencies between the indicator and price highs or lows can be used as signals for the trend reversal
– “Profit” and “Loss” signal lines intersections indicate the bulls/bears take over the market
Adjustments:
The periods of the calculation, averaging and normalization are the main parameters that could be tuned in order to optimize the indicator performance. Generally, the default values are sufficient for the nominal performance thought. But the best combination of those parameters is specific for each asset and timeframe, so it recommended to optimize them.
BTCUSDT
Hulk Strategy x35 Leverage 5m chart w/Alerts This strategy is a pullback strategy that utilizes 2 EMAs as a way of identifying trend, MACD as an entry signal, and RSI and ADX to filter bad trades. By using the confirmation of all of these indicators the strategy attempts to catch pullbacks, and it is optimized to wait for high probability setups. Take not that the strategy is optimized for use on BTCUSDT along with 35 times leverage(Using leverage is risky). The Hulk Strategy waits for strong trend confirmation and then attempts to identify pullbacks using MACD and RSI. By using these it identifies strong short term movement against the trend(hence the name Hulk). To use the strategy wait for the strategy to make an entry, and then enter with a stop loss of 1.1% and a take profit of 1.35% with respect to if it is a long or short position. The trade frequency of this strategy is high as it is made for use on the 5m timeframe. But this does not mean you will have to be staring at your computer constantly as an average of 1 trade takes place each day. This will vary a lot though, somedays the strategy enters up to 4 times. I wish you good trading and hope that you like this strategy!
P.S. The indicators on my chart are visualizations of the indicators used in the strategy, they are not necessary for the strategy to work though. Also the colored in cloud on the price chart is an EMA cloud and it comes with the strategy when you add it to your chart. This EMA cloud consists of two EMAs a 50 and a 200 EMA.

[MACLEN] VolumenTotal
With this indicator, it is intended to know the total volume of the market, adding the volume of the different exchanges in a single indicator.

Trend Day IndentificationVolatility is cyclical, after a large move up or down the market typically "ranges" during the next session. Directional order flow that enters the market during this subsequent session tends not to persist, this non-persistency of transactions leads to a non-trend day which is when I trade intraday reversionary strategies.
This script finds trend days in BTC with the purpose of:
1) counting trend day frequency
2) predicting range contraction for the next 1-2 days so I can run intraday reversion strategies
Trend down is defined as daily bar opening within X% of high and closing within X% of low
Trend up is defined as daily bar opening within X% of low and closing within X% of high
default parameters are:
1) open range extreme = 15% (open is within 15% of high or low)
2) close range extreme = 15% (close is within 15% of high or low)
There is also an atr filter that checks that the trend day has a larger range than the previous 4 bars this is to make sure we find true range expansion vs recent ranges.
Notes:
If a trend day occurs after a prolonged sideways contraction it can signal a breakout - this is less common but is an exception to the rule. These types of occurrences can lead to the persistency of order flow and result in extended directional daily runs.
If a trend day occurs close to 20 days high or low (stopping just short OR pushing slightly through) then wait an additional day before trading intraday reversion strategies.

DashBoard Alt Season by KziHere is a Dashboard to have an overview of the Alt Season oportunity.
Multiple time frame (Month / Week / Daily /4H)
How to use it?
You have 4 columns
TOTAL Crypto / Btc dominance / Btc Price / Alt ?
The alt? column is the resulte of the price and dominance of btc + 1 point with the total crypto
BTC Dominance UP ? Yes = Négatif for ALTS
/// Btc Price UP ?= > Yes = Positif for ALTS
NO = super négatif for ALTS
No = Positif for ALTS
/// Btc Price UP ?= > Yes = super Positif for ALTS
NO = Neutral
The total market just smooth the total.
If Alt columm is Green= It's OK
If Alt columm is orange = carrefull
If Alt Columm is red = leave the alt
You have to considered that you look on the time frame where you want to trade.
The overtime frame help to understand the bigger view.
Hop you like it and give comment to help the évolutions.

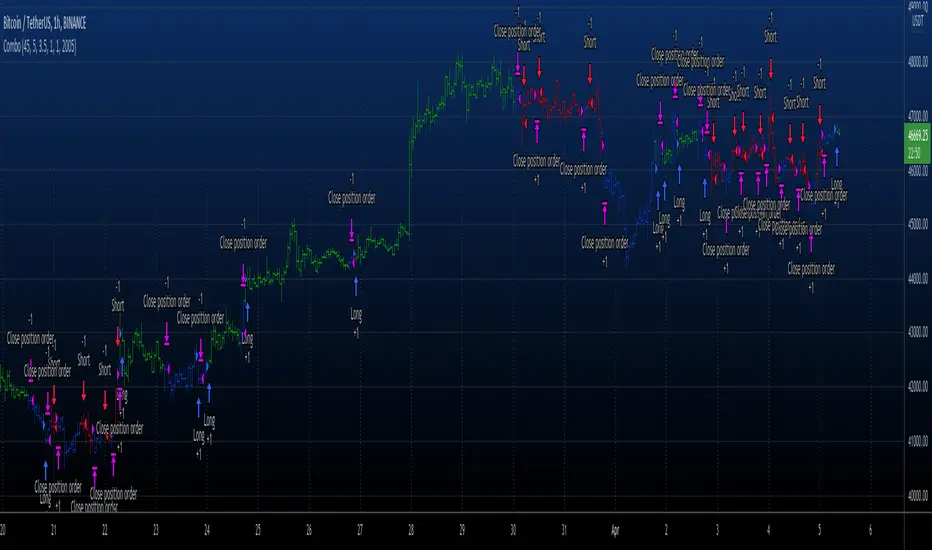
Combo 2/20 EMA & Average True Range Reversed This is combo strategies for get a cumulative signal.
First strategy
This indicator plots 2/20 exponential moving average. For the Mov
Avg X 2/20 Indicator, the EMA bar will be painted when the Alert criteria is met.
Second strategy
Average True Range Trailing Stops Strategy, by Sylvain Vervoort
The related article is copyrighted material from Stocks & Commodities Jun 2009
Please, use it only for learning or paper trading. Do not for real trading.
WARNING:
- For purpose educate only
- This script to change bars colors.
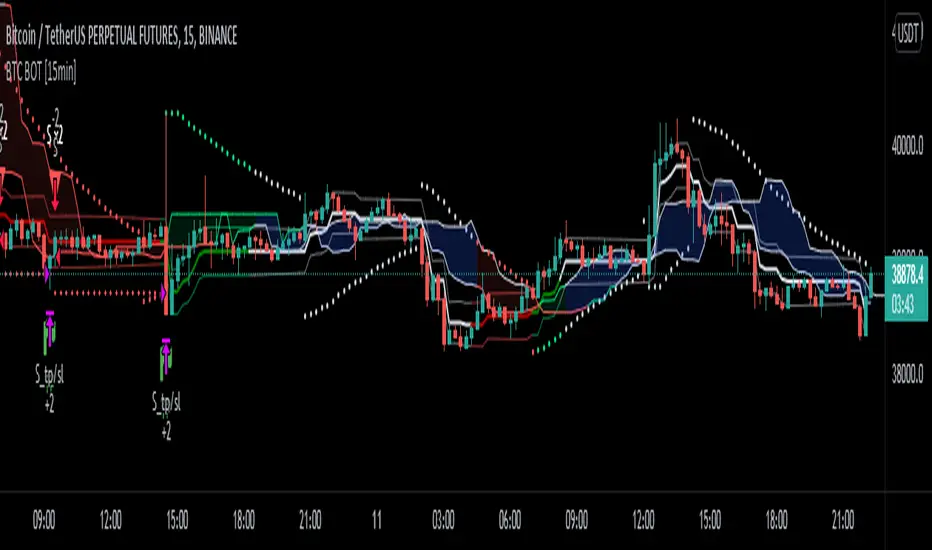
BTC Bot [15min] with AlertsThis is the Alert version of my BTC Bot {15min} Strategy.
This BOT is specialy designed for BTCUSDT 15 min Chart. It reacts to every Upward/Downward direction as fast as possible. It does not work well on higher time frame.
This BOT using 10 indicators to open a basic LONG/SHORT position.
1. CLOUD
2. TREND DETECTOR
3. TREND STRENGTH
4. PARABOLIC SAR
5. JMA
6. RANGE FILTER
7. ADX
8. TWAP TREND
9. FAST MA
10. MOMENTUM
This BOT also use 02 independent strategies for entering positions.
1. REVESALS ( RSI Crossovers)
2. SCALPING (It can increase net profit but it can be risky)
ADX is the main component of this BOT.
This is purely BTC 15min strategy but this BOT could be easily convert into Altcoins Scalper.

BTC BOT [15min]This BOT is specialy designed for BTCUSDT 15 min Chart. It reacts to every Upward/Downward direction as fast as possible. It does not work well on higher time frame.
This BOT using 10 indicators to open a basic LONG/SHORT position.
1. CLOUD
2. TREND DETECTOR
3. TREND STRENGTH
4. PARABOLIC SAR
5. JMA
6. RANGE FILTER
7. ADX
8. TWAP TREND
9. FAST MA
10. MOMENTUM
This BOT also use 02 independent strategies for entering positions.
1. REVESALS (RSI Crossovers)
2. SCALPING (It can increase net profit but it can be risky)
ADX is the main component of this BOT.
This is purely BTC 15min strategy but this BOT could be easily convert into Altcoins Scalper.
Chanu Delta RSIThis Chanu Delta RSI indicates the strength of the Bitcoin market. The problem with the previous Chanu Delta Indicator was that it was simply based on the price difference between the two Bitcoin markets, so there was no universality. However, this new Chanu Delta RSI solves the problem by introducing an RSI that compares the price difference trend.
This indicator is selectable from both reference and large amplitude BTCUSD markets. I recommend using BYBIT:BTCUSDT for the reference market and COINBASE:BTCUSD for the large amplitude market.
_____________________________________________________________
이 지표는 비트코인 시장의 단기적인 추세를 판단하는데 도움을 줄 수 있습니다. 기존 Chanu Delta 지표의 문제점은 단순히 두 비트코인 시장의 가격차를 기준으로 하여 보편성이 없었다는 점이다. 하지만 이번 새로운 Chanu Delta RSI는 가격차이 추세를 비교하는 RSI를 도입해 문제를 해결했습니다.
이 지표는 레퍼런스 및 큰 진폭 BTCUSD 시장에서 모두 선택할 수 있습니다. 레퍼런스 시장에는 BYBIT:BTCUSDT를 사용하고 큰 진폭 시장에는 COINBASE:BTCUSD를 사용하는 것이 좋습니다.
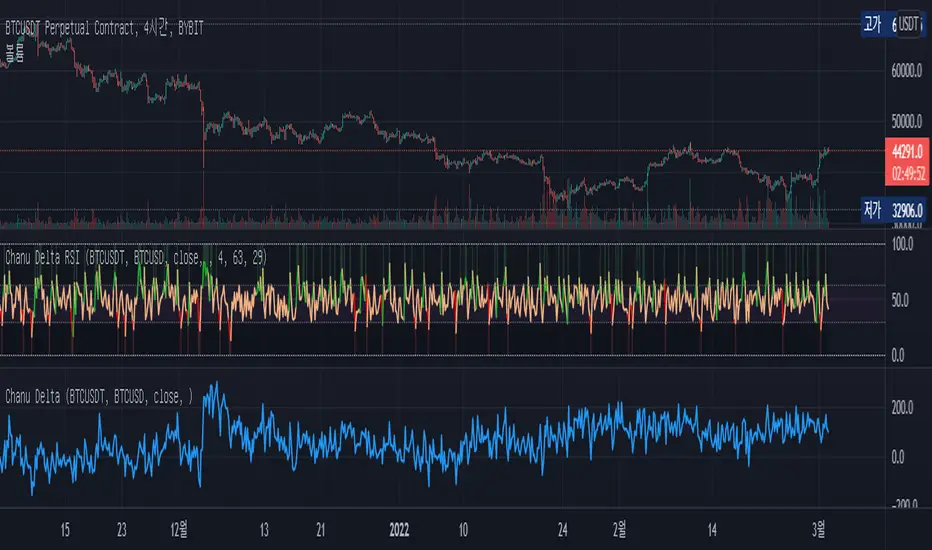
Chanu Delta RSI StrategyThis strategy is built on the Chanu Delta RSI , which indicates the strength of the Bitcoin market. The problem with the previous Chanu Delta Strategy was that it was simply based on the price difference between the two Bitcoin markets, so there was no universality. However, this new Chanu Delta RSI strategy solves the problem by introducing an RSI that compares the price difference trend.
When the Chanu Delta RSI hits “Bull Level” and “Bear Level” and closes the candle, long and short signals are triggered respectively. The example shown on the screen is a default setting optimized for a 4-hour candlestick strategy based on the Bybit BTCUSDT futures market. You can use it by adjusting the setting value and modifying it to suit you.
This strategy is selectable from both reference and large amplitude BTCUSD markets in order to enable fine backtesting. I recommend using BYBIT:BTCUSDT for the reference market and COINBASE:BTCUSD for the large amplitude market.
(Note) Using the "Chanu Delta RSI" to know the current indicator value in real time, it is convenient to predict the signal of the strategy.
(Note) Because the Chanu Delta RSI represents the price difference based on the Bybit BTCUSDT futures market, backtesting is possible from March 2020.
_____________________________________________________________
이 전략은 비트코인 시장의 강점을 나타내는 Chanu Delta RSI를 기반으로 합니다. 기존 Chanu Delta 전략의 문제점은 단순히 두 비트코인 시장의 가격차를 기준으로 하여 보편성이 없었다는 점이다. 하지만 이번 새로운 Chanu Delta RSI 전략은 가격차이 추세를 비교하는 RSI를 도입해 문제를 해결했습니다.
Chanu Delta RSI가 "Bull Level"과 "Bear Level"에 도달하고 봉마감하면 롱, 숏 신호가 각각 트리거됩니다. 화면에 보이는 예시는 Bybit BTCUSDT 선물 시장을 기반으로 한 4시간 캔들스틱 전략에 최적화된 기본 설정입니다. 설정값을 조정하여 자신에게 맞게 수정하여 사용하시면 됩니다.
이 전략은 정밀한 백테스팅을 가능하게 하기 위해 참조 및 큰 진폭 BTCUSD 시장에서 모두 선택할 수 있습니다. 참조 시장에는 BYBIT:BTCUSDT를 사용하고 큰 진폭 시장에는 COINBASE:BTCUSD를 사용하는 것이 좋습니다.
(주) "Chanu Delta RSI"를 이용하여 현재 지표 값을 실시간으로 알 수 있어 전략의 시그널을 예측하는데 편리합니다.
(주) Chanu Delta RSI는 바이비트 BTCUSDT 선물시장을 기준으로 가격차이를 나타내므로 2020년 3월부터 백테스팅이 가능합니다.

Btcusdt - 4hr Trendreversal algoritmeIn this strategy we use a combination of differents indicators to catch the highs and lows and follow the right direction at all times.
The conditions of this 4hr algo are based on Ema's and WMA's that rise or fall:
Momentum;
Price Action
Volume
RSI
BB
I have backtested the algo for 2 years before i ran it live. I ran the algo live for 1 year now and ( October 2020) as for now the algo indicates a trend reversal 70-80% correctly.
The backtest result shown started from 01-10-2017and is simulated using 15% of the capital on BINANCE:BTCUSDT
I have varies Algo's on different Timeframes. If you're interested sent me a message.
Please be aware that past results are no guarantee for future performance!

Automated Bitcoin (BTC) Investment Strategy from Wunderbit Automated Bitcoin (BTC) Investment Strategy from Wunderbit Trading
This strategy is designed for the automated long-term investment in Bitcoin. The BTC investment strategy is primarily suitable for long-term investors who want to increase the percentage of their investments through timely trading long-term transactions. The main feature is the difference from the indicator of long-term investment. Based on their statistics, this figure is 2 times less. That is, if we just bought Bitcoin and held it, we would receive 2 times less than if we applied the BTC Investment strategy.
This strategy uses the intersection of the triple exponential moving average and the least squares moving average. We also control the profit you will make during an uptrend by implementing a trailing stop based on the ATR indicator.
This is a spot market-only strategy and can be used primarily for long-term investors. The strategy is designed to create an automatic version of investing using a webhook.
Automation allows you to safely ignore the state of your portfolio and exclude emotions.
In order to create a cryptocurrency bot for this strategy, you need to:
1. Create alerts and link the URL to the webhook.
2. Connect the TradingView strategy with automated trading service.

OPAL - ZoroToday I present you a good old script for Price Action analysis & Key levels spotting.
This indicator include : 4 pivots validation scripts on different scales (two for Zig-Zags, one for H/L Spotting, one for Support and Resistances drawing)
1) Dual Zig-Zags] = combination of 2 Zig-Zags draws inner and outer price waves, great for Elliott Waves counts
Faster Zig-Zag is set by default to 3 candles confirmations then it will start a new wave
Slower Zig-Zag is set by default to 15 candles confirmations then it will start a new wave
2) H/L Spotter] = prints Higher-Highs/Higher-Lows for bullish Price Action / Lower-Highs/Lower-Lows for bearish Price Action
Default settings of 2 candles confirmations (periods) reduces lag making it a very fast way to spot high and low movements, each time 2 successive candles respects the last high or low
If Period is set to 1, it will print each counter-trend closes (more levels)
"Right" and "Left" are used for lookbacks, by default 1
Options :
-Show HH/HL/LH/LL labels
-Show HH/HL/LH/LL prices
-Draw Support/Resistance line when a pivot is found, until a new pivot is found in the same direction, great to visualize when a candle close above or below last highs or lows.
3) Supports/Resistances extensions] = calculates its own pivots from differents settings, and extends last 10 pivots (5 highs, 5 lows)
Everything is customizable, all the pivots settings are unlocked
Prices often pullback on naked H/L (naked = untested), thoses levels are powerfull on high timeframes, and such a great tool to make a trading plan.
A great combination for both Smart Money concepts and Elliot Waves trading, on short or high timeframes;
The purpose is to help lazy traders (like me) visualize Market Structures and key levels easier;
Pretty reliable on high timeframes, especially on crypto bull markets.
I strongly believe that candles and prices are the best indicator, there is no lag in Price Action.
Making a plan, sticking to the plan, a strong way to find peace.
Wishing you success !
<o/ This indicator is a gift for the community

Up & Down Trend following trading strategy for BTC/USDT 3hThis strategy is based on multi time frame technical indicators such as;
1. RSI (10,50,100)
2. MFI (10,50,100)
3. RVI (10,50,100)
4. BOP (10,50,100)
5. Super Trend
6. SAR indicator
7. Higher highs and lower lows
8. SMA (9,500)
9. EMA (9,200)
After evaluating different parameters provided by those indicators, script is in a possition to determine optimul positions to enter in to market as well as exit from the market. In some cases stratergy will exit fully or partially depends on the situation. Other than that, this strategy is in a possition to calculate and specify the quantity you need to buy or sell depending on market situation. You can specify amount available for investment and how many times you are going to average (if downtrend). Parameters are optimised to BTC/USDT, 3h standerd candlestic chart.
goodluck

ROC vs BTCThis is a modification of my Rate of Change Percentile script, used to compare the current ticker (e.g. Altcoins) to BTC.
Essentially we are looking at (Current Ticker ROC percentile) vs (Bitcoin ROC percentile).
In other words, we are using the ROC value of both the current ticker and BTC, and ranking each based on their previous ROC.
We compare the rankings to gauge the relative overperformance or underperformance of the current ticker vs BTC.
The blue line is BTC, the columns are the current ticker.
Green columns above the blue line indicate positive ROC and current ticker has higher ROC ranking than BTC.
Red columns below the blue line indicate negative ROC and current ticker has a higher ROC ranking than BTC.
*** PLEASE LEAVE A LIKE AND FOLLOW IF YOU ENJOY THE SCRIPT ***
Any questions, comments or feedback I'd love to hear from you below!

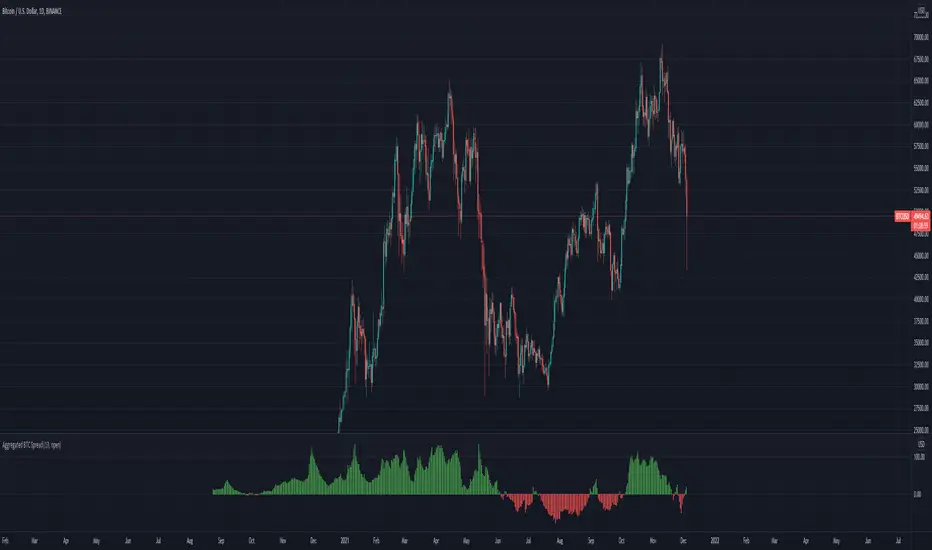
Aggregated BTC SpreadThis script is used to aggregate the bitcoin spread on futures contracts on different platforms.
It works by averaging the for every selected exchange, and apply an EMA of .
It is supporting
Binance (USD / USDT)
Okex
FTX
Huobi
Deribit
Ascendex
CME (BTC1!)
Simple EMA Crossing Strategy TradeMathSimple EMA Crossing strategy, based on crossover Fast exponential moving average = EMA21 and Slow exponential moving average = EMA55.
Default stop loss is 3%, but you can change it.
Default take profit is 9%, it based on stop loss.
Risk to Reward ratio is 1 to 3.
Strategy was tested on BTCUSDT 1H timeframe and works fine with these parameters.

[Joy] Jasmine Strategy for Bitcoin and CryptoIt is my strategy I use for spot and future trading, mostly for BTCUSD
Notable parameters used:
INDEX:BTCUSD
Data: 2017 - today
Long trade margin/leverage: 8x (50/8 = 6.25)
Short trade margin/leverage: 1x (50/50 = 1)
Commission: 0.075%
Initial Capital: $15, 000
Results:
Net profit: 832.74 %
Buy & Hold: 602.56 %. It beats the buy and hold.
Percent profitability: 88 % . It means 8 out of 10 trades resulted in profits.
Margin Calls: 0 (i.e. Never had a margin call according to backtest from 2017 till today)
Total closes trades: 25
Profit factor: 8.238
Avg Winning Trade: 43.08 %
Largest Winning Trade: 334.85 %
Avg # Bars in Winning Trades: 44 (i.e. 88 days)
Sharpe Ratio: 0.61. A Sharpe ratio under 1.0 is considered sub-optimal. Because of the big swings, I cannot make the Sharpe ratio any better at this time.
Sortino Ratio: 5.153. I think a Sortino ratio of 3.0 or higher is considered excellent. Do your research.
I am using 7.1% stop loss on long trades. However, you can turn off the stop loss and note the profitability remains the same.
Do remember there may be other costs, such as funding costs.
Description:
The strategy hunts for a few market features, namely breakouts, abnormal wicks relative to the body, abnormal volume relative to the candle characteristics, and possible confirmation of all these. It also hunts for more aspects. It gives a relative score of each of the characteristics. Finally, it tries to draw a guesstimate. In the end, it is only a guesstimate. Users see the final outcome (buy/sell etc). The whole logic happens at the background.
The strategy is not to be used for scalping, day trading or swing trading. In other words, it is not suitable for trading in a lower timeframe. It is to be used for Positional Trading For example, if one is trying this for BTCUSD, one may only try this for BTCUSD in a 2day timeframe and not in lower timeframes (such as 4 hours or 1 hour etc.) I am primarily interested in BTC for my research. However, it may be tested on other cryptos as well with varying degrees of results.
Please remember that past performance does not be indicative of future results. Different types of investments involve varying degrees of risk. There can be no assurance that the information referred to directly or indirectly in this strategy will be profitable, equal to any corresponding historical performance level(s), or suitable for you in any form or shape. Market condition changes very fast. Moreover, it would be best if you did not assume that any discussion or information contained here serves as the receipt of, or as a substitute for, personalized investment advice. I am not a financial advisor. I have no qualifications to be a financial advisor. It is only for educational and research purposes. Readers are encouraged to consult with a professional advisor of his/her choosing. Neither I nor my indicators or strategies take any responsibility for any misuse of the information for any actual trading. Even though this strategy did 88% profitability from 2017-2021, it may do poorly and may even be NOT profitable in the future.

RSI & SMA Strategy By DenizIntroduction
It has always been a major challenge to detect the current market price in technical analysis . There are some basic but strong indicators that help us to estimate the next market action. Relative Strength Index and Simple Moving Average indicators were used in this strategy.
This strategy aims to detect the next market action with different calculations & usages of RSI and SMA indicators.
Strategy Features
As per the result of the calculation from RSI and SMA outputs the strategy will decide to go "Long" or "Short" if the directions are changed from long to short the trade will be closed and it's opening new trade as per to the new direction.
Apart from basic "take profit" and "stop" options there is an additional closing trade option named "Long/Short Bar Count". If the trade could not reach the target in a certain period, it will look for a quit with a 0 loss.
Advantages
Informative alarm messages.
High ratio of Profitable trade numbers.
Disadvantages
Less trade count.

[CP]Pivot Boss Floor Pivots with ATR Dilation and Dynamic LevelsINTRODUCTION:
Compared to all the Pivot Indicators available on Trading View Public Library, this Floor Pivots Indicator differentiates itself in two major original ways:
Dilates the Pivot Support/Resistance Levels into Support/Resistance Bands based on volatility
Displays the S/R Levels Dynamically , that is, only those levels will be shown that are close enough to the price resulting in much cleaner looking charts.
There were a few features whose logic I had figured out, but I could not implement them due Pine Script’s Limitation (they should really work on increasing Pine Script’s capacity instead of adding more and more features to the language in order to make it look ‘better’):
Showing multiple timeframe pivots at the same time (not possible due to Pine Script’s limitation on the ‘Max Number of Outputs’ )
Automatic Detection of highly profitable Double Hot Pivot Zones (DPZ), also due to the ‘Max Number of Outputs’ limit
GENERAL USER INPUTS:
Most of the settings are self-explanatory, however, a few of them need some explanation:
Show Floor Pivots Dynamically – This will turn ON the dynamic pivot levels, please note that this function will work ONLY IN INTRADAY timeframes.
Dynamic Pivot ATR Period – Period over which the ATR value is calculated to show the pivots dynamically.
ATR Threshold for Dynamic Floor Pivots – Simply put, the indicator will start displaying Pivot Levels if they fall within the 2*ATR distance (default value) of the price. You can increase this number if the volatility increases and vice-versa.
Use ATR to Dilate Intraday Pivot Levels – This will turn ON Floor Pivot Dilation, turning pivot ‘lines’ into ‘bands’ .
ATR Dilation Factor – This number decides the width of the Pivot bands. Larger this number, thicker the bands. Typically, high volatility stocks will require a higher number.
ATR Period – Same as Dynamic Pivot ATR Period, but for Pivot Level Dilation.
INDICATOR USAGE EXAMPLES:
This indicator works great in conjunction with my Pivot Boss Candlestick Scanner indicator.
There are a lot of optimizations I have done in the code, although it looks trivial at first glance, but it's fairly complex.
Feel free to use it and modify it as you wish.
Here are a few examples where the indicator has shown great entries and exits, with the default settings:
NIFTY 5m Chart
Reliance 5m Chart
Tesla 5m Chart
Bitcoin-USDT 15m Chart
FINAL WORDS:
Please understand that I have Cherry Picked the examples to showcase the capability of the indicator and its usage.
DO NOT conflate the accuracy of examples with the accuracy of this indicator.
Once you start using floor pivots, you will realize that a lot of days simply don’t give any high probability setups and you will simply sit out of the market and do nothing (which is a good thing).
If you really want to learn how to use Pivots, read the book ’Secrets of a Pivot Boss’ . This book can change your life.

AI Crypto Signals BTCUSD 15m Ultimate ScriptBYBIT:BTCUSD
Hello everyone! Sky First Capital in partnership with AI Crypto Signals is proud to introduce the AI Crypto Signals 15M BTCUSD Ultimate Script . This script works well on the 15M, 30M, 45M and 1HR chart using traditional candles. This means no false data or inaccurate entry/exit points such as with the ones using HA candles.
The script is based upon an initial strategy developed by user Bunghole here on TradingView, but we have optimized it, back-tested it with ideal settings, and added alerts that you can use to connect with your trading bot such as Alertatron, Cornix, etc. This script uses BB (Bollinger Bands) and RSI (Relative Strength Index) as indicators for signals.
Back-testing data for the 15M chart from 7/1/2021 to 10/15/2021 showed a 51.19% profit.
Back-testing data for the 1HR chart from 7/1/2021 to 10/15/2021 showed a 191% profit.
This script does not repaint.
Ideal use is to enter and exit at the close of the candle and take-profit/stop-loss once per candle.
This script has Entry/Exit/Take-Profit/Stop-Loss alerts.
We offer consulting and training services if you need help on using this script or getting it configured with an automated trading system.
We offer a 24 hour free trial of the script, send us a message to request access.

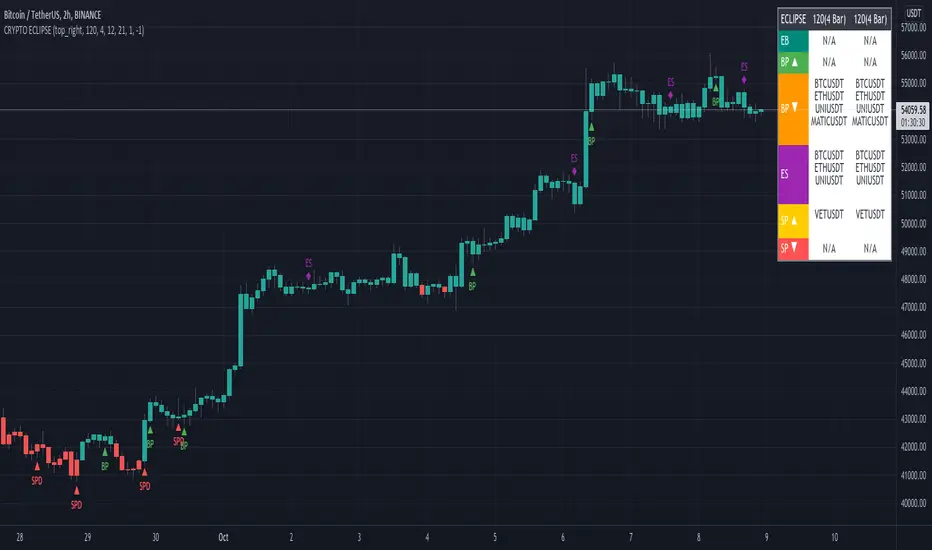
CRYPTO ECLIPSEWelcome to CRYPTO ECLIPSE!
If you see the market as a game between buyers and sellers, CRYPTO ECLIPSE is the EASY MODE.
Don't believe in any word I wrote, but please don't doubt about it until you TEST IT. Just go ahead and take your own conclusions, maybe this script changes your life, like it changed mine.
What would be like if you could see the markets through the eyes of a trader with many years of experience? (and If you are already this trader, you could add this as a live second opnion)
Imagine if you could consistently predcit buyers and sellers actions, attempts and rejections. That's what Price action technical analysis tries, but price action often feels like very subjective and to succeed and learn it, you will probably need at least 4 years of trading, winning and loosing to find consistancy, that's the process. CRYPTO ECLIPSE will show how you will see the market after this years spent, You''ll be skipping this years.
CRYPTO ECLIPSE is a setup that translates the market to you and give you the view of the market as it is, and not only how it was in the past. Differently from almost all other indicators i've seen in my life, CRYPTO ECLIPSE is a setup focused in PREDICT, not REACT. In my opnion that's why indicators not work well, they are too focused in the past, giving late decisions.
Truth be told, it's sounds good, but how do I use it?
I will explain you the main features, what you need to do is: Take some time to learn it, mess with the configs. Until you see the chart as you believe is the best predict scenario for the past, and then just sit and see how it will keep predicting the next moviments. Well, it works for me :)
Why am I renting this setup?
I am not. This is made for you to test for free, and for those who this setup makes all sense, we will build a small comunity around it. Just watch as we go, or Join us.
Before I forget, the setup is also a screener to track the 6 conditions above in the last 1-5 periods.
Main Features description:
BAR COLOR 2 = Strong Buyers domain(Candle's color)
BAR COLOR 3 = Strong Sellers domain(Candle's color)
BAR COLOR 0 e 1 = Fine Tuning(Advanced) There are 3 main ways to use it:
-Standard, following the same 2 and 3 bar colors.
-Changing both 0 and 1 bar colors. You can use Orange or pink or white colors for both 0 and 1, or other any color, try to use one that does not match with green or red for distinction. Consider the 0 and 1 bars as trend changing in course, or the breath of the market before a trend continuation (pullback).
Another option, that's indicated for Professionals only: change bar zero to dark green and 1 to a lighter red. This way you will see the gain and loose game in real time, take some time and you will see dark red going to lighter red will indicate a seller's weakness and the oposite for the buyers. If you are already a PRO, go ahead and play with these 2 options.
BP= STRONG BUYERS DOMAN
BPD= STRONG BUYERS DOMAN DECREASING
SP= STRONG SELLERS DOMAN
SPD= STRONG SELLERS DOMAN DECREASING
EB= POSSIBLE EARLY BUYERS DOMAIN SIGNAL
ES= POSSIBLE EARLY SELLERS DOMAIN SIGNAL
Note that BPD AND SPD are the same as EB and ES, I made this as a double entries so we can combine two different periods. If you look close you'll learn that the periods are related to the range of past periods you want to consider.
IF you pick a low period, it will show more signals, and it willl be more sensitive to the market changes. All the signals are real things that happened there, you will see that there was always a pullback or a consolidation, since this is very sensitive it's better to traders who want what's happening all the time
If you pick a high period, it will show less signals and with significant and strong movement, there are no guesses in this signals, if it did not proceed with a strong moviment, the opposite forces rejected their attempt.
Fit to your market point of view: Mess with the period numbers until you see the signals(arrows) where you understand is the best place to take a trade in the past, and watch it repeat the alert for you in the future, same as bar colors.
Note: If you want to enter only with big movements signals, use Stronger signals and high periods. if you want to try to get the movement begin, go with the early signals, using short periods.
Play with the configs until the chart give you the confidence you want to have to trade your money.
I don't recomend to use it with many indicators, if you add more than one indicator with this, you are probably insecure, and this will be useless to you.
But go ahead and add a trend indicator, if you are a trend trader or a oscillator, if you are a oscillator guy... Whatever you need until you feel confident.
Alway remember, this is only a tool. it's your decision, this is not a buy/sell indicator (maybe in the future), this is a tool to read the market. Always trade SPOT never FUTURES, always keep your stop loss as close as you can.
Enjoy the ECLIPSE
Crypto Scannner for Traffic Lights StrategyI allways try to make trading easier. Developing Scripts for a quick backtest and improvement of a strategy, getting alerts for entry and exit a position. Loading data to a spreadsheet is also important and takes time.
In this case finding good parameters in different markets or assets to enter in a position, is a bit exhausting. It is something you have to do everyday, and sometimes in different moments of the day.
So I manage to develop a Screener, to take a quick look at specific hours, and tell if I have a buy or sell condition in an specific asset. Obviously this is not an alert to make a trade instantaneusly, but this help you filter a lot of information in matters of seconds. Then open those specific charts and make a better analisys.
A few weeks ago, I published a scrpipt called "Traffic Lights Strategy", that uses 4 emas to get a buy or a sell condition.
It is easy to understand and use, but if you don´t want to missed some opportunities, and don't want to be look at the screen in all the time looking for them, I have here a simple solution.
This script works plotting 2 labels. The first one plots all the assets in which the condition is true (fastema > medema > slowema > filterema or fastema < medema < slowema < filterema)
The second one plots the assets were the condition is true only if happened up to 5 candles back, so you can be in time to enter a trade.
You can take the script and customize it for a different strategy or assets. I coded like this because I backtested this strategy in this specific assets, and statistics suggest that it might be profitable.
I hope this works for you. In other time I'll try to code a script for the others strategies I published.
