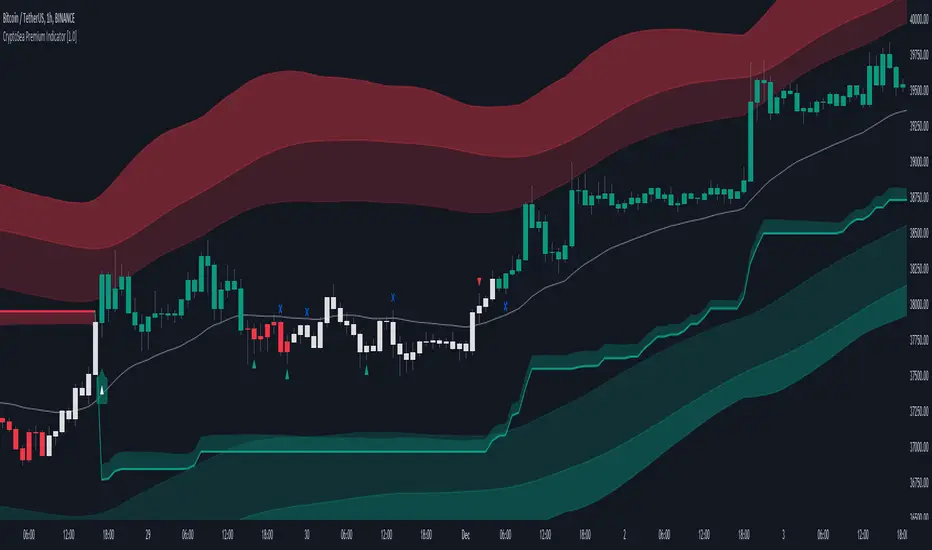
CryptoSea Premium IndicatorCryptoSea Premium Indicator: Enhanced Trading Precision through Advanced Integration
The CryptoSea Premium Indicator is designed to equip traders with a sophisticated tool that synthesizes traditional and modern analytical methods. By integrating proven technical tools with custom enhancements, it aims to provide a deeper, more actionable insight into market dynamics, enhancing the analysis and decision-making process for traders.
Integration and Unique Features:
Support and Resistance Dynamics: Leveraging a blend of standard deviation and moving averages akin to the methodology of Bollinger Bands, this feature dynamically identifies potential market pivot points. It calculates these points based on historical price volatility, which serves as a probabilistic guide to potential price movements, rather than a definitive prediction.
Trend Reversals and Continuations: This function integrates the Relative Strength Index (RSI) with a custom-tailored trend filter that employs shorter cycle moving averages to refine the traditional use of RSI. This enhancement is designed to pinpoint more accurate entry and exit points during trend phases by filtering out market noise and focusing on significant movements, though it does not ensure the avoidance of all false signals.
Smart Trail Closure and New Trends: Utilizing the Average True Range (ATR), this advanced feature dynamically adjusts stop-loss settings according to changes in market volatility. This adaptation seeks to better align stop-loss orders with current market realities, helping to protect against sudden market shifts while allowing traders to capitalize on new trends as they emerge.
Ranging Signals: By employing dual moving averages that calculate the upper and lower bounds of price movements, this feature refines the approach to range-bound trading. It uses statistical measures to adjust these bands in real-time based on the latest market data, enhancing traders' ability to make informed decisions during lateral market movements.
Dynamic Candles: This feature colors candles based on a complex algorithm that assesses immediate price action within the context of longer-term trends. This visual tool aims to simplify market sentiment analysis by providing intuitive color-coded feedback on the prevailing market conditions, thereby assisting traders in quickly assessing the market environment.
Scalping Signals: Generated by a high-frequency trading algorithm that scrutinizes short-term price fluctuations, these signals are designed to aid traders in making swift, informed trading decisions in fast-paced market conditions. They optimize the identification of micro-trends and potential reversal points essential for scalping strategies, though they do not guarantee success in every trade.
Originality and Practical Application:
Each component of the CryptoSea Premium Indicator is carefully selected and integrated to offer a tool that enhances more than the sum of its parts. This integration provides a comprehensive and nuanced view of the market, aiding traders in navigating complex market dynamics more effectively than traditional, single-function indicators.
Disclaimer and Usage Tips:
Trading involves risks. The CryptoSea Premium Indicator should be used as one of several tools in a comprehensive trading strategy. It is intended to supplement, not replace, thorough market analysis and personal due diligence. Past performance is not indicative of future results, and no claims are made regarding the guaranteed accuracy of provided signals.
BTCUSDT
Bitcoin 5A Strategy@LilibtcIn our long-term strategy, we have deeply explored the key factors influencing the price of Bitcoin. By precisely calculating the correlation between these factors and the price of Bitcoin, we found that they are closely linked to the value of Bitcoin. To more effectively predict the fair price of Bitcoin, we have built a predictive model and adjusted our investment strategy accordingly based on this model. In practice, the prediction results of this model correspond quite high with actual values, fully demonstrating its reliability in predicting price fluctuations.
When the future is uncertain and the outlook is unclear, people often choose to hold back and avoid risks, or even abandon their original plans. However, the prediction of Bitcoin is full of challenges, but we have taken the first step in exploring.
Table of contents:
Usage Guide
Step 1: Identify the factors that have the greatest impact on Bitcoin price
Step 2: Build a Bitcoin price prediction model
Step 3: Find indicators for warning of bear market bottoms and bull market tops
Step 4: Predict Bitcoin Price in 2025
Step 5: Develop a Bitcoin 5A strategy
Step 6: Verify the performance of the Bitcoin 5A strategy
Usage Restrictions
🦮Usage Guide:
1. On the main interface, modify the code, find the BTCUSD trading pair, and select the BITSTAMP exchange for trading.
2. Set the time period to the daily chart.
3. Select a logarithmic chart in the chart type to better identify price trends.
4. In the strategy settings, adjust the options according to personal needs, including language, display indicators, display strategies, display performance, display optimizations, sell alerts, buy prompts, opening days, backtesting start year, backtesting start month, and backtesting start date.
🏃Step 1: Identify the factors that have the greatest impact on Bitcoin price
📖Correlation Coefficient: A mathematical concept for measuring influence
In order to predict the price trend of Bitcoin, we need to delve into the factors that have the greatest impact on its price. These factors or variables can be expressed in mathematical or statistical correlation coefficients. The correlation coefficient is an indicator of the degree of association between two variables, ranging from -1 to 1. A value of 1 indicates a perfect positive correlation, while a value of -1 indicates a perfect negative correlation.
For example, if the price of corn rises, the price of live pigs usually rises accordingly, because corn is the main feed source for pig breeding. In this case, the correlation coefficient between corn and live pig prices is approximately 0.3. This means that corn is a factor affecting the price of live pigs. On the other hand, if a shooter's performance improves while another shooter's performance deteriorates due to increased psychological pressure, we can say that the former is a factor affecting the latter's performance.
Therefore, in order to identify the factors that have the greatest impact on the price of Bitcoin, we need to find the factors with the highest correlation coefficients with the price of Bitcoin. If, through the analysis of the correlation between the price of Bitcoin and the data on the chain, we find that a certain data factor on the chain has the highest correlation coefficient with the price of Bitcoin, then this data factor on the chain can be identified as the factor that has the greatest impact on the price of Bitcoin. Through calculation, we found that the 🔵number of Bitcoin blocks is one of the factors that has the greatest impact on the price of Bitcoin. From historical data, it can be clearly seen that the growth rate of the 🔵number of Bitcoin blocks is basically consistent with the movement direction of the price of Bitcoin. By analyzing the past ten years of data, we obtained a daily correlation coefficient of 0.93 between the number of Bitcoin blocks and the price of Bitcoin.
🏃Step 2: Build a Bitcoin price prediction model
📖Predictive Model: What formula is used to predict the price of Bitcoin?
Among various prediction models, the linear function is the preferred model due to its high accuracy. Take the standard weight as an example, its linear function graph is a straight line, which is why we choose the linear function model. However, the growth rate of the price of Bitcoin and the number of blocks is extremely fast, which does not conform to the characteristics of the linear function. Therefore, in order to make them more in line with the characteristics of the linear function, we first take the logarithm of both. By observing the logarithmic graph of the price of Bitcoin and the number of blocks, we can find that after the logarithm transformation, the two are more in line with the characteristics of the linear function. Based on this feature, we choose the linear regression model to establish the prediction model.
From the graph below, we can see that the actual red and green K-line fluctuates around the predicted blue and 🟢green line. These predicted values are based on fundamental factors of Bitcoin, which support its value and reflect its reasonable value. This picture is consistent with the theory proposed by Marx in "Das Kapital" that "prices fluctuate around values."
The predicted logarithm of the market cap of Bitcoin is calculated through the model. The specific calculation formula of the Bitcoin price prediction value is as follows:
btc_predicted_marketcap = math.exp(btc_predicted_marketcap_log)
btc_predicted_price = btc_predicted_marketcap / btc_supply
🏃Step 3: Find indicators for early warning of bear market bottoms and bull market tops
📖Warning Indicator: How to Determine Whether the Bitcoin Price has Reached the Bear Market Bottom or the Bull Market Top?
By observing the Bitcoin price logarithmic prediction chart mentioned above, we notice that the actual price often falls below the predicted value at the bottom of a bear market; during the peak of a bull market, the actual price exceeds the predicted price. This pattern indicates that the deviation between the actual price and the predicted price can serve as an early warning signal. When the 🔴 Bitcoin price deviation is very low, as shown by the chart with 🟩green background, it usually means that we are at the bottom of the bear market; Conversely, when the 🔴 Bitcoin price deviation is very high, the chart with a 🟥red background indicates that we are at the peak of the bull market.
This pattern has been validated through six bull and bear markets, and the deviation value indeed serves as an early warning signal, which can be used as an important reference for us to judge market trends.
🏃Step 4:Predict Bitcoin Price in 2025
📖Price Upper Limit
According to the data calculated on February 25, 2024, the 🟠upper limit of the Bitcoin price is $194,287, which is the price ceiling of this bull market. The peak of the last bull market was on November 9, 2021, at $68,664. The bull-bear market cycle is 4 years, so the highest point of this bull market is expected in 2025. That is where you should sell the Bitcoin. and the upper limit of the Bitcoin price will exceed $190,000. The closing price of Bitcoin on February 25, 2024, was $51,729, with an expected increase of 2.7 times.
🏃Step 5: Bitcoin 5A Strategy Formulation
📖Strategy: When to buy or sell, and how many to choose?
We introduce the Bitcoin 5A strategy. This strategy requires us to generate trading signals based on the critical values of the warning indicators, simulate the trades, and collect performance data for evaluation. In the Bitcoin 5A strategy, there are three key parameters: buying warning indicator, batch trading days, and selling warning indicator. Batch trading days are set to ensure that we can make purchases in batches after the trading signal is sent, thus buying at a lower price, selling at a higher price, and reducing the trading impact cost.
In order to find the optimal warning indicator critical value and batch trading days, we need to adjust these parameters repeatedly and perform backtesting. Backtesting is a method established by observing historical data, which can help us better understand market trends and trading opportunities.
Specifically, we can find the key trading points by watching the Bitcoin price log and the Bitcoin price deviation chart. For example, on August 25, 2015, the 🔴 Bitcoin price deviation was at its lowest value of -1.11; on December 17, 2017, the 🔴 Bitcoin price deviation was at its highest value at the time, 1.69; on March 16, 2020, the 🔴 Bitcoin price deviation was at its lowest value at the time, -0.91; on March 13, 2021, the 🔴 Bitcoin price deviation was at its highest value at the time, 1.1; on December 31, 2022, the 🔴 Bitcoin price deviation was at its lowest value at the time, -1.
To ensure that all five key trading points generate trading signals, we set the warning indicator Bitcoin price deviation to the larger of the three lowest values, -0.9, and the smallest of the two highest values, 1. Then, we buy when the warning indicator Bitcoin price deviation is below -0.9, and sell when it is above 1.
In addition, we set the batch trading days as 25 days to implement a strategy that averages purchases and sales. Within these 25 days, we will invest all funds into the market evenly, buying once a day. At the same time, we also sell positions at the same pace, selling once a day.
📖Adjusting the threshold: a key step to optimizing trading strategy
Adjusting the threshold is an indispensable step for better performance. Here are some suggestions for adjusting the batch trading days and critical values of warning indicators:
• Batch trading days: Try different days like 25 to see how it affects overall performance.
• Buy and sell critical values for warning indicators: iteratively fine-tune the buy threshold value of -0.9 and the sell threshold value of 1 exhaustively to find the best combination of threshold values.
Through such careful adjustments, we may find an optimized approach with a lower maximum drawdown rate (e.g., 11%) and a higher cumulative return rate for closed trades (e.g., 474 times). The chart below is a backtest optimization chart for the Bitcoin 5A strategy, providing an intuitive display of strategy adjustments and optimizations.
In this way, we can better grasp market trends and trading opportunities, thereby achieving a more robust and efficient trading strategy.
🏃Step 6: Validating the performance of the Bitcoin 5A Strategy
📖Model interpretability validation: How to explain the Bitcoin price model?
The interpretability of the model is represented by the coefficient of determination R squared, which reflects the degree of match between the predicted value and the actual value. I divided all the historical data from August 18, 2015 into two groups, and used the data from August 18, 2011 to August 18, 2015 as training data to generate the model. The calculation result shows that the coefficient of determination R squared during the 2011-2015 training period is as high as 0.81, which shows that the interpretability of this model is quite high. From the Bitcoin price logarithmic prediction chart in the figure below, we can see that the deviation between the predicted value and the actual value is not far, which means that most of the predicted values can explain the actual value well.
The calculation formula for the coefficient of determination R squared is as follows:
residual = btc_close_log - btc_predicted_price_log
residual_square = residual * residual
train_residual_square_sum = math.sum(residual_square, train_days)
train_mse = train_residual_square_sum / train_days
train_r2 = 1 - train_mse / ta.variance(btc_close_log, train_days)
📖Model stability verification: How to affirm the stability of the Bitcoin price model when new data is available?
Model stability is achieved through model verification. I set the last day of the training period to February 2, 2024 as the "verification group" and used it as verification data to verify the stability of the model. This means that after generating the model if there is new data, I will use these new data together with the model for prediction, and then evaluate the interpretability of the model. If the coefficient of determination when using verification data is close to the previous training one and both remain at a high level, then we can consider this model as stability. The coefficient of determination calculated from the validation period data and model prediction results is as high as 0.83, which is close to the previous 0.81, further proving the stability of this model.
📖Performance evaluation: How to accurately evaluate historical backtesting results?
After detailed strategy testing, to ensure the accuracy and reliability of the results, we need to carry out a detailed performance evaluation on the backtest results. The key evaluation indices include:
• Net value curve: As shown in the rose line, it intuitively reflects the growth of the account net value. By observing the net value curve, we can understand the overall performance and profitability of the strategy.
The basic attributes of this strategy are as follows:
Trading range: 2015-8-19 to 2024-2-18, backtest range: 2011-8-18 to 2024-2-18
Initial capital: 1000USD, order size: 1 contract, pyramid: 50 orders, commission rate: 0.2%, slippage: 20 markers.
In the strategy tester overview chart, we also obtained the following key data:
• Net profit rate of closed trades: as high as 474 times, far exceeding the benchmark, as shown in the strategy tester performance summary chart, Bitcoin buys and holds 210 times.
• Number of closed trades and winning percentage: 100 trades were all profitable, showing the stability and reliability of the strategy.
• Drawdown rate & win-loose ratio: The maximum drawdown rate is only 11%, far lower than Bitcoin's 78%. Profit factor, or win-loose ratio, reached 500, further proving the advantage of the strategy.
Through these detailed evaluations, we can see clearly the excellent balance between risk and return of the Bitcoin 5A strategy.
⚠️Usage Restrictions: Strategy Application in Specific Situations
Please note that this strategy is designed specifically for Bitcoin and should not be applied to other assets or markets without authorization. In actual operations, we should make careful decisions according to our risk tolerance and investment goals.

Bitcoin 5A Strategy - Price Upper & Lower Limit@LilibtcIn our long-term strategy, we have deeply explored the key factors influencing the price of Bitcoin. By precisely calculating the correlation between these factors and the price of Bitcoin, we found that they are closely linked to the value of Bitcoin. To more effectively predict the fair price of Bitcoin, we have built a predictive model and adjusted our investment strategy accordingly based on this model. In practice, the prediction results of this model correspond quite high with actual values, fully demonstrating its reliability in predicting price fluctuations.
When the future is uncertain and the outlook is unclear, people often choose to hold back and avoid risks, or even abandon their original plans. However, the prediction of Bitcoin is full of challenges, but we have taken the first step in exploring.
Table of contents:
Usage Guide
Step 1: Identify the factors that have the greatest impact on Bitcoin price
Step 2: Build a Bitcoin price prediction model
Step 3: Find indicators for warning of bear market bottoms and bull market tops
Step 4: Predict Bitcoin Price in 2025
Step 5: Develop a Bitcoin 5A strategy
Step 6: Verify the performance of the Bitcoin 5A strategy
Usage Restrictions
🦮Usage Guide:
1. On the main interface, modify the code, find the BTCUSD trading pair, and select the BITSTAMP exchange for trading.
2. Set the time period to the daily chart.
3. Select a logarithmic chart in the chart type to better identify price trends.
4. In the strategy settings, adjust the options according to personal needs, including language, display indicators, display strategies, display performance, display optimizations, sell alerts, buy prompts, opening days, backtesting start year, backtesting start month, and backtesting start date.
🏃Step 1: Identify the factors that have the greatest impact on Bitcoin price
📖Correlation Coefficient: A mathematical concept for measuring influence
In order to predict the price trend of Bitcoin, we need to delve into the factors that have the greatest impact on its price. These factors or variables can be expressed in mathematical or statistical correlation coefficients. The correlation coefficient is an indicator of the degree of association between two variables, ranging from -1 to 1. A value of 1 indicates a perfect positive correlation, while a value of -1 indicates a perfect negative correlation.
For example, if the price of corn rises, the price of live pigs usually rises accordingly, because corn is the main feed source for pig breeding. In this case, the correlation coefficient between corn and live pig prices is approximately 0.3. This means that corn is a factor affecting the price of live pigs. On the other hand, if a shooter's performance improves while another shooter's performance deteriorates due to increased psychological pressure, we can say that the former is a factor affecting the latter's performance.
Therefore, in order to identify the factors that have the greatest impact on the price of Bitcoin, we need to find the factors with the highest correlation coefficients with the price of Bitcoin. If, through the analysis of the correlation between the price of Bitcoin and the data on the chain, we find that a certain data factor on the chain has the highest correlation coefficient with the price of Bitcoin, then this data factor on the chain can be identified as the factor that has the greatest impact on the price of Bitcoin. Through calculation, we found that the 🔵 number of Bitcoin blocks is one of the factors that has the greatest impact on the price of Bitcoin. From historical data, it can be clearly seen that the growth rate of the 🔵 number of Bitcoin blocks is basically consistent with the movement direction of the price of Bitcoin. By analyzing the past ten years of data, we obtained a daily correlation coefficient of 0.93 between the number of Bitcoin blocks and the price of Bitcoin.
🏃Step 2: Build a Bitcoin price prediction model
📖Predictive Model: What formula is used to predict the price of Bitcoin?
Among various prediction models, the linear function is the preferred model due to its high accuracy. Take the standard weight as an example, its linear function graph is a straight line, which is why we choose the linear function model. However, the growth rate of the price of Bitcoin and the number of blocks is extremely fast, which does not conform to the characteristics of the linear function. Therefore, in order to make them more in line with the characteristics of the linear function, we first take the logarithm of both. By observing the logarithmic graph of the price of Bitcoin and the number of blocks, we can find that after the logarithm transformation, the two are more in line with the characteristics of the linear function. Based on this feature, we choose the linear regression model to establish the prediction model.
From the graph below, we can see that the actual red and green K-line fluctuates around the predicted blue and 🟢green line. These predicted values are based on fundamental factors of Bitcoin, which support its value and reflect its reasonable value. This picture is consistent with the theory proposed by Marx in "Das Kapital" that "prices fluctuate around values."
The predicted logarithm of the market cap of Bitcoin is calculated through the model. The specific calculation formula of the Bitcoin price prediction value is as follows:
btc_predicted_marketcap = math.exp(btc_predicted_marketcap_log)
btc_predicted_price = btc_predicted_marketcap / btc_supply
🏃Step 3: Find indicators for early warning of bear market bottoms and bull market tops
📖Warning Indicator: How to Determine Whether the Bitcoin Price has Reached the Bear Market Bottom or the Bull Market Top?
By observing the Bitcoin price logarithmic prediction chart mentioned above, we notice that the actual price often falls below the predicted value at the bottom of a bear market; during the peak of a bull market, the actual price exceeds the predicted price. This pattern indicates that the deviation between the actual price and the predicted price can serve as an early warning signal. When the 🔴 Bitcoin price deviation is very low, as shown by the chart with 🟩green background, it usually means that we are at the bottom of the bear market; Conversely, when the 🔴 Bitcoin price deviation is very high, the chart with a 🟥red background indicates that we are at the peak of the bull market.
This pattern has been validated through six bull and bear markets, and the deviation value indeed serves as an early warning signal, which can be used as an important reference for us to judge market trends.
🏃Step 4:Predict Bitcoin Price in 2025
📖Price Upper Limit
According to the data calculated on March 10, 2023(If you want to check latest data, please contact with author), the 🟠upper limit of the Bitcoin price is $132,453, which is the price ceiling of this bull market. The peak of the last bull market was on November 9, 2021, at $68,664. The bull-bear market cycle is 4 years, so the highest point of this bull market is expected in 2025, and the 🟠upper limit of the Bitcoin price will exceed $130,000. The closing price of Bitcoin on March 10, 2024, was $68,515, with an expected increase of 90%.
🏃Step 5: Bitcoin 5A Strategy Formulation
📖Strategy: When to buy or sell, and how many to choose?
We introduce the Bitcoin 5A strategy. This strategy requires us to generate trading signals based on the critical values of the warning indicators, simulate the trades, and collect performance data for evaluation. In the Bitcoin 5A strategy, there are three key parameters: buying warning indicator, batch trading days, and selling warning indicator. Batch trading days are set to ensure that we can make purchases in batches after the trading signal is sent, thus buying at a lower price, selling at a higher price, and reducing the trading impact cost.
In order to find the optimal warning indicator critical value and batch trading days, we need to adjust these parameters repeatedly and perform backtesting. Backtesting is a method established by observing historical data, which can help us better understand market trends and trading opportunities.
Specifically, we can find the key trading points by watching the Bitcoin price log and the Bitcoin price deviation chart. For example, on August 25, 2015, the 🔴 Bitcoin price deviation was at its lowest value of -1.11; on December 17, 2017, the 🔴 Bitcoin price deviation was at its highest value at the time, 1.69; on March 16, 2020, the 🔴 Bitcoin price deviation was at its lowest value at the time, -0.91; on March 13, 2021, the 🔴 Bitcoin price deviation was at its highest value at the time, 1.1; on December 31, 2022, the 🔴 Bitcoin price deviation was at its lowest value at the time, -1.
To ensure that all five key trading points generate trading signals, we set the warning indicator Bitcoin price deviation to the larger of the three lowest values, -0.9, and the smallest of the two highest values, 1. Then, we buy when the warning indicator Bitcoin price deviation is below -0.9, and sell when it is above 1.
In addition, we set the batch trading days as 25 days to implement a strategy that averages purchases and sales. Within these 25 days, we will invest all funds into the market evenly, buying once a day. At the same time, we also sell positions at the same pace, selling once a day.
📖Adjusting the threshold: a key step to optimizing trading strategy
Adjusting the threshold is an indispensable step for better performance. Here are some suggestions for adjusting the batch trading days and critical values of warning indicators:
• Batch trading days: Try different days like 25 to see how it affects overall performance.
• Buy and sell critical values for warning indicators: iteratively fine-tune the buy threshold value of -0.9 and the sell threshold value of 1 exhaustively to find the best combination of threshold values.
Through such careful adjustments, we may find an optimized approach with a lower maximum drawdown rate (e.g., 11%) and a higher cumulative return rate for closed trades (e.g., 474 times). The chart below is a backtest optimization chart for the Bitcoin 5A strategy, providing an intuitive display of strategy adjustments and optimizations.
In this way, we can better grasp market trends and trading opportunities, thereby achieving a more robust and efficient trading strategy.
🏃Step 6: Validating the performance of the Bitcoin 5A Strategy
📖Model accuracy validation: How to judge the accuracy of the Bitcoin price model?
The accuracy of the model is represented by the coefficient of determination R square, which reflects the degree of match between the predicted value and the actual value. I divided all the historical data from August 18, 2015 into two groups, and used the data from August 18, 2011 to August 18, 2015 as training data to generate the model. The calculation result shows that the coefficient of determination R squared during the 2011-2015 training period is as high as 0.81, which shows that the accuracy of this model is quite high. From the Bitcoin price logarithmic prediction chart in the figure below, we can see that the deviation between the predicted value and the actual value is not far, which means that most of the predicted values can explain the actual value well.
The calculation formula for the coefficient of determination R square is as follows:
residual = btc_close_log - btc_predicted_price_log
residual_square = residual * residual
train_residual_square_sum = math.sum(residual_square, train_days)
train_mse = train_residual_square_sum / train_days
train_r2 = 1 - train_mse / ta.variance(btc_close_log, train_days)
📖Model reliability verification: How to affirm the reliability of the Bitcoin price model when new data is available?
Model reliability is achieved through model verification. I set the last day of the training period to February 2, 2024 as the "verification group" and used it as verification data to verify the reliability of the model. This means that after generating the model if there is new data, I will use these new data together with the model for prediction, and then evaluate the accuracy of the model. If the coefficient of determination when using verification data is close to the previous training one and both remain at a high level, then we can consider this model as reliable. The coefficient of determination calculated from the validation period data and model prediction results is as high as 0.83, which is close to the previous 0.81, further proving the reliability of this model.
📖Performance evaluation: How to accurately evaluate historical backtesting results?
After detailed strategy testing, to ensure the accuracy and reliability of the results, we need to carry out a detailed performance evaluation on the backtest results. The key evaluation indices include:
• Net value curve: As shown in the rose line, it intuitively reflects the growth of the account net value. By observing the net value curve, we can understand the overall performance and profitability of the strategy.
The basic attributes of this strategy are as follows:
Trading range: 2015-8-19 to 2024-2-18, backtest range: 2011-8-18 to 2024-2-18
Initial capital: 1000USD, order size: 1 contract, pyramid: 50 orders, commission rate: 0.2%, slippage: 20 markers.
In the strategy tester overview chart, we also obtained the following key data:
• Net profit rate of closed trades: as high as 474 times, far exceeding the benchmark, as shown in the strategy tester performance summary chart, Bitcoin buys and holds 210 times.
• Number of closed trades and winning percentage: 100 trades were all profitable, showing the stability and reliability of the strategy.
• Drawdown rate & win-loose ratio: The maximum drawdown rate is only 11%, far lower than Bitcoin's 78%. Profit factor, or win-loose ratio, reached 500, further proving the advantage of the strategy.
Through these detailed evaluations, we can see clearly the excellent balance between risk and return of the Bitcoin 5A strategy.
⚠️Usage Restrictions: Strategy Application in Specific Situations
Please note that this strategy is designed specifically for Bitcoin and should not be applied to other assets or markets without authorization. In actual operations, we should make careful decisions according to our risk tolerance and investment goals.

Ichimoku Clouds Strategy Long and ShortOverview:
The Ichimoku Clouds Strategy leverages the Ichimoku Kinko Hyo technique to offer traders a range of innovative features, enhancing market analysis and trading efficiency. This strategy is distinct in its combination of standard methodology and advanced customization, making it suitable for both novice and experienced traders.
Unique Features:
Enhanced Interpretation: The strategy introduces weak, neutral, and strong bullish/bearish signals, enabling detailed interpretation of the Ichimoku cloud and direct chart plotting.
Configurable Trading Periods: Users can tailor the strategy to specific market windows, adapting to different market conditions.
Dual Trading Modes: Long and Short modes are available, allowing alignment with market trends.
Flexible Risk Management: Offers three styles in each mode, combining fixed risk management with dynamic indicator states for versatile trade management.
Indicator Line Plotting: Enables plotting of Ichimoku indicator lines on the chart for visual decision-making support.
Methodology:
The strategy utilizes the standard Ichimoku Kinko Hyo model, interpreting indicator values with settings adjustable through a user-friendly menu. This approach is enhanced by TradingView's built-in strategy tester for customization and market selection.
Risk Management:
Our approach to risk management is dynamic and indicator-centric. With data from the last year, we focus on dynamic indicator states interpretations to mitigate manual setting causing human factor biases. Users still have the option to set a fixed stop loss and/or take profit per position using the corresponding parameters in settings, aligning with their risk tolerance.
Backtest Results:
Operating window: Date range of backtests is 2023.01.01 - 2024.01.04. It is chosen to let the strategy to close all opened positions.
Commission and Slippage: Includes a standard Binance commission of 0.1% and accounts for possible slippage over 5 ticks.
Maximum Single Position Loss: -6.29%
Maximum Single Profit: 22.32%
Net Profit: +10 901.95 USDT (+109.02%)
Total Trades: 119 (51.26% profitability)
Profit Factor: 1.775
Maximum Accumulated Loss: 4 185.37 USDT (-22.87%)
Average Profit per Trade: 91.67 USDT (+0.7%)
Average Trade Duration: 56 hours
These results are obtained with realistic parameters representing trading conditions observed at major exchanges such as Binance and with realistic trading portfolio usage parameters. Backtest is calculated using deep backtest option in TradingView built-in strategy tester
How to Use:
Add the script to favorites for easy access.
Apply to the desired chart and timeframe (optimal performance observed on the 1H chart, ForEx or cryptocurrency top-10 coins with quote asset USDT).
Configure settings using the dropdown choice list in the built-in menu.
Set up alerts to automate strategy positions through web hook with the text: {{strategy.order.alert_message}}
Disclaimer:
Educational and informational tool reflecting Skyrex commitment to informed trading. Past performance does not guarantee future results. Test strategies in a simulated environment before live implementation

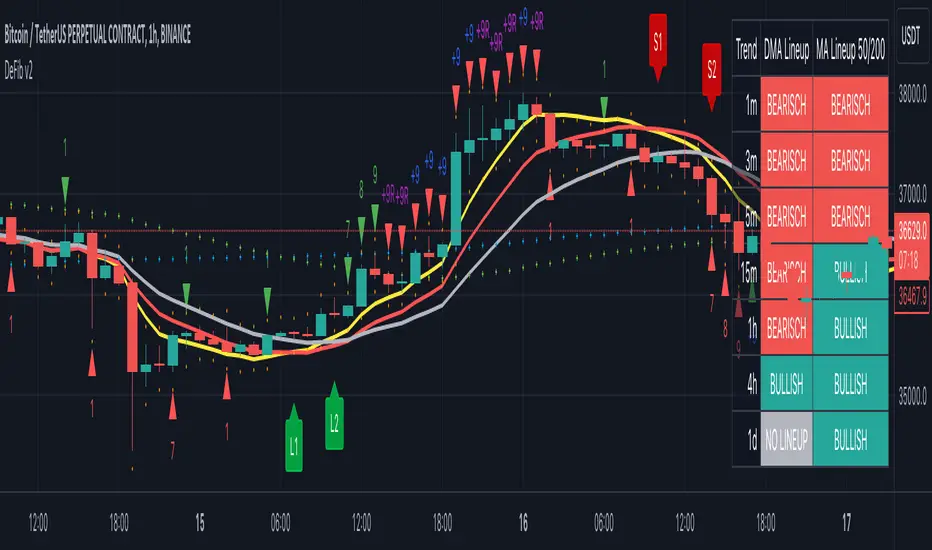
CryptoSignalScanner - DeFib v2 indicatorDESCRIPTION:
The DeFib indicator combines Moving Averages data points, Fibonacci sequence calculations and other methods to help traders make better decisions when it comes to entering and exiting trades at different time intervals. By analyzing these data points, the indicator provides valuable insights into the market trends and helps traders determine optimal moments to enter or exit a trade. Moving Averages helps smooth out price fluctuations over a specified period, providing a clearer picture of the overall market direction. The DeFib indicator uses a mix of these averages and Fibonacci methods to increase its chances of finding good trade opportunities. Whether analyzing short-term trends or longer-term patterns, this indicator assists traders in identifying favorable entry and exit points, thereby supporting more informed and strategic trading decisions.
By using Moving Averages data points based on the Fibonacci Sequence (+ some extra calculations we don't wish to share), we incorporate a unique perspective into the analysis. It helps to identify key levels of interest, potential trend reversals, and areas where price action may align with Fibonacci retracement levels. The Fibonacci Sequence is a mathematical sequence in which each number is the sum of the two preceding numbers (e.g., 0, 1, 1, 2, 3, 5, 8, 13, 21, and so on).
As a result of this information some L1, L2, S1 and S2 labels are printed on the chart. The labels are printed when a candle has been closed. Those labels are an indication when to enter or exit a trade. How to use those labels is described in the section "HOW TO USE" below.
This indicator is versatile and can be used on any timeframe, offering a wide range of features to support traders in their decision-making process. Here are some key aspects of this indicator:
User-Friendly:
Traders can easily customize all the settings according to their preferences, ensuring a personalized trading experience.
Long Signals:
The indicator provides both normal and strong long signals, which assist traders in identifying potential reversals in the market. These signals act as confirmation for traders to consider entering a long position.
Short Signals:
Similarly, the indicator offers normal and strong short signals, helping traders identify and confirm potential market reversals for short positions.
Fibonacci Sequence Calculation:
The calculation of the Long and Short labels is based on the Fibonacci Sequence, a mathematical pattern widely used in technical analysis. This adds a reliable and systematic approach to the indicator's signal generation.
Stop Loss:
When initiating a trade, it is our standard practice to implement a stop loss order based on the stop loss signal derived from the current or preceding candle. These stop loss signals are generated using the Average True Range (ATR) indicator.
Overlays:
The indicator includes overlays that visually represent market trends. These overlays identifying support and resistance levels, and providing valuable insights into the overall market behaviour.
Trend Table Box:
Traders can access a trend table box that displays the prevailing trend across different timeframes. This feature allows traders to assess the trend's strength and consistency. Additionally, users have the flexibility to adjust the timeframes based on their trading preferences.
Long/Short Alerts:
The indicator offers the functionality to add alerts for both long and short positions. Traders can set up notifications to be alerted when specific conditions are met, ensuring they stay informed even when they're not actively monitoring the charts.
Overall, this indicator provides traders with a comprehensive set of tools and features to enhance their trading decisions. Its user-friendly nature, combined with the inclusion of various signals, overlays, trend analysis, and alerts, enables traders to make informed choices and adapt to different market conditions effectively.
HOW TO USE:
This indicator incorporates specific signals that provide valuable insights into potential trend reversals in the market. Here's how each signal type is interpreted:
L1 (Long) Signal:
When an L1 signal appears, it suggests a potential uptrend reversal. Traders should pay attention to this signal as it indicates a possible shift from a downtrend to an uptrend. It serves as an early indication of a potential upward movement in prices. This is the fist point where we can take a long position. If we want to invest $100 into this trade we invest a maximum of $50 at this point. Don't forget to put a stop loss as described below in the "STOP LOSS" section.
L2 (Long) Signal:
An L2 signal acts as confirmation of the potential uptrend reversal identified by the L1 signal. When an L2 signal emerges, it strengthens the case for an upcoming uptrend. Traders may consider this signal as a stronger indication to support their decision to enter a long position. This is the point where we can invest another $50 if we already invested on the L1 signal. If we did not invested yet and we still see a clear reversal we enter the trade here with $100. Don't forget to put a stop loss as described below in the "STOP LOSS" section.
S1 (Short) Signal:
When an S1 signal is generated, it suggests a potential downtrend reversal. Traders should take note of this signal as it indicates a possible shift from an uptrend to a downtrend. It serves as an early indication of a potential downward movement in prices. This is the fist point where we can take a short position. If we want to invest $100 into this trade we invest a maximum of $50 at this point. Don't forget to put a stop loss as described below in the "STOP LOSS" section.
S2 (Short) Signal:
An S2 signal confirms the potential downtrend reversal identified by the S1 signal. When an S2 signal emerges, it reinforces the likelihood of an upcoming downtrend. Traders may consider this signal as a stronger indication to support their decision to enter a short position. This is the point where we can invest another $50 if we already invested on the S1 signal. If we did not invested yet and we still see a clear reversal we enter the trade here with $100. Don't forget to put a stop loss as described below in the "STOP LOSS" section.
These signals provide traders with a systematic framework to identify and evaluate potential reversals in market trends. By combining the information provided by both the L1 and L2 signals (for uptrends) or the S1 and S2 signals (for downtrends), traders can gain more confidence in their assessments of trend reversals. This indicator offers traders a valuable tool to capitalize on these reversal opportunities and make more informed trading decisions.
It is important to exercise caution and avoid blindly following the signals generated by the indicator. Instead, it is recommended to seek additional confirmations from other technical indicators such as the RSI (Relative Strength Index), MACD (Moving Average Convergence Divergence), or any other indicators that you are familiar with and trust.
While the signals provided by the indicator can be a useful starting point, relying solely on them may not always guarantee accurate predictions. By considering other technical indicators, traders can gain a more comprehensive view of the market conditions and validate the signals received from the indicator.
The RSI is a popular momentum oscillator that measures the speed and change of price movements. It helps traders identify overbought and oversold conditions, giving insights into potential trend reversals. The MACD, on the other hand, combines moving averages to provide signals for trend identification, as well as momentum and divergence analysis.
By utilizing these additional indicators or any others that you are familiar with, you can confirm the signals generated by the indicator under consideration. This approach enhances the reliability of your trading decisions by adding another layer of analysis and reducing the potential for false signals.
Each trader may have their preferred set of technical indicators based on their trading style and experience. It is important to select indicators that align with your trading strategy and complement the signals received from the indicator in question. This way, you can make more informed and well-rounded trading decisions, increasing the probability of successful trades and minimizing potential risks.
Stop Loss:
When initiating a trade, it is our standard practice to implement a stop loss order based on the stop loss signal derived from the current or preceding candle. These stop loss signals are generated using the Average True Range (ATR) indicator.
By employing a stop loss order, we aim to limit potential losses in case the trade moves against our anticipated direction. The stop loss signal, determined from the current or previous candle, provides a specific level at which the stop loss order is placed.
The Average True Range indicator is utilized to gauge the volatility of the market and determine an appropriate stop loss level. It takes into account the price range of the asset over a defined period, considering both high and low price points. By using the ATR, we can identify an optimal stop loss level that accounts for the asset's recent price fluctuations.
Implementing a stop loss based on the ATR-derived signal adds a layer of risk management to our trading strategy. It helps mitigate potential losses by automatically triggering the stop loss order if the price reaches or exceeds the predetermined level. This approach allows us to protect our capital and minimize the impact of adverse price movements.
It is important to note that the ATR-based stop loss signals should be used in conjunction with other analysis techniques and indicators. They serve as a dynamic reference point that considers market volatility, ensuring the stop loss level is adjusted accordingly.
By incorporating stop loss orders based on the stop loss signals derived from the current or previous candle using the ATR indicator, we aim to safeguard our trades and manage risk effectively. However, it is important to continually monitor and adjust the stop loss level as market conditions evolve, adhering to our risk management strategy throughout the duration of the trade.
Candlestick Sequence:
The Candlestick Sequence is a calculation used to identify potential trend reversal points in the financial markets. It consists of two main components, the Candlestick Sequence and the Candlestick Reversal. The Candlestick Sequence and Candlestick Reversal offer a structured way to identify potential reversals in the market.
WARNING:
• It is not advisable to engage in Leverage Trading unless you possess chart reading skills.
• It is not advisable to engage in Leverage Trading unless you are capable of interpreting technical indicators such as RSI, Moving Average, MACD, and others.
• It is crucial not to blindly follow trading signals without conducting your own analysis (DYOR - Do Your Own Research).
• Avoid succumbing to FOMO (Fear Of Missing Out) and impulsively entering trades. If you miss an entry point, it is important to let it go and patiently wait for the next potential entry point.
Leverage trading involves trading with borrowed funds, which amplifies both potential profits and losses. To participate in this form of trading, it is imperative to possess a certain level of expertise and knowledge. One key requirement is the ability to read and analyze charts effectively. Chart reading involves understanding various chart patterns, price movements, and support and resistance levels, among other factors. Without this skill, it can be challenging to make informed decisions and manage risk appropriately.
Additionally, leverage trading relies on technical indicators to identify potential trading opportunities and gauge market conditions. It is essential to have the ability to interpret indicators such as RSI, Moving Average, MACD, and others, as they provide valuable insights into market trends, momentum, and potential reversals. Ignoring or misunderstanding these indicators can lead to incorrect trading decisions and increased risk exposure.
Moreover, it is crucial not to blindly rely solely on trading signals, including those generated by indicators or other sources. While signals can be helpful, they should always be complemented by conducting one's own analysis. This entails conducting thorough research, considering multiple factors, and validating the signals with additional indicators or technical analysis techniques. This approach helps in making more informed and well-rounded trading decisions.
Finally, FOMO can be a detrimental emotion that drives impulsive and irrational trading behavior. It is important to avoid entering trades solely because of the fear of missing out on potential profits. If an entry point is missed, it is recommended to exercise patience and discipline by waiting for the next suitable opportunity. This approach helps to avoid unnecessary risks and maintain a more strategic and calculated trading approach.
By adhering to these warnings and taking the necessary precautions, traders can approach leverage trading more responsibly and increase their chances of success while mitigating potential losses.
REMARKS:
• It is important to emphasize that any information or content you encounter here is not intended as financial advice. We want to make it clear that we are not authorized or qualified to provide personalized investment advice. Our content, including ideas, opinions, views, predictions, forecasts, commentaries, suggestions, or stock picks, should be viewed strictly as informational, entertaining, or educational material.
• We emphasize that you should not construe the information provided here as personal investment advice or as a recommendation to take specific investment actions. It is crucial to conduct your own research, consider your individual financial circumstances, and consult with a qualified financial professional before making any investment decisions.
• While we aim to provide accurate and reliable information, we cannot guarantee the absence of errors or inaccuracies. Therefore, it is recommended to independently verify any information provided and exercise your own judgment when using it for decision-making purposes.
• Please be aware that any actions you take based on the information found here are done so at your own risk. We disclaim any liability for the consequences of your actions or decisions stemming from the information presented.
• Our intention is to provide helpful information that can contribute to your overall understanding and assist you in making better-informed decisions. However, it is essential to exercise caution, seek professional advice, and take responsibility for your investment choices.
Cheers & Good luck.
Blackrock Spot ETF Premium BTCUSD (COINBASE) V1I created an indicator that takes the spot BTC/USD pair from major exchanges and compares it to the Spot BTC/USD pair on Coinbase that institutions will use for their Spot ETFs.
Blackrock Spot ETF Premium BTCUSD (COINBASE)
I suspect we will see a new "Kimchi Premium" where the Spot ETF pressures from institutions will raise the Coinbase Bitcoin price by a factor of 10-50% premium to the other exchanges.
Naturally excess coins from other exchanges will flow into Coinbase to capture this.
This indicator should be good for some time until one of the other exchanges delist or stop using BTCUSD "spot" If it breaks it I will update it if I remember.
FederalXBT,

Quantitative Trend Strategy- Uptrend longTrend Strategy #1
Indicators:
1. SMA
2. Pivot high/low functions derived from SMA
3. Step lines to plot support and resistance based on the pivot points
4. If the close is over the resistance line, green arrows plot above, and vice versa for red arrows below support.
Strategy:
1. Long Only
2. Mutable 2% TP/1.5% SL
3. 0.01% commission
4. When the close is greater than the pivot point of the sma pivot high, and the close is greater than the resistance step line, a long position is opened.
*At times, the 2% take profit may not trigger IF; the conditions for reentry are met at the time of candle closure + no exit conditions have been triggered.
5. If the position is in the green and the support step line crosses over the resistance step line, positions are exited.
How to use it and what makes it unique:
Use this strategy to trade an up-trending market using a simple moving average to determine the trend. This strategy is meant to capture a good risk/reward in a bullish market while staying active in an appropriate fashion. This strategy is unique due to it's inclusion of the step line function with statistics derived from myself.
This description tells the indicators combined to create a new strategy, with commissions and take profit/stop loss conditions included, and the process of strategy execution with a description on how to use it. If you have any questions feel free to PM me and boost if you enjoyed it. Thank you, pineUSERS!

Rainbow Drift BetaRainbow Drift Beta is an indicator that detects the triggers of long and short positions at any TF.
It's based on two different type of approaches to the EMAs periods:
- Classic EMAs periods: 10 and 50
- Cycle EMAs perdios: 16, 64 and 256
The 256 period EMA (Annual Cycle) detects the trend: if the EMA 64 (Three-Weekly Cycle) is above, it shows an uptrend; while the EMA 64 is below, it means that the price action is in downtrend.
10 and 16 periods EMAs are working together as well as the 50 and the 64. The first couple reacts faster than the second one and as soon as the 10 is above the 16, the band shows the first attempt of the price action to go in the uptrend direction. The same concept is applied to the second couple (50, 64): when EMA 50 > EMA 64 it's a confirmation of the faster EMAs long direction. Viceverca happens for the downtrend but with the same concept.
As the EMA periods taken in consideration are quite often a sensitive level of reaction of the price, the indicator detects when there is trigger of a long or a short set up and plots a label on the chart. It's possibile to set up an alert as well.
Quite important, the indicator is looking for sideways patterns as the breakout of them shows a clear direction of the price.
Moreover, in order to privide the first and the best entry possibile, the indicator has a function that is triggering only one time as the trend reverted: for example, a long entry on the EMA 10-16 happens only one time since they crossover the EMA 64.
As included in the name, this is a beta version and new improvements will be added in the near future like suggested price entry, SL and TP, and the focus of the development is to avoid as much as possibile the false triggers.
Of course the best way to improve the code is to receive the users' feedbacks, so please feel free to post your comments and questions.

Wunder Breakout botWunder Breakout bot
1. Wunder Breakout bot is based on the breakout of the trend line. Breakout is a technical trading strategy that is used to determine the moment of a trend line breakout on the price chart. It is based on the assumption that when price crosses a trend line, it signals a change in trend direction and the possible start of a new price movement.
2. The entry points for the trendline breakout strategy are based on the principle of breaking through a set trendline. This means that we look for the moment when the price of the asset crosses the trend line that we have established in order to enter a sell or buy position.
3. We use fixed take-profit and stop-loss, but you can use other risk management systems, based on the suggested settings.
4. Wunder Breakout bot script has added a function to calculate the risk per portfolio (your deposit). When this option is enabled, you get the calculation of the entry amount in dollars relative to your Stop Loss. You can chooseselect the percentage of risk per your portfolio in the settings. the percentage of risk per your portfolio in the settings. The loss will be calculated from the amount that will be displayed on the chart.
For example, if your deposit is $1000 and you set your risk at 1%, with a Stop Loss of 5%, your entry volume would be $200. The SL loss would be $10. $10 is your 1% risk or 1% of your deposit.
*Important! ** The risk per trade must be less than the Stop Loss value. If the risk is more than SL, you should use leverage.
The amount of funds included in the deal is calculated in dollars. This option was created if you want to send a dollar amount from Tradingview to the exchange. However, by specifying the volume in dollars, you will get the net profit and drawdown displayed incorrectly in the backtest results because TradingView calculates the backtest volume in contracts.
To display the correct net profit and drawdown values in Tradingview backtest results, use the "Volume in Contracts" option.

Crypto Uptrend Script + Pullback//Volume CandlesDescription: his is an adaption of my Pullback candle - This works on all timeframes and Markets (Forex//Stocks//)
Crypto Uptrend Script with Pullback Candle allows traders to get into a trend when the price is at end of a pullback and entering a balance phase in the market (works on all markets). The use of Moving averages to help identify a Trends and the use of Key levels to help traders be aware of where strong areas are in the market.
This script can work really well in Crypto Bull Runs when used on HTF and with confluences
The script has key support and resistance zones which are made up of quarterly data. Price reacts to these areas but patience is required as price will take time to come into these areas
I have updated the Pullback Candle with the use of Volume to filter out the weak Pullback Candles -
There are new candles to the script.
The First candle is the Bullish Volume Candle - This candle is set to a multiplier of 2x with a crossover of 50/100 on Volume - this then will paint a purple candle.
Uses of the Bullish Volume Candle:
Breakthrough of key areas // special chart patterns
Rejection of key areas
End of a impulse wave (Profit Takers)
The second candle is a Hammer - I prefer using the Hammers on Higher Timeframes however they do work on all timeframes. .
The third candle is a Exhaustion of impulse downward move.
Uses of this candle - can denote a new trend but has to be with confluence to a demand area // support area or with any use of technical analysis - using this alone is not advised
The fourth candle is a indecision candle in the shape of a Doji - this candle can help identify if the trend is in a continuation or a reversal
This script can work really well in Crypto Bull Runs
Disclaimer: There will be Pullbacks with High Volume (Breakouts) and not go the way as intended but this script is to allow traders to get into trends at good price levels. The script can paint signals in areas where price is too expensive so please do your own due diligence on the markets as this script is to help get into good areas of price
Please leave a thumbs up if you like this script and message me for information on how to use the script.

Risk Reward Calculator [lovealgotrading]
OVERVIEW:
This Risk Reward Calculator strategy can help you maximize your RR value with help of algorithmic trading.
INDICATOR:
I wanted to setup my trades more easier with this indicator, I didn't want to calculate everytime before orders, with help this indicator we can calculate R:R value, avarage price, stoploss price, take-profit price, order prices, all position cost and more ...
Our strategy is a risk revard calculation indicator that is made easy to use by using visualized lines and panels, and also has algorithmic trading support.
With the help of this indicator, we can quickly and easily calculate our risk reward values and enter the positions.
If we want to ensure that our balance grows regularly while trading in the stock market, we need to manage the risks and rewards otherwise we may fall below our initial balance at the end of the day, even if we seem to be winning.
What is the Risk-Reward value ?
This value is a value that shows how many times the amount of risk we take when entering the position is successful, we will earn.
- For example, you risked $100 while entering the trade, so if your trade stops, you will lose 100 $.
Your Risk-Reward(RR) value is 2 means that if your position is successful, you will have 200 $ in your pocket.
A trader's success is determined by the amount of R he earns monthly or yearly, not how much money he makes.
What is different in this indicator ?
I want to say thank you to © EvoCrypto. His Calculator (weighted) – evo indicator helped me when I was developed my indicator.
I want to explain what I have improved:
1-In this strategy, we can determine the time period in which we want to open our positions.
2-We can open a maximum of 4 positions in the same direction and close our positions at a single level. StopLoss or TakeProfit
3-This indicator, which works in the form of a strategy, shows where our positions have been opened or closed. With the help of this, it helps us to determine our strategy in our future positions more accurately.
4-The most important improvement is that we do not miss our positions with the help of alarms (WEB HOOK). if we want, we receive by quickly connecting all these positions to our robot, the software can enter and exit the position while we are busy.
IMPLEMENTATION DETAILS – SETTINGS:
1 - We can set the start and end dates of the positions we will take.
2- We can set our take profit, stoploss levels.
3- If your trade is stopped, we can determine the amount of the trade that we will lose.
4- We can adjust our entry levels to positions and our position sizes at entry levels.
(Sum of positions weight must be 100%)
5- We can receive our positions even if we are busy with the help of algorithmic trading. For this, we must paste our Jshon codes into the fields specified in the settings panel.
6- Finally, we can change the settings we want and don't want to have in our visual elements.
Let's make a LONG side example together
We have determined our positions to enter stoploss, take profit and long positions. We did not forget to set the start time of our strategy
Our strategy appear on the graph as follows.
Our strategy has calculated the total position size, our R-R value, the distance of the current price to the stop and take profit levels, in short, a lot of things we could look visually.
Notes:
If you're going to connect this bot to an automatic Long or Short direction,
Don’t forget! you need to Webhook URL,
Don’t miss paste this code to your message window {{strategy.order.alert_message}}
ALSO:
If you have any ideas what to add to my work to add more sources or make calculations cooler, feel free to write me.

BB_MDL_V1Simple indicator that is based on the average line of the bollinger bands and the exponential average of 200 periods.
The customizable variable is bollinger bands length, currently the default is 35, you can tweak it to your liking and see how trend identification changes.
My recommendation is to work in 5-minute time frames in values such as SOL, FTM or MASK (cryptos)
This simple strategy can be combined with many others to gain more insight and get better market entries and exits.

Wunder OI botWunder OI bot
1. Wunder OI bot is based on the search for divergences on the Open Interest indicator. The strategy determines the divergence between the price and the Open Interest for a given period.
2. 50 EMA is used as an additional filter. If a divergence is found for a specified number of bars ago and the price is above or below, a trade will be opened.
3. A function for calculating risk on the portfolio (your deposit) has been added to the Wunder OI bot script. When this option is enabled, you get a calculation of the entry amount in dollars relative to your Stop Loss. In the settings, you can select the risk percentage on your portfolio. The loss will be calculated from the amount that will be displayed on the chart.
For example, if your deposit is $1000 and you set the risk to 1%, with a Stop Loss of 5%, the entry volume will be $200. The loss at SL will be $10. 10$, which is your 1% risk or 1% of the deposit.
*Important!** The risk per trade must be less than the Stop Loss value. If the risk is greater than SL, then you should use leverage.
The amount of funds entering the trade is calculated in dollars. This option was created if you want to send the dollar amount from Tradingview to the exchange. However, putting your volume in dollars you get the incorrect net profit and drawdown indication in the backtest results, as TradingView calculates the backtest volume in contracts.
To display the correct net profit and drawdown values in Tradingview Backtest results, use the ”Volume in contract” option.

Reversal Magic BTC [Loxx]What is Reversal Magic BTC ?
Reversal Magic BTC is an indicator that probes momentum and volatility for extreme values up/down to determine where possible reversals may occur for BTCUSD or BTCUSDT pairs. This is a highly specialized indicator tuned only to BTCUSD or BTCUSDT pairs and it only works on the daily timeframe. If you try to use this on any other ticker or any other timeframe other than the daily, then you'll see the indicator pop up with an error next to its name.
Settings
This indicator has two very simple settings:
1) High/Low period to probe highs and lows over the last XX candles
2) Volatility period to calculate the average volatility over the last XX candles
█ How do you use this?
Reversal trading
Ideally you would pair this indicator with a volatility indicator that shows volatility levels from closing price and then set a take profit level at 1x sigma up or down, and stoploss at 1.5x sigma up or down depending on the direction of the trade. Please note: reversal trading is extremely risky as a trend has not yet been established to confirm market direction.
The following indicators are ideal for this scenario
Profit Bands
Multi-Panel: Trade-Volatility-Probability
Swing Trading
This indicator can also be used as an exit indicator to be paired with a trend trading system where you would exit at the extremes up or down.
basilPort Portfolio Tracker Pro [basilChart]This script is helps giving detailed information about the portfolio.
Prominent features of this portfolio tracking indicator are:
- Chart of your portfolio: This portfolio tracker let’s you view the chart of your portfolio real-time.
- Visualized Profit/Loss: Indicator will let you know of your profit and loss on the chart.
- In-Depth Monitoring: Most Gained 1st, 2nd, 3rd and Most Lost 1st, 2nd, 3rd.
- All Time Highs: Let’s us view All Time Highs on the portfolio chart for each equity on the chart.
- 40 Different Symbols: Supports monitoring 40 different symbols at the same time, real-time.
- 10 Pair Detailed View: For the first 10 symbol in our portfolio, indicator supports viewing detailed info about each of them. Such as: Price, Cost, Qty, Profit Percentage, Chart TF Profit Percentage, Weight
basilPort Portfolio Tracker Pro indicator can be used to:
- Track your investments: The basilPort Portfolio Tracker allows you to enter all your investments and their associated details, such as the ticker symbol, purchase price, and quantity. It then calculates your total portfolio value, including gains and losses.
- Monitor portfolio performance: Provides an overview of your portfolio's performance over time. You can see how your portfolio is performing on a daily, weekly, or monthly basis, and compare it to the performance of the overall market.
- Analyze asset allocation: Helps you analyze your portfolio's asset allocation, which is the percentage of your portfolio invested in different symbols. You can use this information to adjust your portfolio and diversify your holdings.
- Set investment goals: You can use the Portfolio Tracker to set investment goals and track your progress towards achieving them. For example, you can set a goal of achieving a certain rate of return or accumulating a specific amount of wealth by a certain date.
Overall, the Portfolio Tracker is a useful tool for investors who want to monitor their portfolio's performance, evaluate their investment strategies, and make informed investment decisions.
Best and worst 3 performers in our portfolio:
From Data Window, script let’s us see the best and worst 3 performers in our portfolio. To know how to read it we follow this pattern:
- Check 1st Gained value.
- Find the nth symbol from script’s Inputs tab.
- Check 1st Gained to see its Profit Percentage.
An example scenario to reading Data Window is explained at the very end of the description.
Using the script:
- Add this script to the chart from indicators tab
- Set starting date for the basilGrid Portfolio Tracker Pro either by dragging and dropping the vertical line or by the date-time picker from indicator Inputs tab.
- Set symbols and enable them to monitor with this indicator.
- Set quantity and price information for the symbols you have selected.
- Set visual settings to tailor your experience.
basilPort Portfolio Tracker is an indicator that allows you to track and analyze the performance of your investment portfolio over time. It's a helpful tool for investors who want to monitor their holdings and evaluate their investment strategies.
In this example we used pair BTCUSDT 1h timeframe, our settings are:
Inputs Tab:
- Start Date: 2022-12-13 13:00
- Show All Time Highs: Unchecked
- Show Pair Data (First 10): Checked
- Show Total Data: Checked
Symbols:
- BINANCE:ETHUSDT Qty 4.2 Price 1 332
- BINANCE:BTCUSDT Qty 0.5 Price 17 469
- BINANCE:BNBUSDT Qty 20 Price 270
- BINANCE:AVAXUSDT Qty 200 Price 13.61
- BATS:PYPL Qty 50 Price 78.5
- BATS:AMZN Qty 40 Price 95.4
- BATS:ETSY Qty 40 Price 135.64
For example, if you check Data Window, you'll see the following:
An example scenario:
- Bought Portfolio Value 39142.98 => The cost of the portfolio
- Current Portfolio Value 39142.98 => The current value of the portfolio
- 1st Gained 2.00 => The most gained symbol's index. (Checking the Symbols what we see on the 2nd spot is this symbol, we can see this value indicates BINANCE:BTCUSDT)
- 1st Gained 28.09 => Means BINANCE:BTCUSDT is +%28.09
- 2nd Gained 4.00 => Again, after checking the Symbols, we now know what this value indicates. It is AVAXUSDT.
- 2nd Gained 18.59 => Means BINANCE:AVAXUSDT is +%18.59
..
And so on to Lost section. Only difference between Gained and Lost section indicates Lost equities.
This script's purpose is to make easier to have more control over the portfolio. With in depth data that’ll help with decision-making.

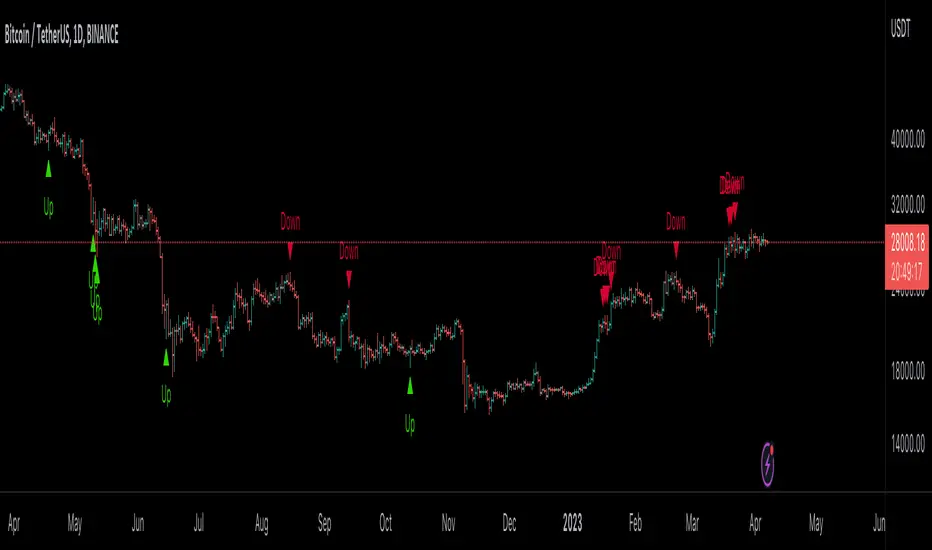
ChitukiProduced according to Bitcoin and Ethereum 1D, 1W, and 1M candle charts.
When you use it for general stock charts or altcoins, make sure to backtest it thoroughly before using it.
*To facilitate backtesting, this have a vertical line that allows you to easily specify the start time.😍
This indicator is simply based on the Engulfing patterns.
I focused on finding inflection points and wrote them based on 1D chart.
▲▼ Small and fat arrows: Displays simple engulfing patterns.
(Displays only those whose lengths differ by at least 1.2 times from each other)
↑↓ Slim and long arrows: Displays actual trading. (Backtesting reflects this.)
Compare the 7 lowest points to find the bullish Engulfing .
Compare the 14 highest points to find the Bearish Engulfing .
Switch the long and short positions to each other.
Long/short position entry at the market price, mid-price, and closing price of Engulfing Candles.
The charts from 2014 to January 2023 were back-tested and the error ranges were calculated and adjusted in detail.
In conclusion, you can think of it as an Engulfing Pattern Finder tailored to the Bitcoin chart.
This is how I did trading before I made this indicator, and I programmed the trading method as an indicator and I think it's pretty reliable but...
Please don't blindly trust ONLY the indicator(s).
///Properties setting Recommend///
Base currency : USD
Oder size : 18% of equity
Pyramiding : 21 (in plenty / Bcuz one deal is divided into three times.)
Commission : according to the exchange's commission
Recalculate : None
Margin : never less than 50%

Kimchi Premium StrategyThis strategy is based on the Korea Premium, also known as the “Kimchi Premium,” which indicates how expensive or cheap the price of Bitcoin in Korean Won on a Bitcoin exchange in South Korea is relative to the price of Bitcoin being traded in USD or Tether. Inverse Kimchi Premium RSI was newly defined to create a strategy with Kimchi Premium. Assuming that the larger the kimchi premium, the greater the individual's purchasing power. In this case, if the Inverse Kimchi Premium RSI falls and closes the candle below the bear level, a short is triggered. Long is the opposite.
This strategy defaults to a combination of the traditional RSI and the Inverse Kimchi Premium RSI. If the user wishes to unlock the Inverse Kimchi Premium RSI combination and only use it as a traditional RSI strategy, the following settings can be used.
Use Combination of Inverse Kimchi Premium RSI: Uncheck
Resolution: Chart (4hr Candle)
Source: Close
Length of RSI: 14
Bull Level: 74
Bear Level: 25
__________________________________________________________________________________
김치프리미엄(김프) 전략은 달러 혹은 테더로 거래되고 있는 비트코인 가격 대비 한국에 있는 비트코인 거래소의 비트코인 원화 가격이 얼마나 비싸고 싼 지를 나타내는 코리아 프리미엄, 일명 "김치 프리미엄" 지표를 기반으로 만들어졌습니다. 김치 프리미엄을 가지고 전략을 만들기위해 Inverse Kimchi Premium RSI를 새롭게 정의하였습니다. 김치 프리미엄이 커질수록 개인의 매수세가 커진다고 가정하고, 이 경우 Inverse Kimchi Premium RSI이 하락하여 Bear Level 아래에서 캔들 마감을 하면 Short을 트리거 합니다. Long은 그 반대입니다.
이 전략은 전통적인 RSI와 Inverse Kimchi Premium RSI을 조합하여 기본값을 설정하였습니다. 유저가 원한다면 Inverse Kimchi Premium RSI의 조합을 해제하고 전통적인 RSI 전략으로만 사용하려면 아래 다음의 설정값을 사용할 수 있습니다.
Use Combination of Inverse Kimchi Premium RSI: 체크 해제
Resolution: Chart (4hr Candle)
Source: Close
Length of RSI: 14
Bull Level: 74
Bear Level: 25

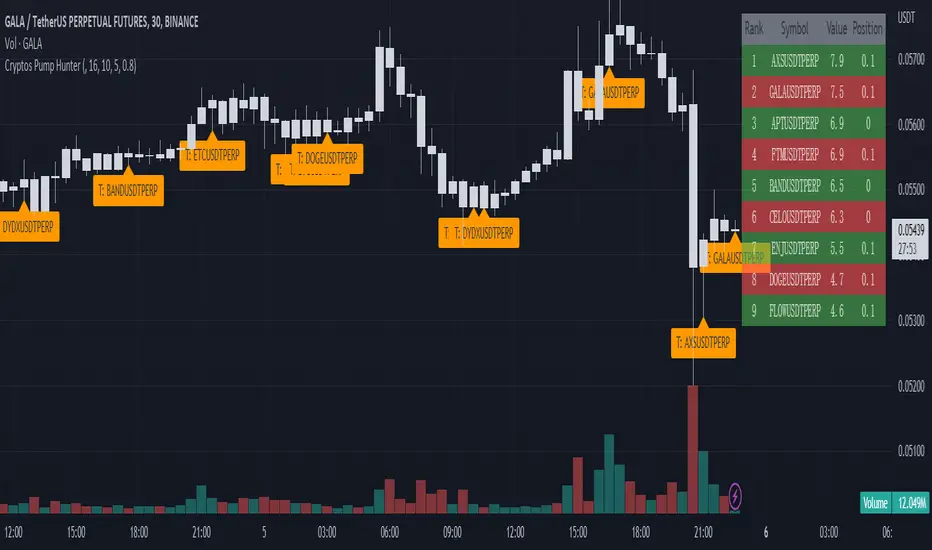
Cryptos Pump Hunter[liwei666]🔥 Cryptos Pump Hunter captured high volatility symbols in real-time, Up to 40 symbols can be monitored at same time.
Help you find the most profitable symbol with excellent visualization.
🔥 Indicator Design logic
🎯 The core pump/dump logic is quite simple
1. calc past bars highest and lowest High price, get movement by this formula
" movement = (highest - lowest) / lowest * 100 "
2. order by 'movement' value descending, you will get a volatility List
3. use Table tool display List, The higher the 'movement', the higher the ranking.
🔥 Settings
🎯 2 input properties impact on the results, 2 input impact on display effects, others look picture below.
pump_bars_cnt : lookback bar to calc pump/dump
resolution for pump : 1min to 1D
show_top1 : when ranking list top1 change, will draw a label
show pump : when symbol over threhold, draw a pump lable
🔥 How TO USE
🎯 only trade high volatility symbols
1. focus on top1 symbol on Table panel at top-right postion, trading symbols at label in chart.
2. Short when 'postion' ~ 0, Long when 'postion' ~ 1 on Table Cell
🎯 Monitor the symbols you like
1. 100+ symbols added in script, cancel remarks in code line if symbol is your want
2. add 1 line code if symbol not exist. if you want monitor 'ETHUSDTPERP ', then add
" ETHUSDTPERP = create_symbol_obj('BINANCE:ETHUSDTPERP'), array.unshift(symbol_a, ETHUSDTPERP ) "
🎯 Alert will be add soon, any questions or suggestion please comment below, I would appreciate it greatly.
Hope this indicator will be useful for you :)
enjoy! 🚀🚀🚀
ATR Mean Reversion Strategy V1**Long Only Strategy**
When Price drops below the ATR band below it will enter a buy on the next candle open
SL at current price minus ATR* ATR multiplier
TP at Mean EMA or if higher than Mean EMA and current candle low is below previous candle low or if price is above ATR
NB: I would highly recommend a low fee broker (I use ICmarkets raw spread account) due to the fact that this is a decently high frequency trading strategy you will rack up a lot of commission, if you use and exchange like Bybit or Binance the strategy will not be profitable due to the high commissions.

Market Structure Double BOS Confirm
🔥 Overview
🎯 This Double BOS(Break Of Structure) Confirm indicator combined ma-based BOS and classic BOS
to achieve a more credible BOS signal . it works well in most symbols with 2 parameters finetune.
🎯 It's a enhanced version compare with previous script.
🎯 at the same time, I keep D-BOS and BOS separately, you can use them in combination freely.
🔥 Indicator design logic
🎯 there are 3 parts in this indicator.
Part 1: MA-Based BOS
1. use close-in EMA's highest/lowest value mark as SWING High/Low when EMA crossover/under,
not use func ta.pivothigh()/ta.pivotlow()
2. once price reaching EMA’s SWING High/Low, draw a line link High/Low to current bar, labled as BOS
3. more MA-Based BOS details can get from my previous script.
Part 2: Classic BOS
1. use pivothigh/low function to find pivot (decided by left/right swing length)
2. when get new pivothigh, compare with previous high, calculate HH/LH/HL/LL result
3. once bar closed and break pivothigh then labed as BOS
Part 3: Double BOS Confirms
1. when MA-Based BOS and Classic BOS occured at the same bar closed signed as D-BOS
2. when two BOS events one bar apart, signed as D-BOS
🔥 Settings
🎯 there are 13 input properties in script, 4 properties(Bold field) have an impact on the results and the other 9 show display effects.
GRP1
MA_Type : MA type you can choose(EMA/RMA/SMA/HMA/WMA/VWMA), default is HMA
short_ma_len : MA length of your current timeframe on chart, default 30
show_ma_bos_line: whether show ma-based BOS line, default false
GRP2
left_swing_len : pivothigh(source, left,right), it‘s left swing length
right_swing_len : right swing length
show_pivot_bos_line: whether show pivot-based BOS line, default false
GRP3
show_double_bos_line: show double_bos_line, default true
double_bos_linewidth: linewidth, default 2 (Bold line)
double_bos_linestyle: default Dashed
🔥 Usage
🎯 BOS signal usually worked fine in high volatility market, low volatility is meaningless.
🎯 D-BOS will filtered much more signals than ma-based BOS and classic BOS
We can see that it performs well in trending market of different symbols, and BOS is an opportunity to add positions,
D-BOS will filtered much more signals
Double-BOS Confirm : BINANCE:BTCUSDTPERP 30m
MA-Based BOS : BINANCE:BTCUSDTPERP 30m
🎯 Support classic HH/HL label, MA-Based Zigzag
🎯 You can use only D-BOS, MA-BOS or Classic-BOS alone, or D-BOS and one of the other, it's up to you,
but my personal preference is to use D-BOS and MA-BOS in combination
🎯 any questions or suggestion please comment below, I would appreciate it greatly.
Additionally, I plan to publish 20 profitable strategies in 2023; indicatior not one of them,
let‘s witness it together!
Hope this indicator will be useful for you :)
enjoy! 🚀🚀🚀
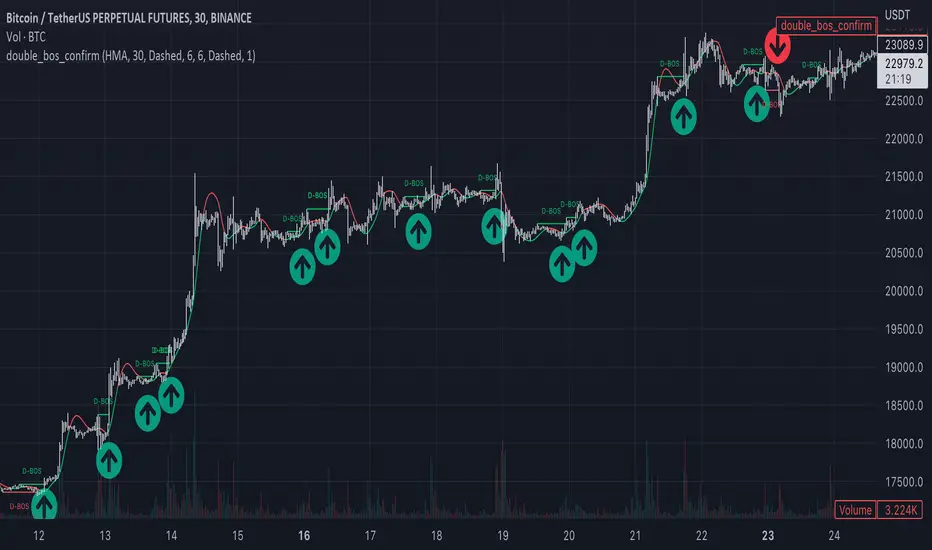
BTC Net Volume (Spot) (by JaggedSoft, fixed by SLN)• WHAT:
This indicator plots the aggregated net volume delta of BTC spot pairs from 8 exchanges over the last 60 periods (default settings).
Tracks the following pairs:
"BINANCE:BTCUSDT"
"BITFINEX:BTCUSD"
"POLONIEX:BTCUSDT"
"BITTREX:BTCUSDT"
"COINBASE:BTCUSD"
"BITSTAMP:BTCUSD"
"KRAKEN:XBTUSD"
"BITGET:BTCUSDT"
"GEMINI:BTCUSD"
• HOW TO USE:
Used for confirmation when watching futures that can experience quick movements in the form of liquidation-events. If the oscillator is green or trending upward, it's confirming a positive bias. The inverse is true for a negative bias. This is especially true on higher timeframes.
Can also be used to find correlations between different tech-assets.
• NOTES:
I forked JaggedSofts indicator to fix the data-source error it was having. Let me know if you want to customize exchanges or add more pairs, maybe I can add that in the future!
This indicator replaces the outdated alternative linked here : Please only use this one
• LIMITATIONS:
Only tested with normal japanese candlesticks .
• THANKS:
to the creator of this script, JaggedSoft. It's a great indicator!
• DISCLAIMER:
Not financial Advice, use at your own risk.
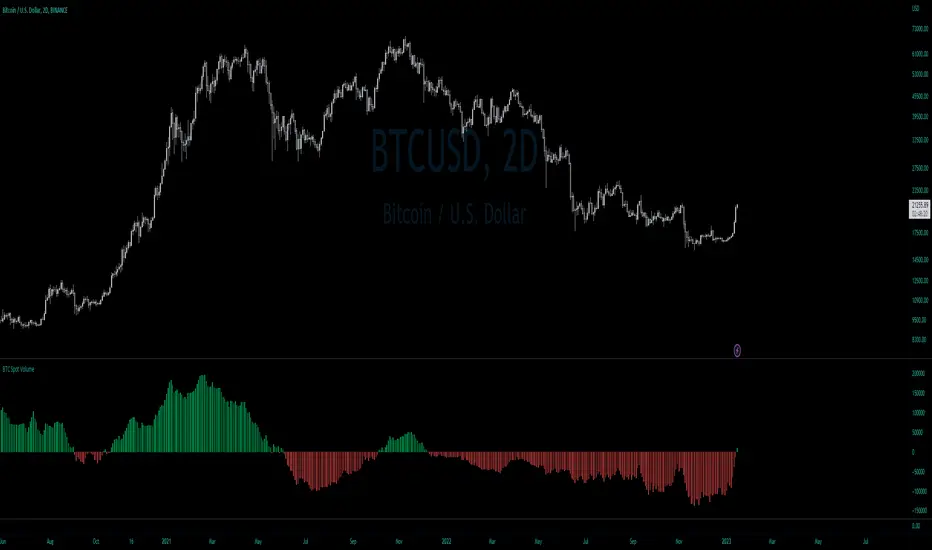
Titan Investments|Quantitative THEMIS|Pro|BINANCE:BTCUSDTP:4hInvestment Strategy (Quantitative Trading)
| 🛑 | Watch "LIVE" and 'COPY' this strategy in real time:
🔗 Link: www.tradingview.com
Hello, welcome, feel free 🌹💐
Since the stone age to the most technological age, one thing has not changed, that which continues impress human beings the most, is the other human being!
Deep down, it's all very simple or very complicated, depends on how you look at it.
I believe that everyone was born to do something very well in life.
But few are those who have, let's use the word 'luck' .
Few are those who have the 'luck' to discover this thing.
That is why few are happy and successful in their jobs and professions.
Thank God I had this 'luck' , and discovered what I was born to do well.
And I was born to program. 👨💻
📋 Summary : Project Titan
0️⃣ : 🦄 Project Titan
1️⃣ : ⚖️ Quantitative THEMIS
2️⃣ : 🏛️ Titan Community
3️⃣ : 👨💻 Who am I ❔
4️⃣ : ❓ What is Statistical/Probabilistic Trading ❓
5️⃣ : ❓ How Statistical/Probabilistic Trading works ❓
6️⃣ : ❓ Why use a Statistical/Probabilistic system ❓
7️⃣ : ❓ Why the human brain is not prepared to do Trading ❓
8️⃣ : ❓ What is Backtest ❓
9️⃣ : ❓ How to build a Consistent system ❓
🔟 : ❓ What is a Quantitative Trading system ❓
1️⃣1️⃣ : ❓ How to build a Quantitative Trading system ❓
1️⃣2️⃣ : ❓ How to Exploit Market Anomalies ❓
1️⃣3️⃣ : ❓ What Defines a Robust, Profitable and Consistent System ❓
1️⃣4️⃣ : 🔧 Fixed Technical
1️⃣5️⃣ : ❌ Fixed Outputs : 🎯 TP(%) & 🛑SL(%)
1️⃣6️⃣ : ⚠️ Risk Profile
1️⃣7️⃣ : ⭕ Moving Exits : (Indicators)
1️⃣8️⃣ : 💸 Initial Capital
1️⃣9️⃣ : ⚙️ Entry Options
2️⃣0️⃣ : ❓ How to Automate this Strategy ❓ : 🤖 Automation : 'Third-Party Services'
2️⃣1️⃣ : ❓ How to Automate this Strategy ❓ : 🤖 Automation : 'Exchanges
2️⃣2️⃣ : ❓ How to Automate this Strategy ❓ : 🤖 Automation : 'Messaging Services'
2️⃣3️⃣ : ❓ How to Automate this Strategy ❓ : 🤖 Automation : '🧲🤖Copy-Trading'
2️⃣4️⃣ : ❔ Why be a Titan Pro 👽❔
2️⃣5️⃣ : ❔ Why be a Titan Aff 🛸❔
2️⃣6️⃣ : 📋 Summary : ⚖️ Strategy: Titan Investments|Quantitative THEMIS|Pro|BINANCE:BTCUSDTP:4h
2️⃣7️⃣ : 📊 PERFORMANCE : 🆑 Conservative
2️⃣8️⃣ : 📊 PERFORMANCE : Ⓜ️ Moderate
2️⃣9️⃣ : 📊 PERFORMANCE : 🅰 Aggressive
3️⃣0️⃣ : 🛠️ Roadmap
3️⃣1️⃣ : 🧻 Notes ❕
3️⃣2️⃣ : 🚨 Disclaimer ❕❗
3️⃣3️⃣ : ♻️ ® No Repaint
3️⃣4️⃣ : 🔒 Copyright ©️
3️⃣5️⃣ : 👏 Acknowledgments
3️⃣6️⃣ : 👮 House Rules : 📺 TradingView
3️⃣7️⃣ : 🏛️ Become a Titan Pro member 👽
3️⃣8️⃣ : 🏛️ Be a member Titan Aff 🛸
0️⃣ : 🦄 Project Titan
This is the first real, 100% automated Quantitative Strategy made available to the public and the pinescript community for TradingView.
You will be able to automate all signals of this strategy for your broker , centralized or decentralized and also for messaging services : Discord, Telegram or Twitter .
This is the first strategy of a larger project, in 2023, I will provide a total of 6 100% automated 'Quantitative' strategies to the pinescript community for TradingView.
The future strategies to be shared here will also be unique , never before seen, real 'Quantitative' bots with real, validated results in real operation.
Just like the 'Quantitative THEMIS' strategy, it will be something out of the loop throughout the pinescript/tradingview community, truly unique tools for building mutual wealth consistently and continuously for our community.
1️⃣ : ⚖️ Quantitative THEMIS : Titan Investments|Quantitative THEMIS|Pro|BINANCE:BTCUSDTP:4h
This is a truly unique and out of the curve strategy for BTC /USD .
A truly real strategy, with real, validated results and in real operation.
A unique tool for building mutual wealth, consistently and continuously for the members of the Titan community.
Initially we will operate on a monthly, quarterly, annual or biennial subscription service.
Our goal here is to build a great community, in exchange for an extremely fair value for the use of our truly unique tools, which bring and will bring real results to our community members.
With this business model it will be possible to provide all Titan users and community members with the purest and highest degree of sophistication in the market with pinescript for tradingview, providing unique and truly profitable strategies.
My goal here is to offer the best to our members!
The best 'pinescript' tradingview service in the world!
We are the only Start-Up in the world that will decentralize real and full access to truly real 'quantitative' tools that bring and will bring real results for mutual and ongoing wealth building for our community.
2️⃣ : 🏛️ Titan Community : 👽 Pro 🔁 Aff 🛸
Become a Titan Pro 👽
To get access to the strategy: "Quantitative THEMIS" , and future Titan strategies in a 100% automated way, along with all tutorials for automation.
Pro Plans: 30 Days, 90 Days, 12 Months, 24 Months.
👽 Pro 🅼 Monthly
👽 Pro 🆀 Quarterly
👽 Pro🅰 Annual
👽 Pro👾Two Years
You will have access to a truly unique system that is out of the curve .
A 100% real, 100% automated, tested, validated, profitable, and in real operation strategy.
Become a Titan Affiliate 🛸
By becoming a Titan Affiliate 🛸, you will automatically receive 50% of the value of each new subscription you refer .
You will receive 50% for any of the above plans that you refer .
This way we will encourage our community to grow in a fair and healthy way, because we know what we have in our hands and what we deliver real value to our users.
We are at the highest level of sophistication in the market, the consistency here and the results here speak for themselves.
So growing our community means growing mutual wealth and raising collective conscience.
Wealth must be created not divided.
And here we are creating mutual wealth on all ends and in all ways.
A non-zero sum system, where everybody wins.
3️⃣ : 👨💻 Who am I ❔
My name is FilipeSoh I am 26 years old, Technical Analyst, Trader, Computer Engineer, pinescript Specialist, with extensive experience in several languages and technologies.
For the last 4 years I have been focusing on developing, editing and creating pinescript indicators and strategies for Tradingview for people and myself.
Full-time passionate workaholic pinescript developer with over 10,000 hours of pinescript development.
• Pinescript expert ▬Tradingview.
• Specialist in Automated Trading
• Specialist in Quantitative Trading.
• Statistical/Probabilistic Trading Specialist - Mark Douglas Scholl.
• Inventor of the 'Classic Forecast' Indicators.
• Inventor of the 'Backtest Table'.
4️⃣ : ❓ What is Statistical/Probabilistic Trading ❓
Statistical/probabilistic trading is the only way to get a positive mathematical expectation regarding the market and consequently that is the only way to make money consistently from it.
I will present below some more details about the Quantitative THEMIS strategy, it is a real strategy, tested, validated and in real operation, 'Skin in the Game' , a consistent way to make money with statistical/probabilistic trading in a 100% automated.
I am a Technical Analyst , I used to be a Discretionary Trader , today I am 100% a Statistical Trader .
I've gotten rich and made a lot of money, and I've also lost a lot with 'leverage'.
That was a few years ago.
The book that changed everything for me was "Trading in The Zone" by Mark Douglas.
That's when I understood that the market is just a game of statistics and probability, like a casino!
It was then that I understood that the human brain is not prepared for trading, because it involves triggers and mental emotions.
And emotions in trading and in making trading decisions do not go well together, not in the long run, because you always have the burden of being wrong with the outcome of that particular position.
But remembering that the market is just a statistical game!
5️⃣ : ❓ How Statistical/Probabilistic Trading works ❓
Let's use a 'coin' as an example:
If we toss a 'coin' up 10 times.
Do you agree that it is impossible for us to know exactly the result of the 'plays' before they actually happen?
As in the example above, would you agree, that we cannot "guess" the outcome of a position before it actually happens?
As much as we cannot "guess" whether the coin will drop heads or tails on each flip.
We can analyze the "backtest" of the 10 moves made with that coin:
If we analyze the 10 moves and count the number of times the coin fell heads or tails in a specific sequence, we then have a percentage of times the coin fell heads or tails, so we have a 'backtest' of those moves.
Then on the next flip we can now assume a point or a favorable position for one side, the side with the highest probability .
In a nutshell, this is more or less how probabilistic statistical trading works.
As Statistical Traders we can never say whether such a Trader/Position we take will be a winner or a loser.
But still we can have a positive and consistent result in a "sequence" of trades, because before we even open a position, backtests have already been performed so we identify an anomaly and build a system that will have a positive statistical advantage in our favor over the market.
The advantage will not be in one trade itself, but in the "sequence" of trades as a whole!
Because our system will work like a casino, having a positive mathematical expectation relative to the players/market.
Design, develop, test models and systems that can take advantage of market anomalies, until they change.
Be the casino! - Mark Douglas
6️⃣ : ❓ Why use a Statistical/Probabilistic system ❓
In recent years I have focused and specialized in developing 100% automated trading systems, essentially for the cryptocurrency market.
I have developed many extremely robust and efficient systems, with positive mathematical expectation towards the market.
These are not complex systems per se , because here we want to avoid 'over-optimization' as much as possible.
As Da Vinci said: "Simplicity is the highest degree of sophistication".
I say this because I have tested, tried and developed hundreds of systems/strategies.
I believe I have programmed more than 10,000 unique indicators/strategies, because this is my passion and purpose in life.
I am passionate about what I do, completely!
I love statistical trading because it is the only way to get consistency in the long run!
This is why I have studied, applied, developed, and specialized in 100% automated cryptocurrency trading systems.
The reason why our systems are extremely "simple" is because, as I mentioned before, in statistical trading we want to exploit the market anomaly to the maximum, that is, this anomaly will change from time to time, usually we can exploit a trading system efficiently for about 6 to 12 months, or for a few years, that is; for fixed 'scalpers' systems.
Because at some point these anomalies will be identified , and from the moment they are identified they will be exploited and will stop being anomalies .
With the system presented here; you can even copy the indicators and input values shared here;
However; what I have to offer you is: it is me , our team , and our community !
That is, we will constantly monitor this system, for life , because our goal here is to create a unique , perpetual , profitable , and consistent system for our community.
Myself , our team and our community will keep this script periodically updated , to ensure the positive mathematical expectation of it.
So we don't mind sharing the current parameters and values , because the real value is also in the future updates that this system will receive from me and our team , guided by our culture and our community of real users !
As we are hosted on 'tradingview', all future updates for this strategy, will be implemented and updated automatically on your tradingview account.
What we want here is: to make sure you get gains from our system, because if you get gains , our ecosystem will grow as a whole in a healthy and scalable way, so we will be generating continuous mutual wealth and raising the collective consciousness .
People Need People: 3️⃣🅿
7️⃣ : ❓ Why the human brain is not prepared to do Trading ❓
Today my greatest skill is to develop statistically profitable and 100% automated strategies for 'pinescript' tradingview.
Note that I said: 'profitable' because in fact statistical trading is the only way to make money in a 'consistent' way from the market.
And consequently have a positive wealth curve every cycle, because we will be based on mathematics, not on feelings and news.
Because the human brain is not prepared to do trading.
Because trading is connected to the decision making of the cerebral cortex.
And the decision making is automatically linked to emotions, and emotions don't match with trading decision making, because in those moments, we can feel the best and also the worst sensations and emotions, and this certainly affects us and makes us commit grotesque mistakes!
That's why the human brain is not prepared to do trading.
If you want to participate in a fully automated, profitable and consistent trading system; be a Titan Pro 👽
I believe we are walking an extremely enriching path here, not only in terms of financial returns for our community, but also in terms of knowledge about probabilistic and automated statistical trading.
You will have access to an extremely robust system, which was built upon very strong concepts and foundations, and upon the world's main asset in a few years: Bitcoin .
We are the tip of the best that exists in the cryptocurrency market when it comes to probabilistic and automated statistical trading.
Result is result! Me being dressed or naked.
This is just the beginning!
But there is a way to consistently make money from the market.
Being the Casino! - Mark Douglas
8️⃣ : ❓ What is Backtest ❓
Imagine the market as a purely random system, but even in 'randomness' there are patterns.
So now imagine the market and statistical trading as follows:
Repeating the above 'coin' example, let's think of it as follows:
If we toss a coin up 10 times again.
It is impossible to know which flips will have heads or tails, correct?
But if we analyze these 10 tosses, then we will have a mathematical statistic of the past result, for example, 70 % of the tosses fell 'heads'.
That is:
7 moves fell on "heads" .
3 moves fell on "tails" .
So based on these conditions and on the generic backtest presented here, we could adopt " heads " as our system of moves, to have a statistical and probabilistic advantage in relation to the next move to be performed.
That is, if you define a system, based on backtests , that has a robust positive mathematical expectation in relation to the market you will have a profitable system.
For every move you make you will have a positive statistical advantage in your favor over the market before you even make the move.
Like a casino in relation to all its players!
The casino does not have an advantage over one specific player, but over all players, because it has a positive mathematical expectation about all the moves that night.
The casino will always have a positive statistical advantage over its players.
Note that there will always be real players who will make real, million-dollar bankrolls that night, but this condition is already built into the casino's 'strategy', which has a pre-determined positive statistical advantage of that night as a whole.
Statistical trading is the same thing, as long as you don't understand this you will keep losing money and consistently.
9️⃣ : ❓ How to build a Consistent system ❓
See most traders around the world perform trades believing that that specific position taken will make them filthy rich, because they simply believe faithfully that the position taken will be an undoubted winner, based on a trader's methodology: 'trading a trade' without analyzing the whole context, just using 'empirical' aspects in their system.
But if you think of trading, as a sequence of moves.
You see, 'a sequence' !
When we think statistically, it doesn't matter your result for this , or for the next specific trade , but the final sequence of trades as a whole.
As the market has a random system of results distribution , if your system has a positive statistical advantage in relation to the market, at the end of that sequence you'll have the biggest probability of having a winning bank.
That's how you do real trading!
And with consistency!
Trading is a long term game, but when you change the key you realize that it is a simple game to make money in a consistent way from the market, all you need is patience.
Even more when we are based on Bitcoin, which has its 'Halving' effect where, in theory, we will never lose money in 3 to 4 years intervals, due to its scarcity and the fact that Bitcoin is the 'discovery of digital scarcity' which makes it the digital gold, we believe in this thesis and we follow Satoshi's legacy.
So align Bitcoin with a probabilistic statistical trading system with a positive mathematical expectation of the market and 100% automated with the long term, and all you need is patience, and you will become rich.
In fact Bitcoin by itself is already a path, buy, wait for each halving and your wealth will be maintained.
No inflation, unlike fiat currencies.
This is a complete and extremely robust strategy, with the most current possible and 'not possible' techniques involved and applied here.
Today I am at another level in developing 100% automated 'quantitative' strategies.
I was born for this!
🔟 : ❓ What is a Quantitative Trading system ❓
In addition to having access to a revolutionary strategy you will have access to disruptive 100% multifunctional tables with the ability to perform 'backtests' for better tracking and monitoring of your system on a customized basis.
I would like to emphasize one thing, and that is that you keep this in mind.
Today my greatest skill in 'pinescript' is to build indicators, but mainly strategies, based on statistical and probabilistic trading, with a postive mathematical expectation in relation to the market, in a 100% automated way.
This with the goal of building a consistent and continuous positive equity curve through mathematics using data, converting it into statistical / probabilistic parameters and applying them to a Quantitative model.
Before becoming a Quantitative Trader , I was a Technical Analyst and a Discretionary Trader .
First as a position trader and then as a day trader.
Before becoming a Trader, I trained myself as a Technical Analyst , to masterly understand the shape and workings of the market in theory.
But everything changed when I met 'Mark Douglas' , when I got to know his works, that's when my head exploded 🤯, and I started to understand the market for good!
The market is nothing more than a 'random' system of distributing results.
See that I said: 'random' .
Do yourself a mental exercise.
Is there really such a thing as random ?
I believe not, as far as we know maybe the 'singularity'.
So thinking this way, to translate, the market is nothing more than a game of probability, statistics and pure mathematics.
Like a casino!
What happens is that most traders, whenever they take a position, take it with all the empirical certainty that such position will win or lose, and do not take into consideration the total sequence of results to understand their place in the market.
Understanding your place in the market gives you the ability to create and design systems that can exploit the present market anomaly, and thus make money statistically, consistently, and 100% automated.
Thinking of it this way, it is easy to make money from the market.
There are many ways to make money from the market, but the only consistent way I know of is through 'probabilistic and automated statistical trading'.
1️⃣1️⃣ : ❓ How to build a Quantitative Trading system ❓
There are some fundamental points that must be addressed here in order to understand what makes up a system based on statistics and probability applied to a quantitative model.
When we talk about 'discretionary' trading, it is a trading system based on human decisions after the defined 'empirical' conditions are met.
It is quite another thing to build a fully automated system without any human interference/interaction .
That said:
Building a statistically profitable system is perfectly possible, but this is a high level task , but with possible high rewards and consistent gains.
Here you will find a real "Skin In The Game" strategy.
With all due respect, but the vast majority of traders who post strategies on TradingView do not understand what they are doing.
Most of them do not understand the minimum complexity involved in the main variable for the construction of a real strategy, the mother variable: "strategy".
I say this by my own experience, because I have analyzed practically all the existing publications of TradingView + 200,000 indicators and strategies.
I breathe pinescript, I eat pinescript, I sleep pinescript, I bathe pinescript, I live TradingView.
But the main advantage for the TradingView users, is that all entry and exit orders made by this strategy can be checked and analyzed thoroughly, to validate and prove the veracity of this strategy, because this is a 100% real strategy.
Here there is a huge world of possibilities, but only one way to build a 'pinescript strategy' that will work correctly aligned to the real world with real results .
There are some fundamental points to take into consideration when building a profitable trading system:
The most important of these for me is: 'DrawDown' .
Followed by: 'Hit Rate' .
And only after that we use the parameter: 'Profit'.
See, this is because here, we are dealing with the 'imponderable' , and anything can happen in this scenario.
But there is one thing that makes us sleep peacefully at night, and that is: controlling losses .
That is, in other words: controlling the DrawDown .
The amateur is concerned with 'winning', the professional is concerned with conserving capital.
If we have the losses under control, then we can move on to the other two parameters: hit rate and profit.
See, the second most important factor in building a system is the hit rate.
I say this from my own experience.
I have worked with many systems with a 'low hit rate', but extremely profitable.
For example: systems with hit rates of 40 to 50%.
But as much as statistically and mathematically the profit is rewarding, operating systems with a low hit rate is always very stressful psychologically.
That's why there are two big reasons why when I build an automated trading system, I focus on the high hit rate of the system, they are
1 - To reduce psychological damage as much as possible .
2 - And more important , when we create a system with a 'high hit rate' , there is a huge intrinsic advantage here, that most statistic traders don't take in consideration.
That is: knowing more quickly when the system stops being functional.
The main advantage of a system with a high hit rate is: to identify when the system stops being functional and stop exploiting the market's anomaly.
Look: When we are talking about trading and random distribution of results on the market, do you agree that when we create a trading system, we are focused on exploring some anomaly of that market?
When that anomaly is verified by the market, it will stop being functional with time.
That's why trading systems, 'scalpers', especially for cryptocurrencies, need constant monitoring, quarterly, semi-annually or annually.
Because market movements change from time to time.
Because we go through different cycles from time to time, such as congestion cycles, accumulation , distribution , volatility , uptrends and downtrends .
1️⃣2️⃣ : ❓ How to Exploit Market Anomalies ❓
You see there is a very important point that must be stressed here.
As we are always trying to exploit an 'anomaly' in the market.
So the 'number' of indicators/tools that will integrate the system is of paramount importance.
But most traders do not take this into consideration.
To build a professional, robust, consistent, and profitable system, you don't need to use hundreds of indicators to build your setup.
This will actually make it harder to read when the setup stops working and needs some adjustment.
So focusing on a high hit rate is very important here, this is a fundamental principle that is widely ignored , and with a high hit rate, we can know much more accurately when the system is no longer functional much faster.
As Darwin said: "It is not the strongest or the most intelligent that wins the game of life, it is the most adapted.
So simple systems, as contradictory as it may seem, are more efficient, because they help to identify inflection points in the market much more quickly.
1️⃣3️⃣ : ❓ What Defines a Robust, Profitable and Consistent System ❓
See I have built, hundreds of thousands of indicators and 'pinescript' strategies, hundreds of thousands.
This is an extremely professional, robust and profitable system.
Based on the currency pairs: BTC /USDT
There are many ways and avenues to build a profitable trading setup/system.
And actually this is not a difficult task, taking in consideration, as the main factor here, that our trading and investment plan is for the long term, so consequently we will face scenarios with less noise.
He who is in a hurry eats raw.
As mentioned before.
Defining trends in pinescript is technically a simple task, the hardest task is to determine congestion zones with low volume and volatility, it's in these moments that many false signals are generated, and consequently is where most setups face their maximum DrawDown.
That's why this strategy was strictly and thoroughly planned, built on a very solid foundation, to avoid as much noise as possible, for a positive and consistent equity curve in each market cycle, 'Consistency' is our 'Mantra' around here.
1️⃣4️⃣ : 🔧 Fixed Technical
• Strategy: Titan Investments|Quantitative THEMIS|Pro|BINANCE:BTCUSDTP:4h
• Pair: BTC/USDTP
• Time Frame: 4 hours
• Broker: Binance (Recommended)
For a more conservative scenario, we have built the Quantitative THEMIS for the 4h time frame, with the main focus on consistency.
So we can avoid noise as much as possible!
1️⃣5️⃣ : ❌ Fixed Outputs : 🎯 TP(%) & 🛑SL(%)
In order to build a 'perpetual' system specific to BTC/USDT, it took a lot of testing, and more testing, and a lot of investment and research.
There is one initial and fundamental point that we can address to justify the incredible consistency presented here.
That fundamental point is our exit via Take Profit or Stop Loss percentage (%).
🎯 Take Profit (%)
🛑 Stop Loss (%)
See, today I have been testing some more advanced backtesting models for some cryptocurrency systems.
In which I perform 'backtest of backtest', i.e. we use a set of strategies each focused on a principle, operating individually, but they are part of something unique, i.e. we do 'backtests' of 'backtests' together.
What I mean is that we do a lot of backtesting around here.
I can assure you, that always the best output for a trading system is to set fixed output values!
In other words:
🎯 Take Profit (%)
🛑 Stop Loss (%)
This happens because statistically setting fixed exit structures in the vast majority of times, presents a superior result on the capital/equity curve, throughout history and for the vast majority of setups compared to other exit methods.
This is due to a mathematical principle of simplicity, 'avoiding more noise'.
Thus whenever the Quantitative THEMIS strategy takes a position it has a target and a defined maximum stop percentage.
1️⃣6️⃣ : ⚠️ Risk Profile
The strategy, currently has 3 risk profiles ⚠️ patterns for 'fixed percentage exits': Take Profit (%) and Stop Loss (%) .
They are: ⚠️ Rich's Profiles
✔️🆑 Conservative: 🎯 TP=2.7 % 🛑 SL=2.7 %
❌Ⓜ️ Moderate: 🎯 TP=2.8 % 🛑 SL=2.7 %
❌🅰 Aggressive: 🎯 TP=1.6 % 🛑 SL=6.9 %
You will be able to select and switch between the above options and profiles through the 'input' menu of the strategy by navigating to the "⚠️ Risk Profile" menu.
You can then select, test and apply the Risk Profile above that best suits your risk management, expectations and reality , as well as customize all the 'fixed exit' values through the TP and SL menus below.
1️⃣7️⃣ : ⭕ Moving Exits : (Indicators)
The strategy currently also has 'Moving Exits' based on indicator signals.
These are Moving Exits (Indicators)
📈 LONG : (EXIT)
🧃 (MAO) Short : true
📉 SHORT : (EXIT)
🧃 (MAO) Long: false
You can select and toggle between the above options through the 'input' menu of the strategy by navigating to the "LONG : Exit" and "SHORT : Exit" menu.
1️⃣8️⃣ : 💸 Initial Capital
By default the "Initial Capital" set for entries and backtests of this strategy is: 10000 $
You can set another value for the 'Starting Capital' through the tradingview menu under "properties" , and edit the value of the "Initial Capital" field.
This way you can set and test other 'Entry Values' for your trades, tests and backtests.
1️⃣9️⃣ : ⚙️ Entry Options
By default the 'order size' set for this strategy is 100 % of the 'initial capital' on each new trade.
You can set and test other entry options like : contracts , cash , % of equity
You should make these changes directly in the input menu of the strategy by navigating to the menu "⚙️ Properties : TradingView" below.
⚙️ Properties : (TradingView)
📊 Strategy Type: strategy.position_size != 1
📝💲 % Order Type: % of equity
📝💲 % Order Size: 100
Leverage: 1
So you can define and test other 'Entry Options' for your trades, tests and backtests.
2️⃣0️⃣ : ❓ How to Automate this Strategy ❓ : 🤖 Automation : 'Third-Party Services'
It is possible to automate the signals of this strategy for any centralized or decentralized broker, as well as for messaging services: Discord, Telegram and Twitter.
All in an extremely simple and uncomplicated way through the tutorials available in PDF /VIDEO for our Titan Pro 👽 subscriber community.
With our tutorials in PDF and Video it will be possible to automate the signals of this strategy for the chosen service in an extremely simple way with less than 10 steps only.
Tradingview naturally doesn't count with native integration between brokers and tradingview.
But it is possible to use 'third party services' to do the integration and automation between Tradingview and your centralized or decentralized broker.
Here are the standard, available and recommended 'third party services' to automate the signals from the 'Quantitative THEMIS' strategy on the tradingview for your broker:
1) Wundertrading (Recommended):
2) 3commas:
3) Zignaly:
4) Aleeert.com (Recommended):
5) Alertatron:
Note! 'Third party services' cannot perform 'withdrawals' via their key 'API', they can only open positions, so your funds will always be 'safe' in your brokerage firm, being traded via the 'API', when they receive an entry and exit signal from this strategy.
2️⃣1️⃣ : ❓ How to Automate this Strategy ❓ : 🤖 Automation : 'Exchanges
You can automate this strategy for any of the brokers below, through your broker's 'API' by connecting it to the 'third party automation services' for tradingview available and mentioned in the menu above:
1) Binance (Recommended)
2) Bitmex
3) Bybit
4) KuCoin
5) Deribit
6) OKX
7) Coinbase
8) Huobi
9) Bitfinex
10) Bitget
11) Bittrex
12) Bitstamp
13) Gate. io
14) Kraken
15) Gemini
16) Ascendex
17) VCCE
2️⃣2️⃣ : ❓ How to Automate this Strategy ❓ : 🤖 Automation : 'Messaging Services'
You can also automate and monitor the signals of this strategy much more efficiently by sending them to the following popular messaging services:
1) Discord
2) Telegram
3) Twitter
2️⃣3️⃣ : ❓ How to Automate this Strategy ❓ : 🤖 Automation : '🧲🤖Copy-Trading'
It will also be possible to copy/replicate the entries and exits of this strategy to your broker in an extremely simple and agile way, through the available copy-trader services.
This way it will be possible to replicate the signals of this strategy at each entry and exit to your broker through the API connecting it to the integrated copy-trader services available through the tradingview automation services below:
1) Wundetrading:
2) Zignaly:
2️⃣4️⃣ : ❔ Why be a Titan Pro 👽❔
I believe that today I am at another level in 'pinescript' development.
I consider myself today a true unicorn as a pinescript developer, someone unique and very rare.
If you choose another tool or another pinescript service, this tool will be just another one, with no real results.
But if you join our Titan community, you will have access to a unique tool! And you will get real results!
I already earn money consistently with statistical and automated trading and as an expert pinescript developer.
I am here to evolve my skills as much as possible, and one day become a pinescript 'Wizard'.
So excellence, quality and professionalism will always be my north here.
You will never find a developer like me, and who will take so seriously such a revolutionary project as this one. A Maverick! ▬ The man never stops!
Here you will find the highest degree of sophistication and development in the market for 'pinescript'.
You will get the best of me and the best of pinescript possible.
Let me show you how a professional in my field does it.
Become a Titan Pro Member 👽 and get Full Access to this strategy and all the Automation Tutorials.
Be the Titan in your life!
2️⃣5️⃣ : ❔ Why be a Titan Aff 🛸❔
Get financial return for your referrals, Decentralize the World, and raise the collective consciousness.
2️⃣6️⃣ : 📋 Summary : ⚖️ Strategy: Titan Investments|Quantitative THEMIS|Pro|BINANCE:BTCUSDTP:4h
® Titan Investimentos | Quantitative THEMIS ⚖️ | Pro 👽 2.6 | Dev: © FilipeSoh 🧙 | 🤖 100% Automated : Discord, Telegram, Twitter, Wundertrading, 3commas, Zignaly, Aleeert, Alertatron, Uniswap-v3 | BINANCE:BTCUSDTPERP 4h
🛒 Subscribe this strategy ❗️ Be a Titan Member 🏛️
🛒 Titan Pro 👽 🏛️ Titan Pro 👽 Version with ✔️100% Integrated Automation 🤖 and 📚 Automation Tutorials ✔️100% available at: (PDF/VIDEO)
🛒 Titan Affiliate 🛸 🏛️ Titan Affiliate 🛸 (Subscription Sale) 🔥 Receive 50% commission
📋 Summary : QT THEMIS ⚖️
🕵️♂️ Check This Strategy..................................................................0
🦄 ® Titan Investimentos...............................................................1
👨💻 © Developer..........................................................................2
📚 Signal Automation Tutorials : (PDF/VIDEO).......................................3
👨🔧 Revision...............................................................................4
📊 Table : (BACKTEST)..................................................................5
📊 Table : (INFORMATIONS).............................................................6
⚙️ Properties : (TRADINGVIEW)........................................................7
📆 Backtest : (TRADINGVIEW)..........................................................8
⚠️ Risk Profile...........................................................................9
🟢 On 🔴 Off : (LONG/SHORT).......................................................10
📈 LONG : (ENTRY)....................................................................11
📉 SHORT : (ENTRY)...................................................................12
📈 LONG : (EXIT).......................................................................13
📉 SHORT : (EXIT)......................................................................14
🧩 (EI) External Indicator.............................................................15
📡 (QT) Quantitative...................................................................16
🎠 (FF) Forecast......................................................................17
🅱 (BB) Bollinger Bands................................................................18
🧃 (MAP) Moving Average Primary......................................................19
🧃 (MAP) Labels.........................................................................20
🍔 (MAQ) Moving Average Quaternary.................................................21
🍟 (MACD) Moving Average Convergence Divergence...............................22
📣 (VWAP) Volume Weighted Average Price........................................23
🪀 (HL) HILO..........................................................................24
🅾 (OBV) On Balance Volume.........................................................25
🥊 (SAR) Stop and Reverse...........................................................26
🛡️ (DSR) Dynamic Support and Resistance..........................................27
🔊 (VD) Volume Directional..........................................................28
🧰 (RSI) Relative Momentum Index.................................................29
🎯 (TP) Take Profit %..................................................................30
🛑 (SL) Stop Loss %....................................................................31
🤖 Automation Selected...............................................................32
📱💻 Discord............................................................................33
📱💻 Telegram..........................................................................34
📱💻 Twitter...........................................................................35
🤖 Wundertrading......................................................................36
🤖 3commas............................................................................37
🤖 Zignaly...............................................................................38
🤖 Aleeert...............................................................................39
🤖 Alertatron...........................................................................40
🤖 Uniswap-v3..........................................................................41
🧲🤖 Copy-Trading....................................................................42
♻️ ® No Repaint........................................................................43
🔒 Copyright ©️..........................................................................44
🏛️ Be a Titan Member..................................................................45
Nº Active Users..........................................................................46
⏱ Time Left............................................................................47
| 0 | 🕵️♂️ Check This Strategy
🕵️♂️ Version Demo: 🐄 Version with ❌non-integrated automation 🤖 and 📚 Tutorials for automation ❌not available
🕵️♂️ Version Pro: 👽 Version with ✔️100% Integrated Automation 🤖 and 📚 Automation Tutorials ✔️100% available at: (PDF/VIDEO)
| 1 | 🦄 ® Titan Investimentos
Decentralizing the World 🗺
Raising the Collective Conscience 🗺
🦄Site:
🦄TradingView: www.tradingview.com
🦄Discord:
🦄Telegram:
🦄Youtube:
🦄Twitter:
🦄Instagram:
🦄TikTok:
🦄Linkedin:
🦄E-mail:
| 2 | 👨💻 © Developer
🧠 Developer: @FilipeSoh🧙
📺 TradingView: www.tradingview.com
☑️ Linkedin:
✅ Fiverr:
✅ Upwork:
🎥 YouTube:
🐤 Twitter:
🤳 Instagram:
| 3 | 📚 Signal Automation Tutorials : (PDF/VIDEO)
📚 Discord: 🔗 Link: 🔒Titan Pro👽
📚 Telegram: 🔗 Link: 🔒Titan Pro👽
📚 Twitter: 🔗 Link: 🔒Titan Pro👽
📚 Wundertrading: 🔗 Link: 🔒Titan Pro👽
📚 3comnas: 🔗 Link: 🔒Titan Pro👽
📚 Zignaly: 🔗 Link: 🔒Titan Pro👽
📚 Aleeert: 🔗 Link: 🔒Titan Pro👽
📚 Alertatron: 🔗 Link: 🔒Titan Pro👽
📚 Uniswap-v3: 🔗 Link: 🔒Titan Pro👽
📚 Copy-Trading: 🔗 Link: 🔒Titan Pro👽
| 4 | 👨🔧 Revision
👨🔧 Start Of Operations: 01 Jan 2019 21:00 -0300 💡 Start Of Operations (Skin in the game) : Revision 1.0
👨🔧 Previous Review: 01 Jan 2022 21:00 -0300 💡 Previous Review : Revision 2.0
👨🔧 Current Revision: 01 Jan 2023 21:00 -0300 💡 Current Revision : Revision 2.6
👨🔧 Next Revision: 28 May 2023 21:00 -0300 💡 Next Revision : Revision 2.7
| 5 | 📊 Table : (BACKTEST)
📊 Table: true
🖌️ Style: label.style_label_left
📐 Size: size_small
📏 Line: defval
🎨 Color: #131722
| 6 | 📊 Table : (INFORMATIONS)
📊 Table: false
🖌️ Style: label.style_label_right
📐 Size: size_small
📏 Line: defval
🎨 Color: #131722
| 7 | ⚙️ Properties : (TradingView)
📊 Strategy Type: strategy.position_size != 1
📝💲 % Order Type: % of equity
📝💲 % Order Size: 100 %
🚀 Leverage: 1
| 8 | 📆 Backtest : (TradingView)
🗓️ Mon: true
🗓️ Tue: true
🗓️ Wed: true
🗓️ Thu: true
🗓️ Fri: true
🗓️ Sat: true
🗓️ Sun: true
📆 Range: custom
📆 Start: UTC 31 Oct 2008 00:00
📆 End: UTC 31 Oct 2030 23:45
📆 Session: 0000-0000
📆 UTC: UTC
| 9 | ⚠️ Risk Profile
✔️🆑 Conservative: 🎯 TP=2.7 % 🛑 SL=2.7 %
❌Ⓜ️ Moderate: 🎯 TP=2.8 % 🛑 SL=2.7 %
❌🅰 Aggressive: 🎯 TP=1.6 % 🛑 SL=6.9 %
| 10 | 🟢 On 🔴 Off : (LONG/SHORT)
🟢📈 LONG: true
🟢📉 SHORT: true
| 11 | 📈 LONG : (ENTRY)
📡 (QT) Long: true
🧃 (MAP) Long: false
🅱 (BB) Long: false
🍟 (MACD) Long: false
🅾 (OBV) Long: false
| 12 | 📉 SHORT : (ENTRY)
📡 (QT) Short: true
🧃 (MAP) Short: false
🅱 (BB) Short: false
🍟 (MACD) Short: false
🅾 (OBV) Short: false
| 13 | 📈 LONG : (EXIT)
🧃 (MAP) Short: true
| 14 | 📉 SHORT : (EXIT)
🧃 (MAP) Long: false
| 15 | 🧩 (EI) External Indicator
🧩 (EI) Connect your external indicator/filter: false
🧩 (EI) Connect your indicator here (Study mode only): close
🧩 (EI) Connect your indicator here (Study mode only): close
| 16 | 📡 (QT) Quantitative
📡 (QT) Quantitative: true
📡 (QT) Market: BINANCE:BTCUSDTPERP
📡 (QT) Dice: openai
| 17 | 🎠 (FF) Forecast
🎠 (FF) Include current unclosed current candle: true
🎠 (FF) Forecast Type: flat
🎠 (FF) Nº of candles to use in linear regression: 3
| 18 | 🅱 (BB) Bollinger Bands
🅱 (BB) Bollinger Bands: true
🅱 (BB) Type: EMA
🅱 (BB) Period: 20
🅱 (BB) Source: close
🅱 (BB) Multiplier: 2
🅱 (BB) Linewidth: 0
🅱 (BB) Color: #131722
| 19 | 🧃 (MAP) Moving Average Primary
🧃 (MAP) Moving Average Primary: true
🧃 (MAP) BarColor: false
🧃 (MAP) Background: false
🧃 (MAP) Type: SMA
🧃 (MAP) Source: open
🧃 (MAP) Period: 100
🧃 (MAP) Multiplier: 2.0
🧃 (MAP) Linewidth: 2
🧃 (MAP) Color P: #42bda8
🧃 (MAP) Color N: #801922
| 20 | 🧃 (MAP) Labels
🧃 (MAP) Labels: true
🧃 (MAP) Style BUY ZONE: shape.labelup
🧃 (MAP) Color BUY ZONE: #42bda8
🧃 (MAP) Style SELL ZONE: shape.labeldown
🧃 (MAP) Color SELL ZONE: #801922
| 21 | 🍔 (MAQ) Moving Average Quaternary
🍔 (MAQ) Moving Average Quaternary: true
🍔 (MAQ) BarColor: false
🍔 (MAQ) Background: false
🍔 (MAQ) Type: SMA
🍔 (MAQ) Source: close
🍔 (MAQ) Primary: 14
🍔 (MAQ) Secondary: 22
🍔 (MAQ) Tertiary: 44
🍔 (MAQ) Quaternary: 16
🍔 (MAQ) Linewidth: 0
🍔 (MAQ) Color P: #42bda8
🍔 (MAQ) Color N: #801922
| 22 | 🍟 (MACD) Moving Average Convergence Divergence
🍟 (MACD) Macd Type: EMA
🍟 (MACD) Signal Type: EMA
🍟 (MACD) Source: close
🍟 (MACD) Fast: 12
🍟 (MACD) Slow: 26
🍟 (MACD) Smoothing: 9
| 23 | 📣 (VWAP) Volume Weighted Average Price
📣 (VWAP) Source: close
📣 (VWAP) Period: 340
📣 (VWAP) Momentum A: 84
📣 (VWAP) Momentum B: 150
📣 (VWAP) Average Volume: 1
📣 (VWAP) Multiplier: 1
📣 (VWAP) Diviser: 2
| 24 | 🪀 (HL) HILO
🪀 (HL) Type: SMA
🪀 (HL) Function: Maverick🧙
🪀 (HL) Source H: high
🪀 (HL) Source L: low
🪀 (HL) Period: 20
🪀 (HL) Momentum: 26
🪀 (HL) Diviser: 2
🪀 (HL) Multiplier: 1
| 25 | 🅾 (OBV) On Balance Volume
🅾 (OBV) Type: EMA
🅾 (OBV) Source: close
🅾 (OBV) Period: 16
🅾 (OBV) Diviser: 2
🅾 (OBV) Multiplier: 1
| 26 | 🥊 (SAR) Stop and Reverse
🥊 (SAR) Source: close
🥊 (SAR) High: 1.8
🥊 (SAR) Mid: 1.6
🥊 (SAR) Low: 1.6
🥊 (SAR) Diviser: 2
🥊 (SAR) Multiplier: 1
| 27 | 🛡️ (DSR) Dynamic Support and Resistance
🛡️ (DSR) Source D: close
🛡️ (DSR) Source R: high
🛡️ (DSR) Source S: low
🛡️ (DSR) Momentum R: 0
🛡️ (DSR) Momentum S: 2
🛡️ (DSR) Diviser: 2
🛡️ (DSR) Multiplier: 1
| 28 | 🔊 (VD) Volume Directional
🔊 (VD) Type: SMA
🔊 (VD) Period: 68
🔊 (VD) Momentum: 3.8
🔊 (VD) Diviser: 2
🔊 (VD) Multiplier: 1
| 29 | 🧰 (RSI) Relative Momentum Index
🧰 (RSI) Type UP: EMA
🧰 (RSI) Type DOWN: EMA
🧰 (RSI) Source: close
🧰 (RSI) Period: 29
🧰 (RSI) Smoothing: 22
🧰 (RSI) Momentum R: 64
🧰 (RSI) Momentum S: 142
🧰 (RSI) Diviser: 2
🧰 (RSI) Multiplier: 1
| 30 | 🎯 (TP) Take Profit %
🎯 (TP) Take Profit: false
🎯 (TP) %: 2.2
🎯 (TP) Color: #42bda8
🎯 (TP) Linewidth: 1
| 31 | 🛑 (SL) Stop Loss %
🛑 (SL) Stop Loss: false
🛑 (SL) %: 2.7
🛑 (SL) Color: #801922
🛑 (SL) Linewidth: 1
| 32 | 🤖 Automation : Discord | Telegram | Twitter | Wundertrading | 3commas | Zignaly | Aleeert | Alertatron | Uniswap-v3
🤖 Automation Selected : Discord
| 33 | 🤖 Discord
🔗 Link Discord: discord.com
🔗 Link 📚 Automation: 🔒Titan Pro👽
📱💻 Discord ▬ Enter Long: 🔒Titan Pro👽
📱💻 Discord ▬ Exit Long: 🔒Titan Pro👽
📱💻 Discord ▬ Enter Short: 🔒Titan Pro👽
📱💻 Discord ▬ Exit Short: 🔒Titan Pro👽
| 34 | 🤖 Telegram
🔗 Link Telegram: telegram.org
🔗 Link 📚 Automation: 🔒Titan Pro👽
📱💻 Telegram ▬ Enter Long: 🔒Titan Pro👽
📱💻 Telegram ▬ Exit Long: 🔒Titan Pro👽
📱💻 Telegram ▬ Enter Short: 🔒Titan Pro👽
📱💻 Telegram ▬ Exit Short: 🔒Titan Pro👽
| 35 | 🤖 Twitter
🔗 Link Twitter: twitter.com
🔗 Link 📚 Automation: 🔒Titan Pro👽
📱💻 Twitter ▬ Enter Long: 🔒Titan Pro👽
📱💻 Twitter ▬ Exit Long: 🔒Titan Pro👽
📱💻 Twitter ▬ Enter Short: 🔒Titan Pro👽
📱💻 Twitter ▬ Exit Short: 🔒Titan Pro👽
| 36 | 🤖 Wundertrading : Binance | Bitmex | Bybit | KuCoin | Deribit | OKX | Coinbase | Huobi | Bitfinex | Bitget
🔗 Link Wundertrading: wundertrading.com
🔗 Link 📚 Automation: 🔒Titan Pro👽
📱💻 Wundertrading ▬ Enter Long: 🔒Titan Pro👽
📱💻 Wundertrading ▬ Exit Long: 🔒Titan Pro👽
📱💻 Wundertrading ▬ Enter Short: 🔒Titan Pro👽
📱💻 Wundertrading ▬ Exit Short: 🔒Titan Pro👽
| 37 | 🤖 3commas : Binance | Bybit | OKX | Bitfinex | Coinbase | Deribit | Bitmex | Bittrex | Bitstamp | Gate.io | Kraken | Gemini | Huobi | KuCoin
🔗 Link 3commas: 3commas.io
🔗 Link 📚 Automation: 🔒Titan Pro👽
📱💻 3commas ▬ Enter Long: 🔒Titan Pro👽
📱💻 3commas ▬ Exit Long: 🔒Titan Pro👽
📱💻 3commas ▬ Enter Short: 🔒Titan Pro👽
📱💻 3commas ▬ Exit Short: 🔒Titan Pro👽
| 38 | 🤖 Zignaly : Binance | Ascendex | Bitmex | Kucoin | VCCE
🔗 Link Zignaly: zignaly.com
🔗 Link 📚 Automation: 🔒Titan Pro👽
🤖 Type Automation: Profit Sharing
🤖 Type Provider: Webook
🔑 Key: 🔒Titan Pro👽
🤖 pair: BTCUSDTP
🤖 exchange: binance
🤖 exchangeAccountType: futures
🤖 orderType: market
🚀 leverage: 1x
% positionSizePercentage: 100 %
💸 positionSizeQuote: 10000 $
🆔 signalId: @Signal1234
| 39 | 🤖 Aleeert : Binance
🔗 Link Aleeert: aleeert.com
🔗 Link 📚 Automation: 🔒Titan Pro👽
📱💻 Aleeert ▬ Enter Long: 🔒Titan Pro👽
📱💻 Aleeert ▬ Exit Long: 🔒Titan Pro👽
📱💻 Aleeert ▬ Enter Short: 🔒Titan Pro👽
📱💻 Aleeert ▬ Exit Short: 🔒Titan Pro👽
| 40 | 🤖 Alertatron : Binance | Bybit | Deribit | Bitmex
🔗 Link Alertatron: alertatron.com
🔗 Link 📚 Automation: 🔒Titan Pro👽
📱💻 Alertatron ▬ Enter Long: 🔒Titan Pro👽
📱💻 Alertatron ▬ Exit Long: 🔒Titan Pro👽
📱💻 Alertatron ▬ Enter Short: 🔒Titan Pro👽
📱💻 Alertatron ▬ Exit Short: 🔒Titan Pro👽
| 41 | 🤖 Uniswap-v3
🔗 Link Alertatron: uniswap.org
🔗 Link 📚 Automation: 🔒Titan Pro👽
📱💻 Uniswap-v3 ▬ Enter Long: 🔒Titan Pro👽
📱💻 Uniswap-v3 ▬ Exit Long: 🔒Titan Pro👽
📱💻 Uniswap-v3 ▬ Enter Short: 🔒Titan Pro👽
📱💻 Uniswap-v3 ▬ Exit Short: 🔒Titan Pro👽
| 42 | 🧲🤖 Copy-Trading : Zignaly | Wundertrading
🔗 Link 📚 Copy-Trading: 🔒Titan Pro👽
🧲🤖 Copy-Trading ▬ Zignaly: 🔒Titan Pro👽
🧲🤖 Copy-Trading ▬ Wundertrading: 🔒Titan Pro👽
| 43 | ♻️ ® Don't Repaint!
♻️ This Strategy does not Repaint!: ® Signs Do not repaint❕
♻️ This is a Real Strategy!: Quality : ® Titan Investimentos
📋️️ Get more information about Repainting here:
| 44 | 🔒 Copyright ©️
🔒 Copyright ©️: Copyright © 2023-2024 All rights reserved, ® Titan Investimentos
🔒 Copyright ©️: ® Titan Investimentos
🔒 Copyright ©️: Unique and Exclusive Strategy. All rights reserved
| 45 | 🏛️ Be a Titan Members
🏛️ Titan Pro 👽 Version with ✔️100% Integrated Automation 🤖 and 📚 Automation Tutorials ✔️100% available at: (PDF/VIDEO)
🏛️ Titan Affiliate 🛸 (Subscription Sale) 🔥 Receive 50% commission
| 46 | ⏱ Time Left
Time Left Titan Demo 🐄: ⏱♾ | ⏱ : ♾ Titan Demo 🐄 Version with ❌non-integrated automation 🤖 and 📚 Tutorials for automation ❌not available
Time Left Titan Pro 👽: 🔒Titan Pro👽 | ⏱ : Pro Plans: 30 Days, 90 Days, 12 Months, 24 Months. (👽 Pro 🅼 Monthly, 👽 Pro 🆀 Quarterly, 👽 Pro🅰 Annual, 👽 Pro👾Two Years)
| 47 | Nº Active Users
Nº Active Subscribers Titan Pro 👽: 5️⃣6️⃣ | 1✔️ 5✔️ 10✔️ 100❌ 1K❌ 10K❌ 50K❌ 100K❌ 1M❌ 10M❌ 100M❌ : ⏱ Active Users is updated every 24 hours (Check on indicator)
Nº Active Affiliates Titan Aff 🛸: 6️⃣ | 1✔️ 5✔️ 10❌ 100❌ 1K❌ 10K❌ 50K❌ 100K❌ 1M❌ 10M❌ 100M❌ : ⏱ Active Users is updated every 24 hours (Check on indicator)
2️⃣7️⃣ : 📊 PERFORMANCE : 🆑 Conservative
📊 Exchange: Binance
📊 Pair: BINANCE: BTCUSDTPERP
📊 TimeFrame: 4h
📊 Initial Capital: 10000 $
📊 Order Type: % equity
📊 Size Per Order: 100 %
📊 Commission: 0.03 %
📊 Pyramid: 1
• ⚠️ Risk Profile: 🆑 Conservative: 🎯 TP=2.7 % | 🛑 SL=2.7 %
• 📆All years: 🆑 Conservative: 🚀 Leverage 1️⃣x
📆 Start: September 23, 2019
📆 End: January 11, 2023
📅 Days: 1221
📅 Bars: 7325
Net Profit:
🟢 + 1669.89 %
💲 + 166989.43 USD
Total Close Trades:
⚪️ 369
Percent Profitable:
🟡 64.77 %
Profit Factor:
🟢 2.314
DrawDrown Maximum:
🔴 -24.82 %
💲 -10221.43 USD
Avg Trade:
💲 + 452.55 USD
✔️ Trades Winning: 239
❌ Trades Losing: 130
✔️ Average Gross Win: + 12.31 %
❌ Average Gross Loss: - 9.78 %
✔️ Maximum Consecutive Wins: 9
❌ Maximum Consecutive Losses: 6
% Average Gain Annual: 499.33 %
% Average Gain Monthly: 41.61 %
% Average Gain Weekly: 9.6 %
% Average Gain Day: 1.37 %
💲 Average Gain Annual: 49933 $
💲 Average Gain Monthly: 4161 $
💲 Average Gain Weekly: 960 $
💲 Average Gain Day: 137 $
• 📆 Year: 2020: 🆑 Conservative: 🚀 Leverage 1️⃣x
• 📆 Year: 2021: 🆑 Conservative: 🚀 Leverage 1️⃣x
• 📆 Year: 2022: 🆑 Conservative: 🚀 Leverage 1️⃣x
2️⃣8️⃣ : 📊 PERFORMANCE : Ⓜ️ Moderate
📊 Exchange: Binance
📊 Pair: BINANCE: BTCUSDTPERP
📊 TimeFrame: 4h
📊 Initial Capital: 10000 $
📊 Order Type: % equity
📊 Size Per Order: 100 %
📊 Commission: 0.03 %
📊 Pyramid: 1
• ⚠️ Risk Profile: Ⓜ️ Moderate: 🎯 TP=2.8 % | 🛑 SL=2.7 %
• 📆 All years: Ⓜ️ Moderate: 🚀 Leverage 1️⃣x
📆 Start: September 23, 2019
📆 End: January 11, 2023
📅 Days: 1221
📅 Bars: 7325
Net Profit:
🟢 + 1472.04 %
💲 + 147199.89 USD
Total Close Trades:
⚪️ 362
Percent Profitable:
🟡 63.26 %
Profit Factor:
🟢 2.192
DrawDrown Maximum:
🔴 -22.69 %
💲 -9269.33 USD
Avg Trade:
💲 + 406.63 USD
✔️ Trades Winning: 229
❌ Trades Losing : 133
✔️ Average Gross Win: + 11.82 %
❌ Average Gross Loss: - 9.29 %
✔️ Maximum Consecutive Wins: 9
❌ Maximum Consecutive Losses: 8
% Average Gain Annual: 440.15 %
% Average Gain Monthly: 36.68 %
% Average Gain Weekly: 8.46 %
% Average Gain Day: 1.21 %
💲 Average Gain Annual: 44015 $
💲 Average Gain Monthly: 3668 $
💲 Average Gain Weekly: 846 $
💲 Average Gain Day: 121 $
• 📆 Year: 2020: Ⓜ️ Moderate: 🚀 Leverage 1️⃣x
• 📆 Year: 2021: Ⓜ️ Moderate: 🚀 Leverage 1️⃣x
• 📆 Year: 2022: Ⓜ️ Moderate: 🚀 Leverage 1️⃣x
2️⃣9️⃣ : 📊 PERFORMANCE : 🅰 Aggressive
📊 Exchange: Binance
📊 Pair: BINANCE: BTCUSDTPERP
📊 TimeFrame: 4h
📊 Initial Capital: 10000 $
📊 Order Type: % equity
📊 Size Per Order: 100 %
📊 Commission: 0.03 %
📊 Pyramid: 1
• ⚠️ Risk Profile: 🅰 Aggressive: 🎯 TP=1.6 % | 🛑 SL=6.9 %
• 📆 All years: 🅰 Aggressive: 🚀 Leverage 1️⃣x
📆 Start: September 23, 2019
📆 End: January 11, 2023
📅 Days: 1221
📅 Bars: 7325
Net Profit:
🟢 + 989.38 %
💲 + 98938.38 USD
Total Close Trades:
⚪️ 380
Percent Profitable:
🟢 84.47 %
Profit Factor:
🟢 2.156
DrawDrown Maximum:
🔴 -17.88 %
💲 -9182.84 USD
Avg Trade:
💲 + 260.36 USD
✔️ Trades Winning: 321
❌ Trades Losing: 59
✔️ Average Gross Win: + 5.75 %
❌ Average Gross Loss: - 14.51 %
✔️ Maximum Consecutive Wins: 21
❌ Maximum Consecutive Losses: 6
% Average Gain Annual: 295.84 %
% Average Gain Monthly: 24.65 %
% Average Gain Weekly: 5.69 %
% Average Gain Day: 0.81 %
💲 Average Gain Annual: 29584 $
💲 Average Gain Monthly: 2465 $
💲 Average Gain Weekly: 569 $
💲 Average Gain Day: 81 $
• 📆 Year: 2020: 🅰 Aggressive: 🚀 Leverage 1️⃣x
• 📆 Year: 2021: 🅰 Aggressive: 🚀 Leverage 1️⃣x
• 📆 Year: 2022: 🅰 Aggressive: 🚀 Leverage 1️⃣x
3️⃣0️⃣ : 🛠️ Roadmap
🛠️• 14/ 01 /2023 : Titan THEMIS Launch
🛠️• Updates January/2023 :
• 📚 Tutorials for Automation 🤖 already Available : ✔️
• ✔️ Discord
• ✔️ Wundertrading
• ✔️ Zignaly
• 📚 Tutorials for Automation 🤖 In Preparation : ⭕
• ⭕ Telegram
• ⭕ Twitter
• ⭕ 3comnas
• ⭕ Aleeert
• ⭕ Alertatron
• ⭕ Uniswap-v3
• ⭕ Copy-Trading
🛠️• Updates February/2023 :
• 📰 Launch of advertising material for Titan Affiliates 🛸
• 🛍️🎥🖼️📊 (Sales Page/VSL/Videos/Creative/Infographics)
🛠️• 28/05/2023 : Titan THEMIS update ▬ Version 2.7
🛠️• 28/05/2023 : BOT BOB release ▬ Version 1.0
• (Native Titan THEMIS Automation - Through BOT BOB, a bot for automation of signals, indicators and strategies of TradingView, of own code ▬ in validation.
• BOT BOB
Automation/Connection :
• API - For Centralized Brokers.
• Smart Contracts - Wallet Web - For Decentralized Brokers.
• This way users can automate any indicator or strategy of TradingView and Titan in a decentralized, secure and simplified way.
• Without having the need to use 'third party services' for automating TradingView indicators and strategies like the ones available above.
🛠️• 28/05/2023 : Release ▬ Titan Culture Guide 📝
3️⃣1️⃣ : 🧻 Notes ❕
🧻 • Note ❕ The "Demo 🐄" version, ❌does not have 'integrated automation', to automate the signals of this strategy and enjoy a fully automated system, you need to have access to the Pro version with '100% integrated automation' and all the tutorials for automation available. Become a Titan Pro 👽
🧻 • Note ❕ You will also need to be a "Pro User or higher on Tradingview", to be able to use the webhook feature available only for 'paid' profiles on the platform.
With the webhook feature it is possible to send the signals of this strategy to almost anywhere, in our case to centralized or decentralized brokerages, also to popular messaging services such as: Discord, Telegram or Twiter.
3️⃣2️⃣ : 🚨 Disclaimer ❕❗
🚨 • Disclaimer ❕❕ Past positive result and performance of a system does not guarantee its positive result and performance for the future!
🚨 • Disclaimer ❗❗❗ When using this strategy: Titan Investments is totally Exempt from any claim of liability for losses. The responsibility on the management of your funds is solely yours. This is a very high risk/volatility market! Understand your place in the market.
3️⃣3️⃣ : ♻️ ® No Repaint
This Strategy does not Repaint! This is a real strategy!
3️⃣4️⃣ : 🔒 Copyright ©️
Copyright © 2022-2023 All rights reserved, ® Titan Investimentos
3️⃣5️⃣ : 👏 Acknowledgments
I want to start this message in thanks to TradingView and all the Pinescript community for all the 'magic' created here, a unique ecosystem! rich and healthy, a fertile soil, a 'new world' of possibilities, for a complete deepening and improvement of our best personal skills.
I leave here my immense thanks to the whole community: Tradingview, Pinecoders, Wizards and Moderators.
I was not born Rich .
Thanks to TradingView and pinescript and all its transformation.
I could develop myself and the best of me and the best of my skills.
And consequently build wealth and patrimony.
Gratitude.
One more story for the infinite book !
If you were born poor you were born to be rich !
Raising🔼 the level and raising🔼 the ruler! 📏
My work is my 'debauchery'! Do better! 💐🌹
Soul of a first-timer! Creativity Exudes! 🦄
This is the manifestation of God's magic in me. This is the best of me. 🧙
You will copy me, I know. So you owe me. 💋
My mission here is to raise the consciousness and self-esteem of all Titans and Titanids! Welcome! 🧘 🏛️
The only way to accomplish great work is to do what you love ! Before I learned to program I was wasting my life!
Death is the best creation of life .
Now you are the new , but in the not so distant future you will gradually become the old . Here I stay forever!
Playing the game like an Athlete! 🖼️ Enjoy and Enjoy 🍷 🗿
In honor of: BOB ☆
1 name, 3 letters, 3 possibilities, and if read backwards it's the same thing, a palindrome. ☘
Gratitude to the oracles that have enabled me the 'luck' to get this far: Dal&Ni&Fer
3️⃣6️⃣ : 👮 House Rules : 📺 TradingView
House Rules : This publication and strategy follows all TradingView house guidelines and rules:
📺 TradingView House Rules: www.tradingview.com
📺 Script publication rules: www.tradingview.com
📺 Vendor requirements: www.tradingview.com
📺 Links/References rules: www.tradingview.com
3️⃣7️⃣ : 🏛️ Become a Titan Pro member 👽
🟩 Titan Pro 👽 🟩
3️⃣8️⃣ : 🏛️ Be a member Titan Aff 🛸
🟥 Titan Affiliate 🛸 🟥

Titan Investments|Quantitative THEMIS|Demo|BINANCE:BTCUSDTP:4hInvestment Strategy (Quantitative Trading)
| 🛑 | Watch "LIVE" and 'COPY' this strategy in real time:
🔗 Link: www.tradingview.com
Hello, welcome, feel free 🌹💐
Since the stone age to the most technological age, one thing has not changed, that which continues impress human beings the most, is the other human being!
Deep down, it's all very simple or very complicated, depends on how you look at it.
I believe that everyone was born to do something very well in life.
But few are those who have, let's use the word 'luck' .
Few are those who have the 'luck' to discover this thing.
That is why few are happy and successful in their jobs and professions.
Thank God I had this 'luck' , and discovered what I was born to do well.
And I was born to program. 👨💻
📋 Summary : Project Titan
0️⃣ : 🦄 Project Titan
1️⃣ : ⚖️ Quantitative THEMIS
2️⃣ : 🏛️ Titan Community
3️⃣ : 👨💻 Who am I ❔
4️⃣ : ❓ What is Statistical/Probabilistic Trading ❓
5️⃣ : ❓ How Statistical/Probabilistic Trading works ❓
6️⃣ : ❓ Why use a Statistical/Probabilistic system ❓
7️⃣ : ❓ Why the human brain is not prepared to do Trading ❓
8️⃣ : ❓ What is Backtest ❓
9️⃣ : ❓ How to build a Consistent system ❓
🔟 : ❓ What is a Quantitative Trading system ❓
1️⃣1️⃣ : ❓ How to build a Quantitative Trading system ❓
1️⃣2️⃣ : ❓ How to Exploit Market Anomalies ❓
1️⃣3️⃣ : ❓ What Defines a Robust, Profitable and Consistent System ❓
1️⃣4️⃣ : 🔧 Fixed Technical
1️⃣5️⃣ : ❌ Fixed Outputs : 🎯 TP(%) & 🛑SL(%)
1️⃣6️⃣ : ⚠️ Risk Profile
1️⃣7️⃣ : ⭕ Moving Exits : (Indicators)
1️⃣8️⃣ : 💸 Initial Capital
1️⃣9️⃣ : ⚙️ Entry Options
2️⃣0️⃣ : ❓ How to Automate this Strategy ❓ : 🤖 Automation : 'Third-Party Services'
2️⃣1️⃣ : ❓ How to Automate this Strategy ❓ : 🤖 Automation : 'Exchanges
2️⃣2️⃣ : ❓ How to Automate this Strategy ❓ : 🤖 Automation : 'Messaging Services'
2️⃣3️⃣ : ❓ How to Automate this Strategy ❓ : 🤖 Automation : '🧲🤖Copy-Trading'
2️⃣4️⃣ : ❔ Why be a Titan Pro 👽❔
2️⃣5️⃣ : ❔ Why be a Titan Aff 🛸❔
2️⃣6️⃣ : 📋 Summary : ⚖️ Strategy: Titan Investments|Quantitative THEMIS|Demo|BINANCE:BTCUSDTP:4h
2️⃣7️⃣ : 📊 PERFORMANCE : 🆑 Conservative
2️⃣8️⃣ : 📊 PERFORMANCE : Ⓜ️ Moderate
2️⃣9️⃣ : 📊 PERFORMANCE : 🅰 Aggressive
3️⃣0️⃣ : 🛠️ Roadmap
3️⃣1️⃣ : 🧻 Notes ❕
3️⃣2️⃣ : 🚨 Disclaimer ❕❗
3️⃣3️⃣ : ♻️ ® No Repaint
3️⃣4️⃣ : 🔒 Copyright ©️
3️⃣5️⃣ : 👏 Acknowledgments
3️⃣6️⃣ : 👮 House Rules : 📺 TradingView
3️⃣7️⃣ : 🏛️ Become a Titan Pro member 👽
3️⃣8️⃣ : 🏛️ Be a member Titan Aff 🛸
0️⃣ : 🦄 Project Titan
This is the first real, 100% automated Quantitative Strategy made available to the public and the pinescript community for TradingView.
You will be able to automate all signals of this strategy for your broker , centralized or decentralized and also for messaging services : Discord, Telegram or Twitter .
This is the first strategy of a larger project, in 2023, I will provide a total of 6 100% automated 'Quantitative' strategies to the pinescript community for TradingView.
The future strategies to be shared here will also be unique , never before seen, real 'Quantitative' bots with real, validated results in real operation.
Just like the 'Quantitative THEMIS' strategy, it will be something out of the loop throughout the pinescript/tradingview community, truly unique tools for building mutual wealth consistently and continuously for our community.
1️⃣ : ⚖️ Quantitative THEMIS : Titan Investments|Quantitative THEMIS|Demo|BINANCE:BTCUSDTP:4h
This is a truly unique and out of the curve strategy for BTC /USD .
A truly real strategy, with real, validated results and in real operation.
A unique tool for building mutual wealth, consistently and continuously for the members of the Titan community.
Initially we will operate on a monthly, quarterly, annual or biennial subscription service.
Our goal here is to build a great community, in exchange for an extremely fair value for the use of our truly unique tools, which bring and will bring real results to our community members.
With this business model it will be possible to provide all Titan users and community members with the purest and highest degree of sophistication in the market with pinescript for tradingview, providing unique and truly profitable strategies.
My goal here is to offer the best to our members!
The best 'pinescript' tradingview service in the world!
We are the only Start-Up in the world that will decentralize real and full access to truly real 'quantitative' tools that bring and will bring real results for mutual and ongoing wealth building for our community.
2️⃣ : 🏛️ Titan Community : 👽 Pro 🔁 Aff 🛸
Become a Titan Pro 👽
To get access to the strategy: "Quantitative THEMIS" , and future Titan strategies in a 100% automated way, along with all tutorials for automation.
Pro Plans: 30 Days, 90 Days, 12 Months, 24 Months.
👽 Pro 🅼 Monthly
👽 Pro 🆀 Quarterly
👽 Pro🅰 Annual
👽 Pro👾Two Years
You will have access to a truly unique system that is out of the curve .
A 100% real, 100% automated, tested, validated, profitable, and in real operation strategy.
Become a Titan Affiliate 🛸
By becoming a Titan Affiliate 🛸, you will automatically receive 50% of the value of each new subscription you refer .
You will receive 50% for any of the above plans that you refer .
This way we will encourage our community to grow in a fair and healthy way, because we know what we have in our hands and what we deliver real value to our users.
We are at the highest level of sophistication in the market, the consistency here and the results here speak for themselves.
So growing our community means growing mutual wealth and raising collective conscience.
Wealth must be created not divided.
And here we are creating mutual wealth on all ends and in all ways.
A non-zero sum system, where everybody wins.
3️⃣ : 👨💻 Who am I ❔
My name is FilipeSoh I am 26 years old, Technical Analyst, Trader, Computer Engineer, pinescript Specialist, with extensive experience in several languages and technologies.
For the last 4 years I have been focusing on developing, editing and creating pinescript indicators and strategies for Tradingview for people and myself.
Full-time passionate workaholic pinescript developer with over 10,000 hours of pinescript development.
• Pinescript expert ▬Tradingview.
• Specialist in Automated Trading
• Specialist in Quantitative Trading.
• Statistical/Probabilistic Trading Specialist - Mark Douglas Scholl.
• Inventor of the 'Classic Forecast' Indicators.
• Inventor of the 'Backtest Table'.
4️⃣ : ❓ What is Statistical/Probabilistic Trading ❓
Statistical/probabilistic trading is the only way to get a positive mathematical expectation regarding the market and consequently that is the only way to make money consistently from it.
I will present below some more details about the Quantitative THEMIS strategy, it is a real strategy, tested, validated and in real operation, 'Skin in the Game' , a consistent way to make money with statistical/probabilistic trading in a 100% automated.
I am a Technical Analyst , I used to be a Discretionary Trader , today I am 100% a Statistical Trader .
I've gotten rich and made a lot of money, and I've also lost a lot with 'leverage'.
That was a few years ago.
The book that changed everything for me was "Trading in The Zone" by Mark Douglas.
That's when I understood that the market is just a game of statistics and probability, like a casino!
It was then that I understood that the human brain is not prepared for trading, because it involves triggers and mental emotions.
And emotions in trading and in making trading decisions do not go well together, not in the long run, because you always have the burden of being wrong with the outcome of that particular position.
But remembering that the market is just a statistical game!
5️⃣ : ❓ How Statistical/Probabilistic Trading works ❓
Let's use a 'coin' as an example:
If we toss a 'coin' up 10 times.
Do you agree that it is impossible for us to know exactly the result of the 'plays' before they actually happen?
As in the example above, would you agree, that we cannot "guess" the outcome of a position before it actually happens?
As much as we cannot "guess" whether the coin will drop heads or tails on each flip.
We can analyze the "backtest" of the 10 moves made with that coin:
If we analyze the 10 moves and count the number of times the coin fell heads or tails in a specific sequence, we then have a percentage of times the coin fell heads or tails, so we have a 'backtest' of those moves.
Then on the next flip we can now assume a point or a favorable position for one side, the side with the highest probability .
In a nutshell, this is more or less how probabilistic statistical trading works.
As Statistical Traders we can never say whether such a Trader/Position we take will be a winner or a loser.
But still we can have a positive and consistent result in a "sequence" of trades, because before we even open a position, backtests have already been performed so we identify an anomaly and build a system that will have a positive statistical advantage in our favor over the market.
The advantage will not be in one trade itself, but in the "sequence" of trades as a whole!
Because our system will work like a casino, having a positive mathematical expectation relative to the players/market.
Design, develop, test models and systems that can take advantage of market anomalies, until they change.
Be the casino! - Mark Douglas
6️⃣ : ❓ Why use a Statistical/Probabilistic system ❓
In recent years I have focused and specialized in developing 100% automated trading systems, essentially for the cryptocurrency market.
I have developed many extremely robust and efficient systems, with positive mathematical expectation towards the market.
These are not complex systems per se , because here we want to avoid 'over-optimization' as much as possible.
As Da Vinci said: "Simplicity is the highest degree of sophistication".
I say this because I have tested, tried and developed hundreds of systems/strategies.
I believe I have programmed more than 10,000 unique indicators/strategies, because this is my passion and purpose in life.
I am passionate about what I do, completely!
I love statistical trading because it is the only way to get consistency in the long run!
This is why I have studied, applied, developed, and specialized in 100% automated cryptocurrency trading systems.
The reason why our systems are extremely "simple" is because, as I mentioned before, in statistical trading we want to exploit the market anomaly to the maximum, that is, this anomaly will change from time to time, usually we can exploit a trading system efficiently for about 6 to 12 months, or for a few years, that is; for fixed 'scalpers' systems.
Because at some point these anomalies will be identified , and from the moment they are identified they will be exploited and will stop being anomalies .
With the system presented here; you can even copy the indicators and input values shared here;
However; what I have to offer you is: it is me , our team , and our community !
That is, we will constantly monitor this system, for life , because our goal here is to create a unique , perpetual , profitable , and consistent system for our community.
Myself , our team and our community will keep this script periodically updated , to ensure the positive mathematical expectation of it.
So we don't mind sharing the current parameters and values , because the real value is also in the future updates that this system will receive from me and our team , guided by our culture and our community of real users !
As we are hosted on 'tradingview', all future updates for this strategy, will be implemented and updated automatically on your tradingview account.
What we want here is: to make sure you get gains from our system, because if you get gains , our ecosystem will grow as a whole in a healthy and scalable way, so we will be generating continuous mutual wealth and raising the collective consciousness .
People Need People: 3️⃣🅿
7️⃣ : ❓ Why the human brain is not prepared to do Trading ❓
Today my greatest skill is to develop statistically profitable and 100% automated strategies for 'pinescript' tradingview.
Note that I said: 'profitable' because in fact statistical trading is the only way to make money in a 'consistent' way from the market.
And consequently have a positive wealth curve every cycle, because we will be based on mathematics, not on feelings and news.
Because the human brain is not prepared to do trading.
Because trading is connected to the decision making of the cerebral cortex.
And the decision making is automatically linked to emotions, and emotions don't match with trading decision making, because in those moments, we can feel the best and also the worst sensations and emotions, and this certainly affects us and makes us commit grotesque mistakes!
That's why the human brain is not prepared to do trading.
If you want to participate in a fully automated, profitable and consistent trading system; be a Titan Pro 👽
I believe we are walking an extremely enriching path here, not only in terms of financial returns for our community, but also in terms of knowledge about probabilistic and automated statistical trading.
You will have access to an extremely robust system, which was built upon very strong concepts and foundations, and upon the world's main asset in a few years: Bitcoin .
We are the tip of the best that exists in the cryptocurrency market when it comes to probabilistic and automated statistical trading.
Result is result! Me being dressed or naked.
This is just the beginning!
But there is a way to consistently make money from the market.
Being the Casino! - Mark Douglas
8️⃣ : ❓ What is Backtest ❓
Imagine the market as a purely random system, but even in 'randomness' there are patterns.
So now imagine the market and statistical trading as follows:
Repeating the above 'coin' example, let's think of it as follows:
If we toss a coin up 10 times again.
It is impossible to know which flips will have heads or tails, correct?
But if we analyze these 10 tosses, then we will have a mathematical statistic of the past result, for example, 70 % of the tosses fell 'heads'.
That is:
7 moves fell on "heads" .
3 moves fell on "tails" .
So based on these conditions and on the generic backtest presented here, we could adopt " heads " as our system of moves, to have a statistical and probabilistic advantage in relation to the next move to be performed.
That is, if you define a system, based on backtests , that has a robust positive mathematical expectation in relation to the market you will have a profitable system.
For every move you make you will have a positive statistical advantage in your favor over the market before you even make the move.
Like a casino in relation to all its players!
The casino does not have an advantage over one specific player, but over all players, because it has a positive mathematical expectation about all the moves that night.
The casino will always have a positive statistical advantage over its players.
Note that there will always be real players who will make real, million-dollar bankrolls that night, but this condition is already built into the casino's 'strategy', which has a pre-determined positive statistical advantage of that night as a whole.
Statistical trading is the same thing, as long as you don't understand this you will keep losing money and consistently.
9️⃣ : ❓ How to build a Consistent system ❓
See most traders around the world perform trades believing that that specific position taken will make them filthy rich, because they simply believe faithfully that the position taken will be an undoubted winner, based on a trader's methodology: 'trading a trade' without analyzing the whole context, just using 'empirical' aspects in their system.
But if you think of trading, as a sequence of moves.
You see, 'a sequence' !
When we think statistically, it doesn't matter your result for this , or for the next specific trade , but the final sequence of trades as a whole.
As the market has a random system of results distribution , if your system has a positive statistical advantage in relation to the market, at the end of that sequence you'll have the biggest probability of having a winning bank.
That's how you do real trading!
And with consistency!
Trading is a long term game, but when you change the key you realize that it is a simple game to make money in a consistent way from the market, all you need is patience.
Even more when we are based on Bitcoin, which has its 'Halving' effect where, in theory, we will never lose money in 3 to 4 years intervals, due to its scarcity and the fact that Bitcoin is the 'discovery of digital scarcity' which makes it the digital gold, we believe in this thesis and we follow Satoshi's legacy.
So align Bitcoin with a probabilistic statistical trading system with a positive mathematical expectation of the market and 100% automated with the long term, and all you need is patience, and you will become rich.
In fact Bitcoin by itself is already a path, buy, wait for each halving and your wealth will be maintained.
No inflation, unlike fiat currencies.
This is a complete and extremely robust strategy, with the most current possible and 'not possible' techniques involved and applied here.
Today I am at another level in developing 100% automated 'quantitative' strategies.
I was born for this!
🔟 : ❓ What is a Quantitative Trading system ❓
In addition to having access to a revolutionary strategy you will have access to disruptive 100% multifunctional tables with the ability to perform 'backtests' for better tracking and monitoring of your system on a customized basis.
I would like to emphasize one thing, and that is that you keep this in mind.
Today my greatest skill in 'pinescript' is to build indicators, but mainly strategies, based on statistical and probabilistic trading, with a postive mathematical expectation in relation to the market, in a 100% automated way.
This with the goal of building a consistent and continuous positive equity curve through mathematics using data, converting it into statistical / probabilistic parameters and applying them to a Quantitative model.
Before becoming a Quantitative Trader , I was a Technical Analyst and a Discretionary Trader .
First as a position trader and then as a day trader.
Before becoming a Trader, I trained myself as a Technical Analyst , to masterly understand the shape and workings of the market in theory.
But everything changed when I met 'Mark Douglas' , when I got to know his works, that's when my head exploded 🤯, and I started to understand the market for good!
The market is nothing more than a 'random' system of distributing results.
See that I said: 'random' .
Do yourself a mental exercise.
Is there really such a thing as random ?
I believe not, as far as we know maybe the 'singularity'.
So thinking this way, to translate, the market is nothing more than a game of probability, statistics and pure mathematics.
Like a casino!
What happens is that most traders, whenever they take a position, take it with all the empirical certainty that such position will win or lose, and do not take into consideration the total sequence of results to understand their place in the market.
Understanding your place in the market gives you the ability to create and design systems that can exploit the present market anomaly, and thus make money statistically, consistently, and 100% automated.
Thinking of it this way, it is easy to make money from the market.
There are many ways to make money from the market, but the only consistent way I know of is through 'probabilistic and automated statistical trading'.
1️⃣1️⃣ : ❓ How to build a Quantitative Trading system ❓
There are some fundamental points that must be addressed here in order to understand what makes up a system based on statistics and probability applied to a quantitative model.
When we talk about 'discretionary' trading, it is a trading system based on human decisions after the defined 'empirical' conditions are met.
It is quite another thing to build a fully automated system without any human interference/interaction .
That said:
Building a statistically profitable system is perfectly possible, but this is a high level task , but with possible high rewards and consistent gains.
Here you will find a real "Skin In The Game" strategy.
With all due respect, but the vast majority of traders who post strategies on TradingView do not understand what they are doing.
Most of them do not understand the minimum complexity involved in the main variable for the construction of a real strategy, the mother variable: "strategy".
I say this by my own experience, because I have analyzed practically all the existing publications of TradingView + 200,000 indicators and strategies.
I breathe pinescript, I eat pinescript, I sleep pinescript, I bathe pinescript, I live TradingView.
But the main advantage for the TradingView users, is that all entry and exit orders made by this strategy can be checked and analyzed thoroughly, to validate and prove the veracity of this strategy, because this is a 100% real strategy.
Here there is a huge world of possibilities, but only one way to build a 'pinescript strategy' that will work correctly aligned to the real world with real results .
There are some fundamental points to take into consideration when building a profitable trading system:
The most important of these for me is: 'DrawDown' .
Followed by: 'Hit Rate' .
And only after that we use the parameter: 'Profit'.
See, this is because here, we are dealing with the 'imponderable' , and anything can happen in this scenario.
But there is one thing that makes us sleep peacefully at night, and that is: controlling losses .
That is, in other words: controlling the DrawDown .
The amateur is concerned with 'winning', the professional is concerned with conserving capital.
If we have the losses under control, then we can move on to the other two parameters: hit rate and profit.
See, the second most important factor in building a system is the hit rate.
I say this from my own experience.
I have worked with many systems with a 'low hit rate', but extremely profitable.
For example: systems with hit rates of 40 to 50%.
But as much as statistically and mathematically the profit is rewarding, operating systems with a low hit rate is always very stressful psychologically.
That's why there are two big reasons why when I build an automated trading system, I focus on the high hit rate of the system, they are
1 - To reduce psychological damage as much as possible .
2 - And more important , when we create a system with a 'high hit rate' , there is a huge intrinsic advantage here, that most statistic traders don't take in consideration.
That is: knowing more quickly when the system stops being functional.
The main advantage of a system with a high hit rate is: to identify when the system stops being functional and stop exploiting the market's anomaly.
Look: When we are talking about trading and random distribution of results on the market, do you agree that when we create a trading system, we are focused on exploring some anomaly of that market?
When that anomaly is verified by the market, it will stop being functional with time.
That's why trading systems, 'scalpers', especially for cryptocurrencies, need constant monitoring, quarterly, semi-annually or annually.
Because market movements change from time to time.
Because we go through different cycles from time to time, such as congestion cycles, accumulation , distribution , volatility , uptrends and downtrends .
1️⃣2️⃣ : ❓ How to Exploit Market Anomalies ❓
You see there is a very important point that must be stressed here.
As we are always trying to exploit an 'anomaly' in the market.
So the 'number' of indicators/tools that will integrate the system is of paramount importance.
But most traders do not take this into consideration.
To build a professional, robust, consistent, and profitable system, you don't need to use hundreds of indicators to build your setup.
This will actually make it harder to read when the setup stops working and needs some adjustment.
So focusing on a high hit rate is very important here, this is a fundamental principle that is widely ignored , and with a high hit rate, we can know much more accurately when the system is no longer functional much faster.
As Darwin said: "It is not the strongest or the most intelligent that wins the game of life, it is the most adapted.
So simple systems, as contradictory as it may seem, are more efficient, because they help to identify inflection points in the market much more quickly.
1️⃣3️⃣ : ❓ What Defines a Robust, Profitable and Consistent System ❓
See I have built, hundreds of thousands of indicators and 'pinescript' strategies, hundreds of thousands.
This is an extremely professional, robust and profitable system.
Based on the currency pairs: BTC /USDT
There are many ways and avenues to build a profitable trading setup/system.
And actually this is not a difficult task, taking in consideration, as the main factor here, that our trading and investment plan is for the long term, so consequently we will face scenarios with less noise.
He who is in a hurry eats raw.
As mentioned before.
Defining trends in pinescript is technically a simple task, the hardest task is to determine congestion zones with low volume and volatility, it's in these moments that many false signals are generated, and consequently is where most setups face their maximum DrawDown.
That's why this strategy was strictly and thoroughly planned, built on a very solid foundation, to avoid as much noise as possible, for a positive and consistent equity curve in each market cycle, 'Consistency' is our 'Mantra' around here.
1️⃣4️⃣ : 🔧 Fixed Technical
• Strategy: Titan Investments|Quantitative THEMIS|Demo|BINANCE:BTCUSDTP:4h
• Pair: BTC/USDTP
• Time Frame: 4 hours
• Broker: Binance (Recommended)
For a more conservative scenario, we have built the Quantitative THEMIS for the 4h time frame, with the main focus on consistency.
So we can avoid noise as much as possible!
1️⃣5️⃣ : ❌ Fixed Outputs : 🎯 TP(%) & 🛑SL(%)
In order to build a 'perpetual' system specific to BTC/USDT, it took a lot of testing, and more testing, and a lot of investment and research.
There is one initial and fundamental point that we can address to justify the incredible consistency presented here.
That fundamental point is our exit via Take Profit or Stop Loss percentage (%).
🎯 Take Profit (%)
🛑 Stop Loss (%)
See, today I have been testing some more advanced backtesting models for some cryptocurrency systems.
In which I perform 'backtest of backtest', i.e. we use a set of strategies each focused on a principle, operating individually, but they are part of something unique, i.e. we do 'backtests' of 'backtests' together.
What I mean is that we do a lot of backtesting around here.
I can assure you, that always the best output for a trading system is to set fixed output values!
In other words:
🎯 Take Profit (%)
🛑 Stop Loss (%)
This happens because statistically setting fixed exit structures in the vast majority of times, presents a superior result on the capital/equity curve, throughout history and for the vast majority of setups compared to other exit methods.
This is due to a mathematical principle of simplicity, 'avoiding more noise'.
Thus whenever the Quantitative THEMIS strategy takes a position it has a target and a defined maximum stop percentage.
1️⃣6️⃣ : ⚠️ Risk Profile
The strategy, currently has 3 risk profiles ⚠️ patterns for 'fixed percentage exits': Take Profit (%) and Stop Loss (%) .
They are: ⚠️ Rich's Profiles
✔️🆑 Conservative: 🎯 TP=2.7 % 🛑 SL=2.7 %
❌Ⓜ️ Moderate: 🎯 TP=2.8 % 🛑 SL=2.7 %
❌🅰 Aggressive: 🎯 TP=1.6 % 🛑 SL=6.9 %
You will be able to select and switch between the above options and profiles through the 'input' menu of the strategy by navigating to the "⚠️ Risk Profile" menu.
You can then select, test and apply the Risk Profile above that best suits your risk management, expectations and reality , as well as customize all the 'fixed exit' values through the TP and SL menus below.
1️⃣7️⃣ : ⭕ Moving Exits : (Indicators)
The strategy currently also has 'Moving Exits' based on indicator signals.
These are Moving Exits (Indicators)
📈 LONG : (EXIT)
🧃 (MAO) Short : true
📉 SHORT : (EXIT)
🧃 (MAO) Long: false
You can select and toggle between the above options through the 'input' menu of the strategy by navigating to the "LONG : Exit" and "SHORT : Exit" menu.
1️⃣8️⃣ : 💸 Initial Capital
By default the "Initial Capital" set for entries and backtests of this strategy is: 10000 $
You can set another value for the 'Starting Capital' through the tradingview menu under "properties" , and edit the value of the "Initial Capital" field.
This way you can set and test other 'Entry Values' for your trades, tests and backtests.
1️⃣9️⃣ : ⚙️ Entry Options
By default the 'order size' set for this strategy is 100 % of the 'initial capital' on each new trade.
You can set and test other entry options like : contracts , cash , % of equity
You should make these changes directly in the input menu of the strategy by navigating to the menu "⚙️ Properties : TradingView" below.
⚙️ Properties : (TradingView)
📊 Strategy Type: strategy.position_size != 1
📝💲 % Order Type: % of equity
📝💲 % Order Size: 100
Leverage: 1
So you can define and test other 'Entry Options' for your trades, tests and backtests.
2️⃣0️⃣ : ❓ How to Automate this Strategy ❓ : 🤖 Automation : 'Third-Party Services'
It is possible to automate the signals of this strategy for any centralized or decentralized broker, as well as for messaging services: Discord, Telegram and Twitter.
All in an extremely simple and uncomplicated way through the tutorials available in PDF /VIDEO for our Titan Pro 👽 subscriber community.
With our tutorials in PDF and Video it will be possible to automate the signals of this strategy for the chosen service in an extremely simple way with less than 10 steps only.
Tradingview naturally doesn't count with native integration between brokers and tradingview.
But it is possible to use 'third party services' to do the integration and automation between Tradingview and your centralized or decentralized broker.
Here are the standard, available and recommended 'third party services' to automate the signals from the 'Quantitative THEMIS' strategy on the tradingview for your broker:
1) Wundertrading (Recommended):
2) 3commas:
3) Zignaly:
4) Aleeert.com (Recommended):
5) Alertatron:
Note! 'Third party services' cannot perform 'withdrawals' via their key 'API', they can only open positions, so your funds will always be 'safe' in your brokerage firm, being traded via the 'API', when they receive an entry and exit signal from this strategy.
2️⃣1️⃣ : ❓ How to Automate this Strategy ❓ : 🤖 Automation : 'Exchanges
You can automate this strategy for any of the brokers below, through your broker's 'API' by connecting it to the 'third party automation services' for tradingview available and mentioned in the menu above:
1) Binance (Recommended)
2) Bitmex
3) Bybit
4) KuCoin
5) Deribit
6) OKX
7) Coinbase
8) Huobi
9) Bitfinex
10) Bitget
11) Bittrex
12) Bitstamp
13) Gate. io
14) Kraken
15) Gemini
16) Ascendex
17) VCCE
2️⃣2️⃣ : ❓ How to Automate this Strategy ❓ : 🤖 Automation : 'Messaging Services'
You can also automate and monitor the signals of this strategy much more efficiently by sending them to the following popular messaging services:
1) Discord
2) Telegram
3) Twitter
2️⃣3️⃣ : ❓ How to Automate this Strategy ❓ : 🤖 Automation : '🧲🤖Copy-Trading'
It will also be possible to copy/replicate the entries and exits of this strategy to your broker in an extremely simple and agile way, through the available copy-trader services.
This way it will be possible to replicate the signals of this strategy at each entry and exit to your broker through the API connecting it to the integrated copy-trader services available through the tradingview automation services below:
1) Wundetrading:
2) Zignaly:
2️⃣4️⃣ : ❔ Why be a Titan Pro 👽❔
I believe that today I am at another level in 'pinescript' development.
I consider myself today a true unicorn as a pinescript developer, someone unique and very rare.
If you choose another tool or another pinescript service, this tool will be just another one, with no real results.
But if you join our Titan community, you will have access to a unique tool! And you will get real results!
I already earn money consistently with statistical and automated trading and as an expert pinescript developer.
I am here to evolve my skills as much as possible, and one day become a pinescript 'Wizard'.
So excellence, quality and professionalism will always be my north here.
You will never find a developer like me, and who will take so seriously such a revolutionary project as this one. A Maverick! ▬ The man never stops!
Here you will find the highest degree of sophistication and development in the market for 'pinescript'.
You will get the best of me and the best of pinescript possible.
Let me show you how a professional in my field does it.
Become a Titan Pro Member 👽 and get Full Access to this strategy and all the Automation Tutorials.
Be the Titan in your life!
2️⃣5️⃣ : ❔ Why be a Titan Aff 🛸❔
Get financial return for your referrals, Decentralize the World, and raise the collective consciousness.
2️⃣6️⃣ : 📋 Summary : ⚖️ Strategy: Titan Investments|Quantitative THEMIS|Demo|BINANCE:BTCUSDTP:4h
® Titan Investimentos | Quantitative THEMIS ⚖️ | Demo 🐄 2.6 | Dev: © FilipeSoh 🧙 | 🤖 100% Automated : Discord, Telegram, Twitter, Wundertrading, 3commas, Zignaly, Aleeert, Alertatron, Uniswap-v3 | BINANCE:BTCUSDTPERP 4h
🛒 Subscribe this strategy ❗️ Be a Titan Member 🏛️
🛒 Titan Pro 👽 🔗 🏛️ Titan Pro 👽 Version with ✔️100% Integrated Automation 🤖 and 📚 Automation Tutorials ✔️100% available at: (PDF/VIDEO)
🛒 Titan Affiliate 🛸 🔗 🏛️ Titan Affiliate 🛸 (Subscription Sale) 🔥 Receive 50% commission
📋 Summary : QT THEMIS ⚖️
🕵️♂️ Check This Strategy..................................................................0
🦄 ® Titan Investimentos...............................................................1
👨💻 © Developer..........................................................................2
📚 Signal Automation Tutorials : (PDF/VIDEO).......................................3
👨🔧 Revision...............................................................................4
📊 Table : (BACKTEST)..................................................................5
📊 Table : (INFORMATIONS).............................................................6
⚙️ Properties : (TRADINGVIEW)........................................................7
📆 Backtest : (TRADINGVIEW)..........................................................8
⚠️ Risk Profile...........................................................................9
🟢 On 🔴 Off : (LONG/SHORT).......................................................10
📈 LONG : (ENTRY)....................................................................11
📉 SHORT : (ENTRY)...................................................................12
📈 LONG : (EXIT).......................................................................13
📉 SHORT : (EXIT)......................................................................14
🧩 (EI) External Indicator.............................................................15
📡 (QT) Quantitative...................................................................16
🎠 (FF) Forecast......................................................................17
🅱 (BB) Bollinger Bands................................................................18
🧃 (MAP) Moving Average Primary......................................................19
🧃 (MAP) Labels.........................................................................20
🍔 (MAQ) Moving Average Quaternary.................................................21
🍟 (MACD) Moving Average Convergence Divergence...............................22
📣 (VWAP) Volume Weighted Average Price........................................23
🪀 (HL) HILO..........................................................................24
🅾 (OBV) On Balance Volume.........................................................25
🥊 (SAR) Stop and Reverse...........................................................26
🛡️ (DSR) Dynamic Support and Resistance..........................................27
🔊 (VD) Volume Directional..........................................................28
🧰 (RSI) Relative Momentum Index.................................................29
🎯 (TP) Take Profit %..................................................................30
🛑 (SL) Stop Loss %....................................................................31
🤖 Automation Selected...............................................................32
📱💻 Discord............................................................................33
📱💻 Telegram..........................................................................34
📱💻 Twitter...........................................................................35
🤖 Wundertrading......................................................................36
🤖 3commas............................................................................37
🤖 Zignaly...............................................................................38
🤖 Aleeert...............................................................................39
🤖 Alertatron...........................................................................40
🤖 Uniswap-v3..........................................................................41
🧲🤖 Copy-Trading....................................................................42
♻️ ® No Repaint........................................................................43
🔒 Copyright ©️..........................................................................44
🏛️ Be a Titan Member..................................................................45
Nº Active Users..........................................................................46
⏱ Time Left............................................................................47
| 0 | 🕵️♂️ Check This Strategy
🕵️♂️ Version Demo: 🐄 Version with ❌non-integrated automation 🤖 and 📚 Tutorials for automation ❌not available
🕵️♂️ Version Pro: 👽 Version with ✔️100% Integrated Automation 🤖 and 📚 Automation Tutorials ✔️100% available at: (PDF/VIDEO)
| 1 | 🦄 ® Titan Investimentos
Decentralizing the World 🗺
Raising the Collective Conscience 🗺
🦄Site:
🦄TradingView: www.tradingview.com
🦄Discord:
🦄Telegram:
🦄Youtube:
🦄Twitter:
🦄Instagram:
🦄TikTok:
🦄Linkedin:
🦄E-mail:
| 2 | 👨💻 © Developer
🧠 Developer: @FilipeSoh🧙
📺 TradingView: www.tradingview.com
☑️ Linkedin:
✅ Fiverr:
✅ Upwork:
🎥 YouTube:
🐤 Twitter:
🤳 Instagram:
| 3 | 📚 Signal Automation Tutorials : (PDF/VIDEO)
📚 Discord: 🔗 Link: 🔒Titan Pro👽
📚 Telegram: 🔗 Link: 🔒Titan Pro👽
📚 Twitter: 🔗 Link: 🔒Titan Pro👽
📚 Wundertrading: 🔗 Link: 🔒Titan Pro👽
📚 3comnas: 🔗 Link: 🔒Titan Pro👽
📚 Zignaly: 🔗 Link: 🔒Titan Pro👽
📚 Aleeert: 🔗 Link: 🔒Titan Pro👽
📚 Alertatron: 🔗 Link: 🔒Titan Pro👽
📚 Uniswap-v3: 🔗 Link: 🔒Titan Pro👽
📚 Copy-Trading: 🔗 Link: 🔒Titan Pro👽
| 4 | 👨🔧 Revision
👨🔧 Start Of Operations: 01 Jan 2019 21:00 -0300 💡 Start Of Operations (Skin in the game) : Revision 1.0
👨🔧 Previous Review: 01 Jan 2022 21:00 -0300 💡 Previous Review : Revision 2.0
👨🔧 Current Revision: 01 Jan 2023 21:00 -0300 💡 Current Revision : Revision 2.6
👨🔧 Next Revision: 28 May 2023 21:00 -0300 💡 Next Revision : Revision 2.7
| 5 | 📊 Table : (BACKTEST)
📊 Table: true
🖌️ Style: label.style_label_left
📐 Size: size_small
📏 Line: defval
🎨 Color: #131722
| 6 | 📊 Table : (INFORMATIONS)
📊 Table: false
🖌️ Style: label.style_label_right
📐 Size: size_small
📏 Line: defval
🎨 Color: #131722
| 7 | ⚙️ Properties : (TradingView)
📊 Strategy Type: strategy.position_size != 1
📝💲 % Order Type: % of equity
📝💲 % Order Size: 100 %
🚀 Leverage: 1
| 8 | 📆 Backtest : (TradingView)
🗓️ Mon: true
🗓️ Tue: true
🗓️ Wed: true
🗓️ Thu: true
🗓️ Fri: true
🗓️ Sat: true
🗓️ Sun: true
📆 Range: custom
📆 Start: UTC 31 Oct 2008 00:00
📆 End: UTC 31 Oct 2030 23:45
📆 Session: 0000-0000
📆 UTC: UTC
| 9 | ⚠️ Risk Profile
✔️🆑 Conservative: 🎯 TP=2.7 % 🛑 SL=2.7 %
❌Ⓜ️ Moderate: 🎯 TP=2.8 % 🛑 SL=2.7 %
❌🅰 Aggressive: 🎯 TP=1.6 % 🛑 SL=6.9 %
| 10 | 🟢 On 🔴 Off : (LONG/SHORT)
🟢📈 LONG: true
🟢📉 SHORT: true
| 11 | 📈 LONG : (ENTRY)
📡 (QT) Long: true
🧃 (MAP) Long: false
🅱 (BB) Long: false
🍟 (MACD) Long: false
🅾 (OBV) Long: false
| 12 | 📉 SHORT : (ENTRY)
📡 (QT) Short: true
🧃 (MAP) Short: false
🅱 (BB) Short: false
🍟 (MACD) Short: false
🅾 (OBV) Short: false
| 13 | 📈 LONG : (EXIT)
🧃 (MAP) Short: true
| 14 | 📉 SHORT : (EXIT)
🧃 (MAP) Long: false
| 15 | 🧩 (EI) External Indicator
🧩 (EI) Connect your external indicator/filter: false
🧩 (EI) Connect your indicator here (Study mode only): close
🧩 (EI) Connect your indicator here (Study mode only): close
| 16 | 📡 (QT) Quantitative
📡 (QT) Quantitative: true
📡 (QT) Market: BINANCE:BTCUSDTPERP
📡 (QT) Dice: openai
| 17 | 🎠 (FF) Forecast
🎠 (FF) Include current unclosed current candle: true
🎠 (FF) Forecast Type: flat
🎠 (FF) Nº of candles to use in linear regression: 3
| 18 | 🅱 (BB) Bollinger Bands
🅱 (BB) Bollinger Bands: true
🅱 (BB) Type: EMA
🅱 (BB) Period: 20
🅱 (BB) Source: close
🅱 (BB) Multiplier: 2
🅱 (BB) Linewidth: 0
🅱 (BB) Color: #131722
| 19 | 🧃 (MAP) Moving Average Primary
🧃 (MAP) Moving Average Primary: true
🧃 (MAP) BarColor: false
🧃 (MAP) Background: false
🧃 (MAP) Type: SMA
🧃 (MAP) Source: open
🧃 (MAP) Period: 100
🧃 (MAP) Multiplier: 2.0
🧃 (MAP) Linewidth: 2
🧃 (MAP) Color P: #42bda8
🧃 (MAP) Color N: #801922
| 20 | 🧃 (MAP) Labels
🧃 (MAP) Labels: true
🧃 (MAP) Style BUY ZONE: shape.labelup
🧃 (MAP) Color BUY ZONE: #42bda8
🧃 (MAP) Style SELL ZONE: shape.labeldown
🧃 (MAP) Color SELL ZONE: #801922
| 21 | 🍔 (MAQ) Moving Average Quaternary
🍔 (MAQ) Moving Average Quaternary: true
🍔 (MAQ) BarColor: false
🍔 (MAQ) Background: false
🍔 (MAQ) Type: SMA
🍔 (MAQ) Source: close
🍔 (MAQ) Primary: 14
🍔 (MAQ) Secondary: 22
🍔 (MAQ) Tertiary: 44
🍔 (MAQ) Quaternary: 16
🍔 (MAQ) Linewidth: 0
🍔 (MAQ) Color P: #42bda8
🍔 (MAQ) Color N: #801922
| 22 | 🍟 (MACD) Moving Average Convergence Divergence
🍟 (MACD) Macd Type: EMA
🍟 (MACD) Signal Type: EMA
🍟 (MACD) Source: close
🍟 (MACD) Fast: 12
🍟 (MACD) Slow: 26
🍟 (MACD) Smoothing: 9
| 23 | 📣 (VWAP) Volume Weighted Average Price
📣 (VWAP) Source: close
📣 (VWAP) Period: 340
📣 (VWAP) Momentum A: 84
📣 (VWAP) Momentum B: 150
📣 (VWAP) Average Volume: 1
📣 (VWAP) Multiplier: 1
📣 (VWAP) Diviser: 2
| 24 | 🪀 (HL) HILO
🪀 (HL) Type: SMA
🪀 (HL) Function: Maverick🧙
🪀 (HL) Source H: high
🪀 (HL) Source L: low
🪀 (HL) Period: 20
🪀 (HL) Momentum: 26
🪀 (HL) Diviser: 2
🪀 (HL) Multiplier: 1
| 25 | 🅾 (OBV) On Balance Volume
🅾 (OBV) Type: EMA
🅾 (OBV) Source: close
🅾 (OBV) Period: 16
🅾 (OBV) Diviser: 2
🅾 (OBV) Multiplier: 1
| 26 | 🥊 (SAR) Stop and Reverse
🥊 (SAR) Source: close
🥊 (SAR) High: 1.8
🥊 (SAR) Mid: 1.6
🥊 (SAR) Low: 1.6
🥊 (SAR) Diviser: 2
🥊 (SAR) Multiplier: 1
| 27 | 🛡️ (DSR) Dynamic Support and Resistance
🛡️ (DSR) Source D: close
🛡️ (DSR) Source R: high
🛡️ (DSR) Source S: low
🛡️ (DSR) Momentum R: 0
🛡️ (DSR) Momentum S: 2
🛡️ (DSR) Diviser: 2
🛡️ (DSR) Multiplier: 1
| 28 | 🔊 (VD) Volume Directional
🔊 (VD) Type: SMA
🔊 (VD) Period: 68
🔊 (VD) Momentum: 3.8
🔊 (VD) Diviser: 2
🔊 (VD) Multiplier: 1
| 29 | 🧰 (RSI) Relative Momentum Index
🧰 (RSI) Type UP: EMA
🧰 (RSI) Type DOWN: EMA
🧰 (RSI) Source: close
🧰 (RSI) Period: 29
🧰 (RSI) Smoothing: 22
🧰 (RSI) Momentum R: 64
🧰 (RSI) Momentum S: 142
🧰 (RSI) Diviser: 2
🧰 (RSI) Multiplier: 1
| 30 | 🎯 (TP) Take Profit %
🎯 (TP) Take Profit: false
🎯 (TP) %: 2.2
🎯 (TP) Color: #42bda8
🎯 (TP) Linewidth: 1
| 31 | 🛑 (SL) Stop Loss %
🛑 (SL) Stop Loss: false
🛑 (SL) %: 2.7
🛑 (SL) Color: #801922
🛑 (SL) Linewidth: 1
| 32 | 🤖 Automation : Discord | Telegram | Twitter | Wundertrading | 3commas | Zignaly | Aleeert | Alertatron | Uniswap-v3
🤖 Automation Selected : Discord
| 33 | 🤖 Discord
🔗 Link Discord:
🔗 Link 📚 Automation: 🔒Titan Pro👽
📱💻 Discord ▬ Enter Long: 🔒Titan Pro👽
📱💻 Discord ▬ Exit Long: 🔒Titan Pro👽
📱💻 Discord ▬ Enter Short: 🔒Titan Pro👽
📱💻 Discord ▬ Exit Short: 🔒Titan Pro👽
| 34 | 🤖 Telegram
🔗 Link Telegram:
🔗 Link 📚 Automation: 🔒Titan Pro👽
📱💻 Telegram ▬ Enter Long: 🔒Titan Pro👽
📱💻 Telegram ▬ Exit Long: 🔒Titan Pro👽
📱💻 Telegram ▬ Enter Short: 🔒Titan Pro👽
📱💻 Telegram ▬ Exit Short: 🔒Titan Pro👽
| 35 | 🤖 Twitter
🔗 Link Twitter:
🔗 Link 📚 Automation: 🔒Titan Pro👽
📱💻 Twitter ▬ Enter Long: 🔒Titan Pro👽
📱💻 Twitter ▬ Exit Long: 🔒Titan Pro👽
📱💻 Twitter ▬ Enter Short: 🔒Titan Pro👽
📱💻 Twitter ▬ Exit Short: 🔒Titan Pro👽
| 36 | 🤖 Wundertrading : Binance | Bitmex | Bybit | KuCoin | Deribit | OKX | Coinbase | Huobi | Bitfinex | Bitget
🔗 Link Wundertrading:
🔗 Link 📚 Automation: 🔒Titan Pro👽
📱💻 Wundertrading ▬ Enter Long: 🔒Titan Pro👽
📱💻 Wundertrading ▬ Exit Long: 🔒Titan Pro👽
📱💻 Wundertrading ▬ Enter Short: 🔒Titan Pro👽
📱💻 Wundertrading ▬ Exit Short: 🔒Titan Pro👽
| 37 | 🤖 3commas : Binance | Bybit | OKX | Bitfinex | Coinbase | Deribit | Bitmex | Bittrex | Bitstamp | Gate.io | Kraken | Gemini | Huobi | KuCoin
🔗 Link 3commas:
🔗 Link 📚 Automation: 🔒Titan Pro👽
📱💻 3commas ▬ Enter Long: 🔒Titan Pro👽
📱💻 3commas ▬ Exit Long: 🔒Titan Pro👽
📱💻 3commas ▬ Enter Short: 🔒Titan Pro👽
📱💻 3commas ▬ Exit Short: 🔒Titan Pro👽
| 38 | 🤖 Zignaly : Binance | Ascendex | Bitmex | Kucoin | VCCE
🔗 Link Zignaly:
🔗 Link 📚 Automation: 🔒Titan Pro👽
🤖 Type Automation: Profit Sharing
🤖 Type Provider: Webook
🔑 Key: 🔒Titan Pro👽
🤖 pair: BTCUSDTP
🤖 exchange: binance
🤖 exchangeAccountType: futures
🤖 orderType: market
🚀 leverage: 1x
% positionSizePercentage: 100 %
💸 positionSizeQuote: 10000 $
🆔 signalId: @Signal1234
| 39 | 🤖 Aleeert : Binance
🔗 Link Aleeert:
🔗 Link 📚 Automation: 🔒Titan Pro👽
📱💻 Aleeert ▬ Enter Long: 🔒Titan Pro👽
📱💻 Aleeert ▬ Exit Long: 🔒Titan Pro👽
📱💻 Aleeert ▬ Enter Short: 🔒Titan Pro👽
📱💻 Aleeert ▬ Exit Short: 🔒Titan Pro👽
| 40 | 🤖 Alertatron : Binance | Bybit | Deribit | Bitmex
🔗 Link Alertatron:
🔗 Link 📚 Automation: 🔒Titan Pro👽
📱💻 Alertatron ▬ Enter Long: 🔒Titan Pro👽
📱💻 Alertatron ▬ Exit Long: 🔒Titan Pro👽
📱💻 Alertatron ▬ Enter Short: 🔒Titan Pro👽
📱💻 Alertatron ▬ Exit Short: 🔒Titan Pro👽
| 41 | 🤖 Uniswap-v3
🔗 Link Alertatron:
🔗 Link 📚 Automation: 🔒Titan Pro👽
📱💻 Uniswap-v3 ▬ Enter Long: 🔒Titan Pro👽
📱💻 Uniswap-v3 ▬ Exit Long: 🔒Titan Pro👽
📱💻 Uniswap-v3 ▬ Enter Short: 🔒Titan Pro👽
📱💻 Uniswap-v3 ▬ Exit Short: 🔒Titan Pro👽
| 42 | 🧲🤖 Copy-Trading : Zignaly | Wundertrading
🔗 Link 📚 Copy-Trading: 🔒Titan Pro👽
🧲🤖 Copy-Trading ▬ Zignaly: 🔒Titan Pro👽
🧲🤖 Copy-Trading ▬ Wundertrading: 🔒Titan Pro👽
| 43 | ♻️ ® Don't Repaint!
♻️ This Strategy does not Repaint!: ® Signs Do not repaint❕
♻️ This is a Real Strategy!: Quality : ® Titan Investimentos
📋️️ Get more information about Repainting here:
| 44 | 🔒 Copyright ©️
🔒 Copyright ©️: Copyright © 2023-2024 All rights reserved, ® Titan Investimentos
🔒 Copyright ©️: ® Titan Investimentos
🔒 Copyright ©️: Unique and Exclusive Strategy. All rights reserved
| 45 | 🏛️ Be a Titan Members
🏛️ Titan Pro 👽 Version with ✔️100% Integrated Automation 🤖 and 📚 Automation Tutorials ✔️100% available at: (PDF/VIDEO)
🏛️ Titan Affiliate 🛸 (Subscription Sale) 🔥 Receive 50% commission
| 46 | ⏱ Time Left
Time Left Titan Demo 🐄: ⏱♾ | ⏱ : ♾ Titan Demo 🐄 Version with ❌non-integrated automation 🤖 and 📚 Tutorials for automation ❌not available
Time Left Titan Pro 👽: 🔒Titan Pro👽 | ⏱ : Pro Plans: 30 Days, 90 Days, 12 Months, 24 Months. (👽 Pro 🅼 Monthly, 👽 Pro 🆀 Quarterly, 👽 Pro🅰 Annual, 👽 Pro👾Two Years)
| 47 | Nº Active Users
Nº Active Subscribers Titan Pro 👽: 5️⃣6️⃣ | 1✔️ 5✔️ 10✔️ 100❌ 1K❌ 10K❌ 50K❌ 100K❌ 1M❌ 10M❌ 100M❌ : ⏱ Active Users is updated every 24 hours (Check on indicator)
Nº Active Affiliates Titan Aff 🛸: 6️⃣ | 1✔️ 5✔️ 10❌ 100❌ 1K❌ 10K❌ 50K❌ 100K❌ 1M❌ 10M❌ 100M❌ : ⏱ Active Users is updated every 24 hours (Check on indicator)
2️⃣7️⃣ : 📊 PERFORMANCE : 🆑 Conservative
📊 Exchange: Binance
📊 Pair: BINANCE: BTCUSDTPERP
📊 TimeFrame: 4h
📊 Initial Capital: 10000 $
📊 Order Type: % equity
📊 Size Per Order: 100 %
📊 Commission: 0.03 %
📊 Pyramid: 1
• ⚠️ Risk Profile: 🆑 Conservative: 🎯 TP=2.7 % | 🛑 SL=2.7 %
• 📆All years: 🆑 Conservative: 🚀 Leverage 1️⃣x
📆 Start: September 23, 2019
📆 End: January 11, 2023
📅 Days: 1221
📅 Bars: 7325
Net Profit:
🟢 + 1669.89 %
💲 + 166989.43 USD
Total Close Trades:
⚪️ 369
Percent Profitable:
🟡 64.77 %
Profit Factor:
🟢 2.314
DrawDrown Maximum:
🔴 -24.82 %
💲 -10221.43 USD
Avg Trade:
💲 + 452.55 USD
✔️ Trades Winning: 239
❌ Trades Losing: 130
✔️ Average Gross Win: + 12.31 %
❌ Average Gross Loss: - 9.78 %
✔️ Maximum Consecutive Wins: 9
❌ Maximum Consecutive Losses: 6
% Average Gain Annual: 499.33 %
% Average Gain Monthly: 41.61 %
% Average Gain Weekly: 9.6 %
% Average Gain Day: 1.37 %
💲 Average Gain Annual: 49933 $
💲 Average Gain Monthly: 4161 $
💲 Average Gain Weekly: 960 $
💲 Average Gain Day: 137 $
• 📆 Year: 2020: 🆑 Conservative: 🚀 Leverage 1️⃣x
• 📆 Year: 2021: 🆑 Conservative: 🚀 Leverage 1️⃣x
• 📆 Year: 2022: 🆑 Conservative: 🚀 Leverage 1️⃣x
2️⃣8️⃣ : 📊 PERFORMANCE : Ⓜ️ Moderate
📊 Exchange: Binance
📊 Pair: BINANCE: BTCUSDTPERP
📊 TimeFrame: 4h
📊 Initial Capital: 10000 $
📊 Order Type: % equity
📊 Size Per Order: 100 %
📊 Commission: 0.03 %
📊 Pyramid: 1
• ⚠️ Risk Profile: Ⓜ️ Moderate: 🎯 TP=2.8 % | 🛑 SL=2.7 %
• 📆 All years: Ⓜ️ Moderate: 🚀 Leverage 1️⃣x
📆 Start: September 23, 2019
📆 End: January 11, 2023
📅 Days: 1221
📅 Bars: 7325
Net Profit:
🟢 + 1472.04 %
💲 + 147199.89 USD
Total Close Trades:
⚪️ 362
Percent Profitable:
🟡 63.26 %
Profit Factor:
🟢 2.192
DrawDrown Maximum:
🔴 -22.69 %
💲 -9269.33 USD
Avg Trade:
💲 + 406.63 USD
✔️ Trades Winning: 229
❌ Trades Losing : 133
✔️ Average Gross Win: + 11.82 %
❌ Average Gross Loss: - 9.29 %
✔️ Maximum Consecutive Wins: 9
❌ Maximum Consecutive Losses: 8
% Average Gain Annual: 440.15 %
% Average Gain Monthly: 36.68 %
% Average Gain Weekly: 8.46 %
% Average Gain Day: 1.21 %
💲 Average Gain Annual: 44015 $
💲 Average Gain Monthly: 3668 $
💲 Average Gain Weekly: 846 $
💲 Average Gain Day: 121 $
• 📆 Year: 2020: Ⓜ️ Moderate: 🚀 Leverage 1️⃣x
• 📆 Year: 2021: Ⓜ️ Moderate: 🚀 Leverage 1️⃣x
• 📆 Year: 2022: Ⓜ️ Moderate: 🚀 Leverage 1️⃣x
2️⃣9️⃣ : 📊 PERFORMANCE : 🅰 Aggressive
📊 Exchange: Binance
📊 Pair: BINANCE: BTCUSDTPERP
📊 TimeFrame: 4h
📊 Initial Capital: 10000 $
📊 Order Type: % equity
📊 Size Per Order: 100 %
📊 Commission: 0.03 %
📊 Pyramid: 1
• ⚠️ Risk Profile: 🅰 Aggressive: 🎯 TP=1.6 % | 🛑 SL=6.9 %
• 📆 All years: 🅰 Aggressive: 🚀 Leverage 1️⃣x
📆 Start: September 23, 2019
📆 End: January 11, 2023
📅 Days: 1221
📅 Bars: 7325
Net Profit:
🟢 + 989.38 %
💲 + 98938.38 USD
Total Close Trades:
⚪️ 380
Percent Profitable:
🟢 84.47 %
Profit Factor:
🟢 2.156
DrawDrown Maximum:
🔴 -17.88 %
💲 -9182.84 USD
Avg Trade:
💲 + 260.36 USD
✔️ Trades Winning: 321
❌ Trades Losing: 59
✔️ Average Gross Win: + 5.75 %
❌ Average Gross Loss: - 14.51 %
✔️ Maximum Consecutive Wins: 21
❌ Maximum Consecutive Losses: 6
% Average Gain Annual: 295.84 %
% Average Gain Monthly: 24.65 %
% Average Gain Weekly: 5.69 %
% Average Gain Day: 0.81 %
💲 Average Gain Annual: 29584 $
💲 Average Gain Monthly: 2465 $
💲 Average Gain Weekly: 569 $
💲 Average Gain Day: 81 $
• 📆 Year: 2020: 🅰 Aggressive: 🚀 Leverage 1️⃣x
• 📆 Year: 2021: 🅰 Aggressive: 🚀 Leverage 1️⃣x
• 📆 Year: 2022: 🅰 Aggressive: 🚀 Leverage 1️⃣x
3️⃣0️⃣ : 🛠️ Roadmap
🛠️• 14/ 01 /2023 : Titan THEMIS Launch
🛠️• Updates January/2023 :
• 📚 Tutorials for Automation 🤖 already Available : ✔️
• ✔️ Discord
• ✔️ Wundertrading
• ✔️ Zignaly
• 📚 Tutorials for Automation 🤖 In Preparation : ⭕
• ⭕ Telegram
• ⭕ Twitter
• ⭕ 3comnas
• ⭕ Aleeert
• ⭕ Alertatron
• ⭕ Uniswap-v3
• ⭕ Copy-Trading
🛠️• Updates February/2023 :
• 📰 Launch of advertising material for Titan Affiliates 🛸
• 🛍️🎥🖼️📊 (Sales Page/VSL/Videos/Creative/Infographics)
🛠️• 28/05/2023 : Titan THEMIS update ▬ Version 2.7
🛠️• 28/05/2023 : BOT BOB release ▬ Version 1.0
• (Native Titan THEMIS Automation - Through BOT BOB, a bot for automation of signals, indicators and strategies of TradingView, of own code ▬ in validation.
• BOT BOB
Automation/Connection :
• API - For Centralized Brokers.
• Smart Contracts - Wallet Web - For Decentralized Brokers.
• This way users can automate any indicator or strategy of TradingView and Titan in a decentralized, secure and simplified way.
• Without having the need to use 'third party services' for automating TradingView indicators and strategies like the ones available above.
🛠️• 28/05/2023 : Release ▬ Titan Culture Guide 📝
3️⃣1️⃣ : 🧻 Notes ❕
🧻 • Note ❕ The "Demo 🐄" version, ❌does not have 'integrated automation', to automate the signals of this strategy and enjoy a fully automated system, you need to have access to the Pro version with '100% integrated automation' and all the tutorials for automation available. Become a Titan Pro 👽
🧻 • Note ❕ You will also need to be a "Pro User or higher on Tradingview", to be able to use the webhook feature available only for 'paid' profiles on the platform.
With the webhook feature it is possible to send the signals of this strategy to almost anywhere, in our case to centralized or decentralized brokerages, also to popular messaging services such as: Discord, Telegram or Twiter.
3️⃣2️⃣ : 🚨 Disclaimer ❕❗
🚨 • Disclaimer ❕❕ Past positive result and performance of a system does not guarantee its positive result and performance for the future!
🚨 • Disclaimer ❗❗❗ When using this strategy: Titan Investments is totally Exempt from any claim of liability for losses. The responsibility on the management of your funds is solely yours. This is a very high risk/volatility market! Understand your place in the market.
3️⃣3️⃣ : ♻️ ® No Repaint
This Strategy does not Repaint! This is a real strategy!
3️⃣4️⃣ : 🔒 Copyright ©️
Copyright © 2022-2023 All rights reserved, ® Titan Investimentos
3️⃣5️⃣ : 👏 Acknowledgments
I want to start this message in thanks to TradingView and all the Pinescript community for all the 'magic' created here, a unique ecosystem! rich and healthy, a fertile soil, a 'new world' of possibilities, for a complete deepening and improvement of our best personal skills.
I leave here my immense thanks to the whole community: Tradingview, Pinecoders, Wizards and Moderators.
I was not born Rich .
Thanks to TradingView and pinescript and all its transformation.
I could develop myself and the best of me and the best of my skills.
And consequently build wealth and patrimony.
Gratitude.
One more story for the infinite book !
If you were born poor you were born to be rich !
Raising🔼 the level and raising🔼 the ruler! 📏
My work is my 'debauchery'! Do better! 💐🌹
Soul of a first-timer! Creativity Exudes! 🦄
This is the manifestation of God's magic in me. This is the best of me. 🧙
You will copy me, I know. So you owe me. 💋
My mission here is to raise the consciousness and self-esteem of all Titans and Titanids! Welcome! 🧘 🏛️
The only way to accomplish great work is to do what you love ! Before I learned to program I was wasting my life!
Death is the best creation of life .
Now you are the new , but in the not so distant future you will gradually become the old . Here I stay forever!
Playing the game like an Athlete! 🖼️ Enjoy and Enjoy 🍷 🗿
In honor of: BOB ☆
1 name, 3 letters, 3 possibilities, and if read backwards it's the same thing, a palindrome. ☘
Gratitude to the oracles that have enabled me the 'luck' to get this far: Dal&Ni&Fer
3️⃣6️⃣ : 👮 House Rules : 📺 TradingView
House Rules : This publication and strategy follows all TradingView house guidelines and rules:
📺 TradingView House Rules: www.tradingview.com
📺 Script publication rules: www.tradingview.com
📺 Vendor requirements: www.tradingview.com
📺 Links/References rules: www.tradingview.com
3️⃣7️⃣ : 🏛️ Become a Titan Pro member 👽
🟩 Titan Pro 👽 🟩
3️⃣8️⃣ : 🏛️ Be a member Titan Aff 🛸
🟥 Titan Affiliate 🛸 🟥
