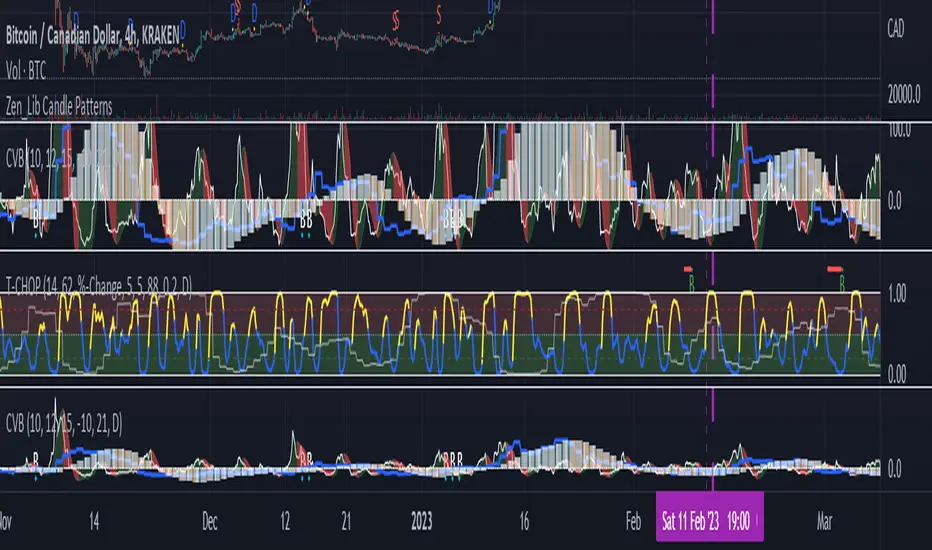
JZ_Chaikin HTF Volatility BreakoutFirst off, all credit to Harry Potter as this is a minor customization of his indicator.
Basic additions:
-- Added a Higher Timeframe that is set to Daily but can be changed. Timeframe does wait until barstate.isconfirmed so won't repaint.
-- Added HMA smoothing line to both Chart and HTF. Can be used as it's own signal, as confirmation or in combination with faster signal line -- Breakout signal & Range Highlight use both.
-- Added optional coloring of HMA based on whether increasing or decreasing.
-- Added a low volatility option that highlights Range/No Trade zones. Defval is off so needs to be selected from inputs.
Breakout Signals are very simple and both take the HTF signal and HMA. When the faster Volatility line rises from below zero and comes within the range of -10 to 0, AND the HMA signals is increasing (and also below zero) for confirmation, generates a breakout signal of an incoming big move. You can alter the breakout threshold to be greater or less than -10, I just found that works best for filtering out the noise and false signals. Won't catch everything, but pretty reliable when it does.
Tested mostly on BTC so can't vouch for other assets and would likely need modification.
I've JUST taught myself coding from scratch (and to say I'm an amateur is an understatement), so apologies in advance if anything is unclear or could be coded better. Open to any suggestions.
Chaikin Volatility
Volatility BandsWe used Marc Chaikin’s Chaikin Volatility as somewhat of a baseline for this indicator and then built on it. Like Chaikin Volatility, our indicator draws primarily upon high-low spreads to quantify a security’s volatility. It also has similarities to Keltner Channels as it uses ATR rather than standard deviations in its calculation of the different bands.
Inputs:
int ‘len0’, lookback window for fast EMA of high-low ranges.
int ‘len1’, lookback window for slow EMA of high-low ranges.
int ‘len2’, lookback window for slow EMA of closing prices.
float ‘m0’, ATR multiplier for first upper and lower volatility bands.
float ‘m1’, ATR multiplier for second upper and lower volatility bands.
float ‘m2’, ATR multiplier for third upper and lower volatility bands.
int ‘lenATR’, window length for ATR calculation.
Output: 3 Upper and Lower Volatility Bands (6 total).
1. Compute High Low Spread for current period.
hlr = (high – low)
2. Calculate Exponential Moving Average of HLR at length len0
fastEMA = ema(hlr, len0)
3. Calculate Exponential Moving average of HLR at length len1 (where len1 > len0)
slowEMA = ema(hlr, len1)
4. Get EMA of closing prices at length len2(where len2 > len1 and len1 > len0)
priceEMA = ema(close, len2)
5. Use adjusted Chaikin Volatility Formula to quantify volatility
v = (fastEMA – slowEMA) / slowEMA
6. Calculate three upper and three lower volatility bands (6 total):
ex:
upper0 = priceEMA + ((1 – cv) * (atrMult0 * atr(lenATR)))
lower0 = priceEMA – ((1 – cv) * (atrMult0 * atr(lenATR)))
One possible way to use this indicator is to enter a long position when the security’s price falls below the lowest volatility band and then exit when it crosses above the third upper band. This seems to get the best results for quick, high frequency trading. Another approach is to enter a position when the bands begin to break out from a compact state and the width between them increases.
Still tweaking the idea, so any feedback would be appreciated.

Chaikin Volatility Strategy With Negative Trigger AllowedSame like Chaikin Volatility Strategy, but allows negative value of Trigger

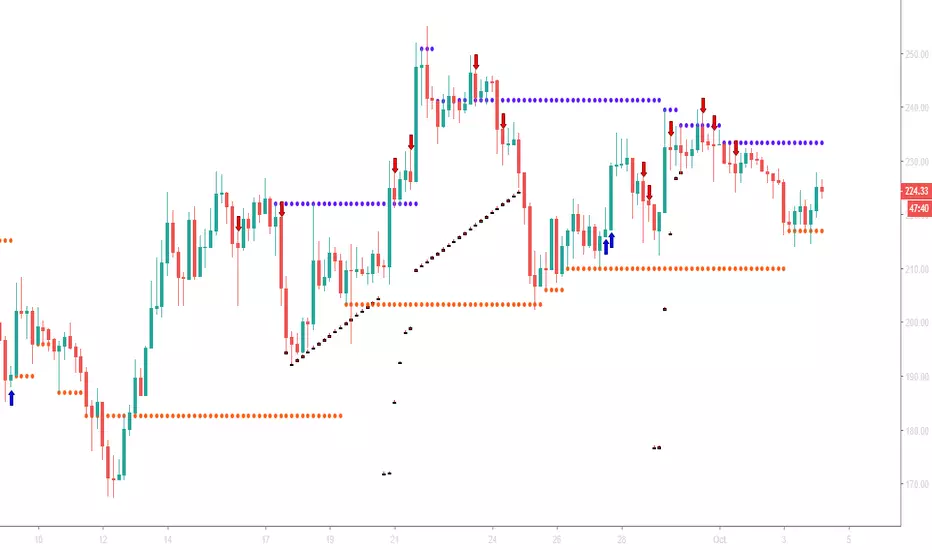
TradeMiner S9This is the first TradingView indicator EVER to include dynamic support and resistance lines from upper or lower diagonal highs and lows in real-time.
Note: This indicator has been built using Pinescript V2
Like and Share for access and more awesome indicators!
A blue arrow appears only in a red bar and under these conditions:
Closing Score Trigger (CS < 50)
On Balance Volume, Accumulation/Distribution, and Chaikin Money Flow Combination (OBV/AD /CMF > 0)
Chaikin Money Flow (CMF <-0.05)
A blue horizontal line will be drawn when CMF > 0.05 indicates a sale of the position.
A red arrow appears only in a green bar and under these conditions:
Closing Score Trigger (CS > 50)
On Balance Volume, Accumulation/Distribution, and Chaikin Money Flow Combination (OBV/AD/CMF < 0)
Chaikin Money Flow (CMF > 0.05)
A red horizontal line will be drawn when CMF <-0.05 indicates a sale of the position.
A new condition called " leaniency " has been added that allows all these conditions to be fulfilled within multiple bars so that the occurrence occurs more frequently. This will result in more signals appearing. Setting leniency to " 1 " means that all four conditions must occur in a single bar, while " 5 " means that all four conditions must occur within 5 bars.
Find lifetime access to the indicator here: www.kenzing.com
BTC
OPBNothing here for you to see. Hey! What was that over there? Was that a bird or something? Nope.. still nothing to see here.

Chaikin Volatility Strategy Backtest Chaikin's Volatility indicator compares the spread between a security's
high and low prices. It quantifies volatility as a widening of the range
between the high and the low price.
You can use in the xPrice1 and xPrice2 any series: Open, High, Low, Close, HL2,
HLC3, OHLC4 and ect...
You can change long to short in the Input Settings
Please, use it only for learning or paper trading. Do not for real trading.

Chaikin Volatility StrategyChaikin's Volatility indicator compares the spread between a security's
high and low prices. It quantifies volatility as a widening of the range
between the high and the low price.
You can use in the xPrice1 and xPrice2 any series: Open, High, Low, Close, HL2,
HLC3, OHLC4 and ect...

Chaikin Volatility Chaikin's Volatility indicator compares the spread between a security's
high and low prices. It quantifies volatility as a widening of the range
between the high and the low price.
You can use in the xPrice1 and xPrice2 any series: Open, High, Low, Close, HL2,
HLC3, OHLC4 and ect...
