ColorExtensionLibrary "ColorExtension"
Color Extension methods.
hsl(hue, saturation, lightness, transparency) HSL color transform.
Parameters:
hue : float, hue color component, hue is a degree on the color wheel from 0 to 360. 0 is red, 120 is green, 240 is blue.
saturation : float, saturation color component, saturation is a percentage value, 0 means a shade of gray and 100 is the full color.
lightness : float, lightness color component, Lightness is also a percentage; 0 is black, 100 is white.
transparency : float, transparency color component, transparency is also a percentage; 0 is opaque, 100 is transparent.
Returns: color
rgb_to_hsl(red, green, blue) Convert RGB to HSL color values
Parameters:
red : float, red color component.
green : float, green color component.
blue : float, blue color component.
Returns: tuple with 3 float values, hue, saturation and lightness.
complement(primary) Complementary of selected color
Parameters:
primary : color, the primary
Returns: color.
invert(primary) Inverts selected color.
Parameters:
primary : color, the primary.
Returns: color.
is_cool(base) Color is cool or warm.
Parameters:
base : color, the color to check.
Returns: bool.
temperature(base) Color temperature.
Parameters:
base : color, the color to check.
Returns: bool.
is_high_key(base) Color is high key (orange yellow green).
Parameters:
base : color, the color to check.
Returns: bool.
mix(base, mix, rate) Mix two colors together.
Parameters:
base : color, the base color.
mix : color, the color to mix.
rate : float, default=0.5, the rate of mixture, range within 0.0 and 1.0.
Returns: color.
analog(primary) Selects 2 near spectrum colors (H +/- 45).
Parameters:
primary : color, the base color.
Returns: tuple with 2 colors.
triadic(primary) Selects 2 far spectrum colors (H +/- 120).
Parameters:
primary : color, the base color.
Returns: tuple with 2 colors.
tetradic(primary) Uses primary and the complementary color, + 60º to form a rectangular pattern on the color wheel.
Parameters:
primary : color, the base color.
Returns: tuple with 3 colors.
square(primary) Uses primary and generate 3 equally spaced (90º) colors.
Parameters:
primary : color, the base color.
Returns: tuple with 3 colors.
Colors

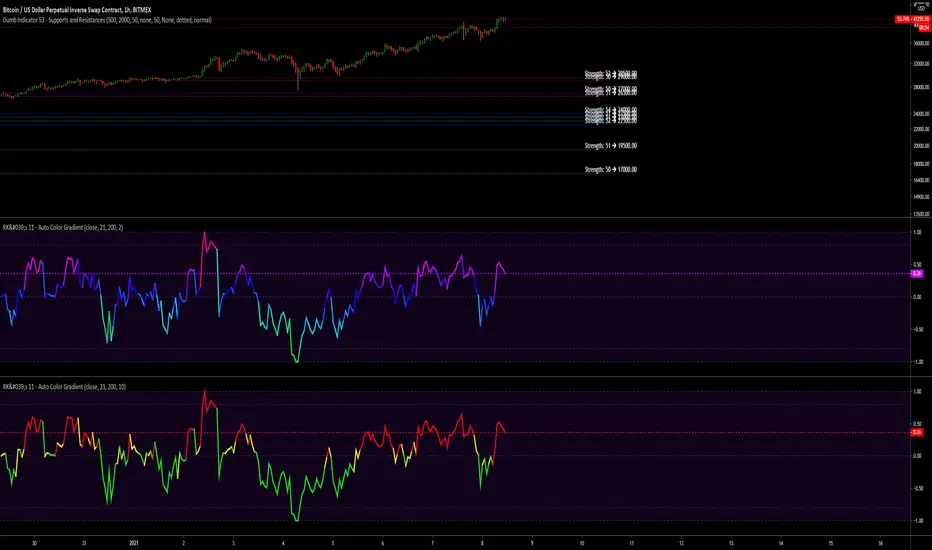
RK's Framework 01 - Auto Color GradientThis started as a personal arrays study, but after a few tests I decided to made a framework to get my own scripts simplest, lighter and faster.
And now I'm sharing with you guys.
Is very simple to use:
Copy evething inside "RK's Auto Color Gradient Framework" block;
Paste anywhere before the plotting;
Declare the color variable name calling the function "f_autocolor(___, ___)" with the source you gonna plot and the size of the scale do you want to use to compare the data.
Feel free to use.
Hope brings some profits for you guys!!
FishNet Doubled hullMA Reactive ColorsMoving averages are used to determine trend. These moving averages are designed to determine trend with reactive coloring and utilizes a unique version of the Hull moving average. This is one of many iterations of fishnet MAs I have made in the past.
I first found fishnet MAs, which is a lot of moving averages of increasing length, from @TusenPix
YMMV on actionable information :p

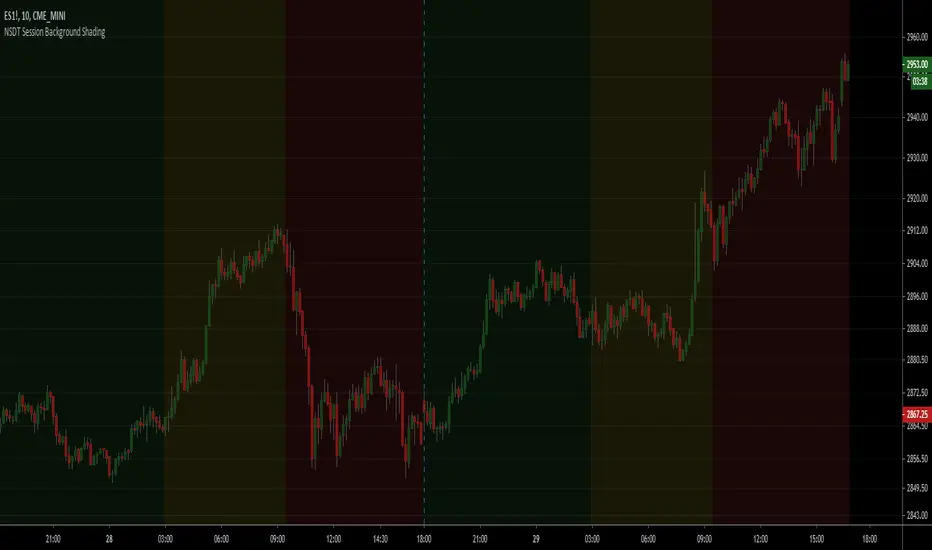
NSDT Session Background ShadingA simple script to add background colors to specific timeframes. Great for trading futures so you can separate sessions for easier viewing. Use for stocks to separate pre, open, and post market times.
There are three timeframes that can be set and all colors can be modified.
Kaz Style BarsChange bar colors based on above or Below EMA
I use it to match Kaz's bars look on my charts

2 Moving Average Color Direction Detection 2 Moving Average Color Direction Detection, possibility to configure:
- Type: SMA , EMA , WMA , VWMA , SMMA , DEMA , TEMA , HULLMA, ZEMA, TMA, SSMA
- Lenght
- Source
- Color direction

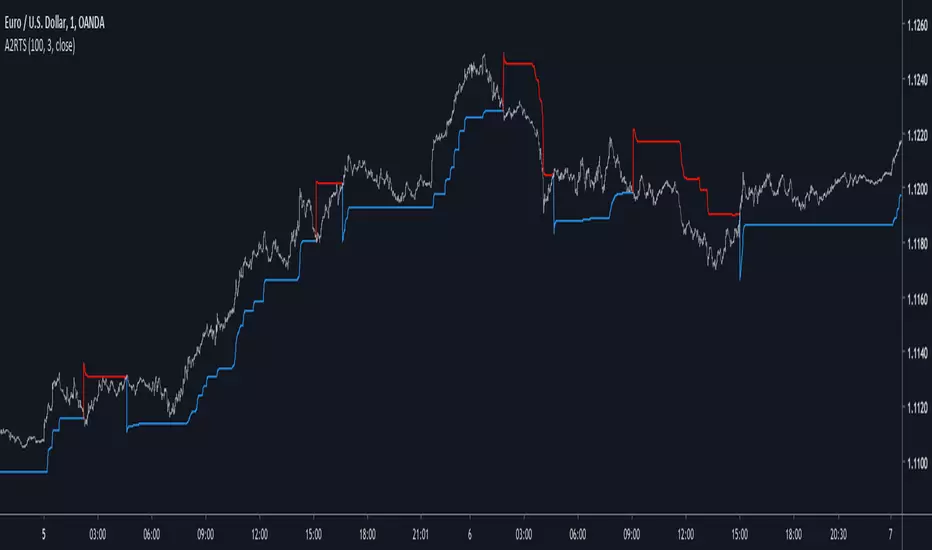
Adaptive Autonomous Recursive Trailing StopIntroduction
Trailing stop are important indicators in technical analysis, today i propose a new trailing stop A2RTS based on my last published indicator A2RMA (1), this last indicator directly used an error measurement thus providing a way to create enveloppes, which provide a direct way to create trailing stops based on highest/lowest rules.
The Indicator
If you need a more detailed explanation of this indicator i encourage you to check the A2RMA indicator post i made, parameters does not differ from the supertrend, thus having a length parameter and a factor parameter who is here described as gamma , gamma control how far away are the bands from each others thus spotting longer terms trends when gamma is higher.
On BTCUSD
Something worth mentioning is that the indicator sometimes behave like my MTA trailing stop indicator (2) who is closer to the price when a trend persist thus providing early exit points, however A2RTS behave a bit better.
Price can sometimes break the trailing stop, this can be interpreted as a support/resistance or just as an exit point, the support resistance methodology on trailing stop is not the most recommended.
Sometimes it is recommended to have an higher length rather than an high gamma like in this case for INTEL CORP, below gamma = 3 and length = 20
The microprocessor market like to use higher length's instead of higher gamma's , A2RMA is a non-linear filter, this would explain such behaviour.
Conclusion
Trailing stops might not suffer as much from whipsaw trades than MA crossovers but they still remain inefficient when market is not trending, results of the proposed indicator on major forex pairs are more than disappointing, but i hope this will serve as basis for other trailing stops that might act a little bit better. I conclude this post by thanking everyone who support my work and i encourage you to modify this indicator and share it with the community.
Thanks for reading !
Cited Articles
High Performance Candlestick Patterns Colors//Candle Patterns Ranked by Performance THOMAS N. BULKOWSKI
//1. Bearish Three Line Strike +Up 67.38%
//2. Bullish Three Line Strike -Down 65.23%
//3. Bearish Three Black Crows -Down 59.83%
//4. Bearish Evening Star -Down 55.85%
//5. Bullish Upside Tasuki Gap +Up 54.44%
//6. Bullish Inverted Hammer -Down 51.73%
//7. Bullish Matching Low -Down 50.00%
//8. Bullish Abandone Baby +Up 49.73%
//9. Bearish Two Black Gapping -Down 49.64%
//10. Brearish Breakaway -Down 49.24%
//11. Bullish Morning Star +Up 49.05%
//12. Bullish Piercing Line +Up 48.37%
//13. Bullish Stick Sandwich +Up 48.20%
//14. Bearish Thrusting Line During Dowtrend +Up 48.10%
//15. Bearish Meeting Line +Up 48.07%
//Down=Yellow Bar Color and Black Text
//Up=Blue Bar Color and Blue Text
//High Performance Candlestick Patterns Colors Top 15


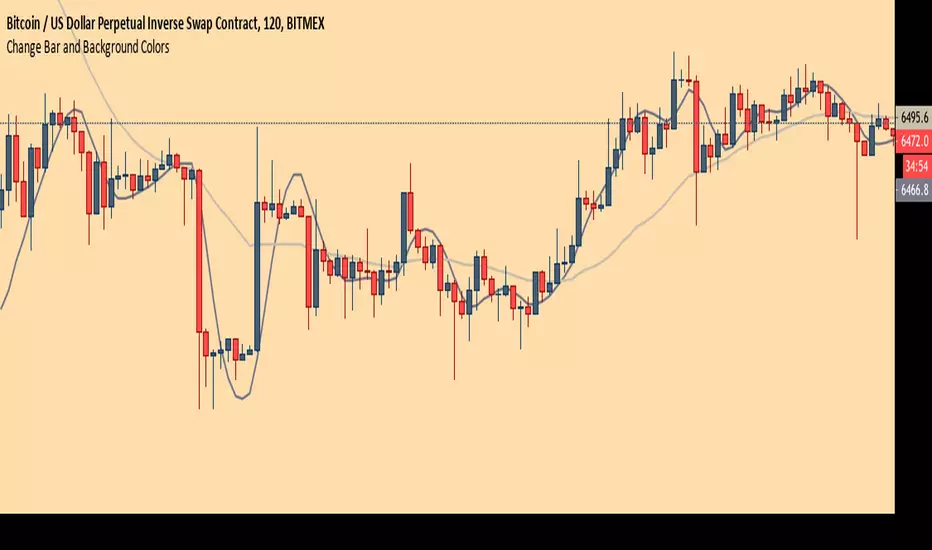
Chart Theme - Change Bar and Background Colors using HEX #sAdds aesthetic ability to charts by allowing the trader to change the color of the bars, background, and plots using HEX colors, rather than TradingView's limited color selector box. This makes for easy application of color palettes to charts. The color palettes can be saved as indicators and applied quickly, as desired.
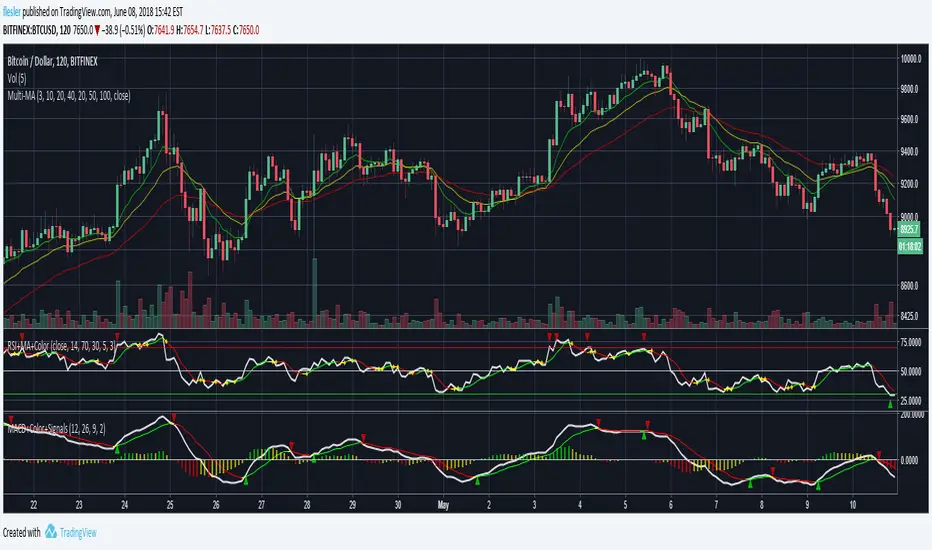
MACD + Colors + Signals
Standard MACD with signal and histogram
MACD and signal crossovers are marked with up/down triangles
Signal is colored based on its direction, can be turned to a single color
Histograms can be green, red and yellow based on their side and direction
Histograms can be switch to be green when positive and red when negative
Volume Strength Candles / Colored BarsIs Price Action Higher or Lower on STRONG or WEAK VOLUME from lookback
(Strong or Weak Bulls // Strong or Weak Bears)
Candles / Bars Indicate the Following (default 13 period lookback / Length)
MAROON Bear Candle with STRONG VOLUME more than 150% of the lookback / length (13 default), STRONG Bear Candle Confirmed With Volume
RED Bear Candle while VOLUME is BETWEEN 50% & 150% of the Lookback / Length (13 default), Neutral Bear Volume Neither strong or weak
ORANGE Bear Candle with WEAK VOLUME (Less than 50% of the Length / Lookback)
DARK GREEN Bull Candle with STRONG VOLUME MORE than 150% of lookback
GREEN Bull Candle with Neutral VOLUME BETWEEN 50% & 150% of the lookback / Length
AQUA Bull Candle with WEAK VOLUME less than 50% of the Lookback
Is price confirmed by volume?
Can Change the Lookback / Length from 13
Can Change the Colors and Transparency to easily see based off your chart background colors I recommend ZERO Transparency to easily identify volume strength (i use white background but many use black or other)

clouded pastSearch indicators for "clouded" to find this one, and add to your chart.
Takes lowest(min) and highest(max) of several bars,
averages that over several bars,
shifts by half of the middle of those two bar numbers,
and colors the inbetween by candle color.
You can choose 3 parameters.
Please give feedback, or donation.
Thanks.

Directional Movement Index 4 colors (DMI 4c)It is a normal Directional Movement Index, but instead of using lines for +DI and -DI it uses histogram and 4 colors. It also contains an horizontal line (default value @20) to indicate when a trend is confirmed or not.

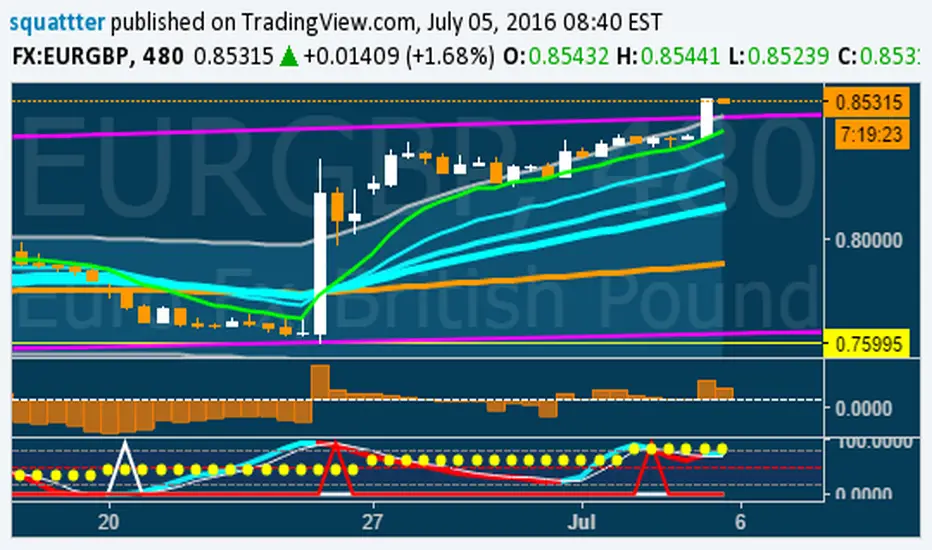
Stochastic CCI MTF w/ UP/DOWN colours - squattterStoch CCI has a nicer divergence than Stoch RSI.
Enjoy!