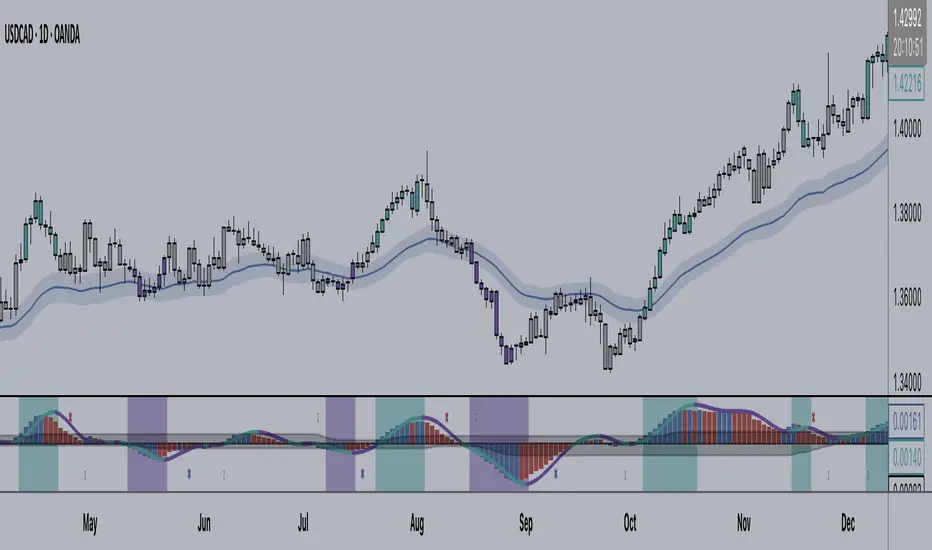
Vortex Signals [Gabremoku]Vortex Signals is a reworked version of the classic Vortex Indicator designed to make directional shifts easier to read and less reactive than raw crossover-based interpretations.
Instead of treating every VI+ / VI- crossover as a direct trading signal, this script uses the Vortex lines as a regime detector first, then looks for signal quality through spread expansion and re-activation after a pullback. The goal is to reduce the noisy sequence of repeated entries and exits that often appears when the standard Vortex is used on its own.
What the script does:
Plots the classic Vortex components, VI+ and VI-.
Fills the space between the two lines with a dynamic gradient that reflects which side is dominant and how strong the current spread is.
Detects bullish and bearish dominance regimes.
Uses a signal engine based on regime change, spread expansion, and first valid continuation after weakening.
Prints compact chart markers for LONG, SHORT, and CLOSE events.
Includes a dashboard to show current state, sequence status, setup condition, spread, slope, and directional bias.
How it works:
Regime: the script first determines whether VI+ is above VI- or VI- is above VI+.
Spread: it measures the distance between the two Vortex lines to evaluate whether dominance is meaningful or weak.
Expansion: a regime becomes more relevant when the spread rises above its short baseline and continues widening.
Trigger logic: instead of firing on every crossover, the script waits for either an early valid impulse after regime change or the first useful re-expansion after a pullback inside the same regime.
Why this is different from the classic Vortex:
The built-in Vortex is often read through raw line crossovers.
This script reframes the indicator as a dominance and continuation tool rather than a pure crossover trigger.
The signal engine is designed to capture cleaner transitions and continuation phases while avoiding part of the back-and-forth noise that often occurs in choppy conditions.
How to use it:
In Long mode, focus on bullish dominance and the appearance of a LONG marker after spread expansion or re-expansion.
In Short mode, focus on bearish dominance and the appearance of a SHORT marker after the same logic on the opposite side.
CLOSE markers appear when the opposite Vortex condition breaks the active sequence.
Suggested use:
This script is generally better suited to trending or directional environments than to highly compressed sideways markets.
In my testing and chart observation, the signals can appear cleaner on the 1H timeframe, where short-term noise is often reduced compared with very low timeframes, but users should still adapt settings to the instrument and market structure they trade.
Notes:
This indicator is not predictive and does not guarantee profitable signals.
It should be used as a decision-support tool together with price structure, risk management, and broader market context.
As with any directional model, false signals can still occur during whipsaw or transition phases. Indicator

Indicator

Indicator

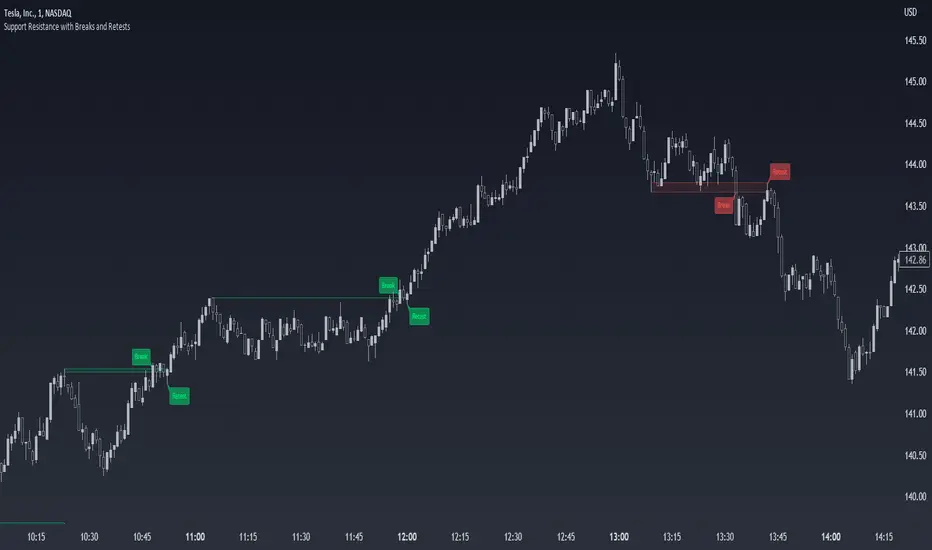
Liquidity Sweep Probability [JOAT]Liquidity Sweep Probability is an open-source Pine Script v6 overlay that maps equal highs and equal lows, tracks sweeps through those levels, detects reclaim behavior, and records simple continuation samples after reclaim events. It is designed for traders who want a clean way to observe where price has built nearby liquidity and how price behaves after that liquidity is tested.
The script does not claim that a sweep must reverse price. Instead, it separates equal-level creation, sweep, reclaim, break, and continuation outcomes. The dashboard shows the most recent event, the side involved, sample counts, and an adaptive probability-style reading derived from the script's own observed samples.
Core Concepts
1. Equal High and Equal Low Detection
Confirmed pivots are compared against the previous pivot on the same side. If two pivot highs or lows are within an ATR-based tolerance, a liquidity zone is created.
pivotHigh = ta.pivothigh(high, pivotLength, pivotLength)
if not na(lastHighPivot) and math.abs(pivotHigh - lastHighPivot) <= equalTolerance
zoneTop = math.max(pivotHigh, lastHighPivot) + zonePadding
zoneBottom = math.min(pivotHigh, lastHighPivot) - zonePadding
2. Sweep State
A high-side sweep occurs when price trades beyond the equal high zone but closes back below the zone top. A low-side sweep occurs when price trades below the equal low zone but closes back above the zone bottom.
3. Reclaim State
After a sweep, the script watches a configurable reclaim window. A high-side reclaim requires price to close back below the lower boundary of the swept high zone. A low-side reclaim requires price to close back above the upper boundary of the swept low zone.
4. Continuation Sampling
After reclaim, the script stores a target distance based on ATR and tracks whether price reaches it within the outcome window. These counts are displayed as samples. They are descriptive statistics from the chart, not a prediction.
5. Probability Panel
The probability-style score blends observed sample rate, sweep distance, zone age, and reclaim status. It gives a compact read of the current event context.
sampleRate = total > 0 ? (wins * 100.0) / total : 50.0
score = clamp(sampleRate * 0.62 + 19.0 + distanceBoost + ageBoost + reclaimBoost, 5.0, 95.0)
Features
Equal high and equal low zones: ATR tolerance avoids exact-price-only matching
Sweep detection: Tracks confirmed high-side and low-side liquidity sweeps
Reclaim detection: Separates immediate breaks from reclaim behavior
Continuation samples: Counts historical reclaim outcomes within the active chart sample
Dashed midlines: Each zone includes a center reference line
Stateful labels: Zones update from Equal High/Low to Sweep, Reclaimed, or Broken
Probability panel: Shows side, status, chance value, samples, and age
Alerts: Sweep, reclaim, and zone break conditions
Input Parameters
Swings:
Swing Pivot Length: Pivot sensitivity for equal-level detection
Equal-Level Tolerance: ATR fraction used to compare pivots
Zone Padding: ATR fraction added around the equal level
ATR Length: Volatility length for tolerance and padding
Behavior:
Reclaim Window: Bars allowed for reclaim after sweep
Continuation Window: Bars allowed for measuring post-reclaim continuation
Continuation Distance: ATR target used for sample tracking
Maximum Zones Per Side: Object cap for high and low zones
Visual:
Palette: Selects bull and bear colors
Zone Extension Bars: Forward extension for boxes and midlines
Probability Panel: Shows or hides the dashboard
How to Use This Indicator
Step 1: Identify Equal-Level Zones
Equal highs can act as high-side liquidity references. Equal lows can act as low-side liquidity references.
Step 2: Watch for Sweep and Reclaim
A sweep alone is not enough. Reclaim behavior shows that price tested outside the zone and then closed back through the zone boundary.
Step 3: Read the Sample Count
The sample row shows how many observed reclaim events reached their ATR target on the current chart sample. A small sample should be treated carefully.
Step 4: Use Zones as Context
Use the zones to frame liquidity behavior, then combine the context with your own entry trigger and risk plan.
Indicator Limitations
Equal-level zones are based on confirmed pivots, so they appear after the pivot confirmation window
The probability value is descriptive and chart-dependent
A small number of samples should not be treated as statistically strong
Fast markets may sweep, reclaim, and break multiple zones quickly
Object limits require the script to delete older zones when caps are reached
Originality Statement
Liquidity Sweep Probability is original in its state machine for equal-level zones, sweep/reclaim/break classification, and live sample tracking. It uses public Pine v6 mechanics to build a self-contained liquidity map without copying another indicator's source.
Disclaimer
This script is provided for educational and informational use only. It is not financial advice or a recommendation to buy or sell any financial instrument. Trading involves substantial risk of loss. Liquidity sweeps can continue, reverse, or fail without warning. Always use independent analysis and proper risk management.
-Made with passion by jackofalltrades
Indicator

Indicator

Smart Money Displacement Ladder [AGPro Series]Smart Money Displacement Ladder
🧠 Core Idea
Is displacement strong, clean, and sustained enough to shift market context?
📌 Overview / What it does
Smart Money Displacement Ladder is a rule-based market-structure and price-action visualization tool designed to study strong directional displacement candles.
The script identifies clean bullish or bearish displacement, maps the imbalance shelf created by the candle, tracks ladder-style follow-through, and highlights whether the displacement is being sustained or failing.
It does not predict price direction, automate trades, or guarantee that displacement will continue. It is a structured decision-support map for displacement quality, imbalance shelf behavior, ladder continuation, and failure context.
🎯 Purpose & Design Philosophy
Many smart-money or imbalance tools mark a gap, a candle, or a generic continuation zone.
This script was built to answer a more complete question:
Did displacement actually change context, and is the market defending that displacement?
The design goal is to help traders read displacement as a progression: clean candle, shelf defense, ladder step, sustained pressure, or failure.
⚡ Why This Script Is Different
Most tools focus on single displacement candles, fair value gaps, or basic momentum signals.
This script does NOT treat every large candle as meaningful displacement.
Instead, it checks candle body, range, close location, optional volume participation, shelf defense, and ladder continuation. The focus is displacement quality and progression rather than simple candle marking.
⚙️ Methodology
1. Candle Quality Detection
The script evaluates candle body size, full range, and close strength relative to ATR.
2. Displacement Validation
A candle must satisfy directional and quality thresholds before it becomes the active displacement anchor.
3. Imbalance Shelf Mapping
After displacement forms, the script projects an imbalance shelf from the displacement candle.
4. Ladder Evaluation
Price extension beyond the active ladder level increases the ladder step count and strengthens the continuation context.
5. Visual Output
The chart displays the displacement box, imbalance shelf, ladder rails, centered shelf label, event labels, right-side tags, alerts, and a compact AG Pro decision panel.
🗺️ How to Read the Chart
Displacement Box = the active candle range that created the displacement anchor.
Imbalance Shelf = the projected shelf that should ideally remain defended after displacement.
Ladder Rail = the active extension level used to track follow-through.
Centered Shelf Label = the main visual anchor inside the active imbalance shelf.
Right-Side Tags = current displacement state, quality score, and shelf reference.
Event Labels = clean displacement, ladder continuation, or displacement failure labels.
Panel = summarizes displacement state, direction, quality score, ladder steps, shelf range, next context, and timeframe.
🚦 Signals & States
• CLEAN DISPLACEMENT → a directional candle meets displacement quality rules.
• FOLLOW-THROUGH → price extends beyond the active ladder level after displacement.
• LADDER STEP → a new continuation step is formed.
• SUSTAINED DISPLACEMENT → multiple ladder steps are active after the displacement anchor.
• DISPLACEMENT FAIL → price loses the imbalance shelf during the failure window.
• WAIT DISPLACEMENT → no valid displacement anchor is active yet.
🔔 Alerts Logic
Alerts trigger when a major displacement state appears.
• Clean Displacement → a clean directional displacement candle has formed.
• Displacement Ladder Continuation → price extended the active displacement ladder.
• Displacement Failure → price lost the active imbalance shelf after displacement.
Alerts are attention markers, not trade instructions.
🧩 Confluence Logic
The context becomes stronger when:
• Candle body is large relative to ATR
• Candle range expands cleanly
• Close location is strong in the displacement direction
• Relative volume supports participation
• The imbalance shelf remains defended
• Price forms additional ladder steps
• The panel state agrees with chart labels
If these elements do not align, the script avoids forcing a displacement continuation interpretation.
📊 When to Use
• Smart-money displacement studies
• Market-structure shift review
• Momentum expansion analysis
• Imbalance shelf tracking
• Trend continuation context
• Crypto, forex, stocks, and index markets
• 1H, 4H, and daily charts
⚠️ When NOT to Use
• Very low-liquidity symbols
• Extremely noisy markets with unreliable candle structure
• News spikes where displacement quality may be distorted
• Ultra-low timeframes with excessive wick noise
• Markets where large candles repeatedly fail without structure
• Situations where displacement should not be interpreted without broader context
🎛️ Key Inputs
• ATR Length → normalizes displacement size, shelf depth, and label spacing.
• Minimum Body ATR → controls how large the candle body must be before displacement qualifies.
• Minimum Range ATR → controls how much total candle expansion is required.
• Close Strength Threshold → controls how strong the candle close must be inside the range.
• Use Volume Confirmation → adds relative volume to quality scoring.
• Shelf Failure Window → controls how long shelf failure remains relevant after displacement.
• Imbalance Shelf ATR → controls shelf thickness.
• Projection Bars → controls how far shelves, rails, and tags project.
• Label Font Size → controls chart label and tag text size.
• Panel Font Size → controls panel text size.
🖥️ Interface & Visual Design
The visual hierarchy is built around the displacement progression.
The displacement box marks the anchor candle.
The shelf shows where displacement should ideally remain defended.
The ladder rail shows whether price is extending.
The centered badge keeps the active shelf readable at first glance.
The AG Pro panel summarizes the current displacement state without requiring the user to inspect every candle manually.
🧪 Practical Usage Workflow
1. Wait for a clean displacement candle.
2. Check the imbalance shelf created by that candle.
3. Watch whether price defends or loses the shelf.
4. Look for ladder steps after shelf defense.
5. Use the panel to confirm direction, quality, ladder count, and next context.
6. Interpret the output inside broader trend, liquidity, volatility, and structure context.
🔍 Interpretation Guidelines
Clean displacement does not guarantee continuation. It means the candle met the script's displacement quality rules.
A defended shelf does not guarantee trend expansion. It means price has not invalidated the displacement shelf during the active window.
A ladder step does not guarantee follow-through. It means price extended the active ladder reference.
A displacement failure is a structural warning, not a trading command.
🚫 What This Script Is NOT
This script is not a prediction engine.
It is not financial advice.
It is not an auto-trading system.
It does not provide guaranteed entry or exit signals.
It is not a simple fair value gap marker.
It is not a full smart-money concept trading system.
⚠️ Limitations & Transparency
Displacement quality depends on ATR and candle structure.
Timeframe differences can change displacement visibility.
High volatility can create large candles that fail quickly.
Low-liquidity markets may create misleading candle expansion.
Shelf behavior should be interpreted within broader market structure.
The script is designed for structured interpretation, not certainty.
🧠 Market Context Notes
Displacement often matters most when it appears near important structure, after liquidity events, or during momentum expansion.
The same displacement candle can mean different things in a strong trend, a range, a liquidity sweep, or a news shock.
The script should be read together with volume, volatility, liquidity, and higher-timeframe context.
🧾 Use Case Examples
• If a bullish displacement candle forms and the shelf remains defended, the ladder may show follow-through context.
• If a bearish displacement candle forms and price quickly reclaims the shelf, the map may show displacement failure.
• If multiple ladder steps form after displacement, the script may classify the move as sustained displacement.
🧱 System Philosophy
Smart Money Displacement Ladder is part of the AGPro Series approach to decision-support tools:
clear structure, premium chart readability, honest interpretation, and no promise of certainty.
The goal is to help traders see whether displacement is being defended and extended, without turning every strong candle into a forced signal.
🔐 Non-Promise Statement
No script can know the future.
No displacement candle guarantees continuation.
No signal should be interpreted without broader market context.
📉 Risk Disclosure
Trading involves risk.
Markets can move unpredictably.
This script is for educational and analytical purposes only.
It does not provide financial advice or guaranteed trading outcomes.
Users remain responsible for their own decisions.
📚 Educational Note
Use this script to study how displacement develops after a strong candle.
The value is not only in the displacement label. The value is in learning whether the market defends the shelf, extends through ladder steps, or rejects the displacement context.
Indicator

Failed Continuation Trap Map [AGPro Series]Failed Continuation Trap Map
🧠 Core Idea
Did a continuation attempt fail strongly enough to trap traders and create pressure in the opposite direction?
📌 Overview / What it does
Failed Continuation Trap Map is a rule-based price-action and market-structure visualization tool designed to study failed continuation attempts.
The script identifies trend-aligned continuation attempts, maps the attempted breakout zone, evaluates whether the move fails back through that zone, and highlights when trapped longs or trapped shorts may create opposite pressure.
It does not predict reversals, automate trades, or guarantee that a failed continuation will produce follow-through. It is a structured decision-support map for continuation failure, trap behavior, and opposite-pressure context.
🎯 Purpose & Design Philosophy
Many breakout and continuation tools focus on whether price moved beyond a level.
This script was built to answer a more selective question:
Did the continuation attempt fail in a way that changes the market narrative?
The design goal is to help traders read failed continuation as a trap context instead of treating every rejection as a reversal signal.
⚡ Why This Script Is Different
Most tools focus on breakouts, pullbacks, continuation signals, or reversal labels.
This script does NOT label every failed move as a trap.
Instead, it waits for a trend-aligned continuation attempt, tracks the attempt zone, evaluates failure quality, maps the trap pocket, and checks whether opposite pressure confirms after trapped participants are created.
⚙️ Methodology
1. Continuation Bias Detection
The script uses fast and slow EMAs to define the active continuation bias.
2. Attempt Mapping
When price attempts continuation beyond recent structure, the script records the attempt level and builds an attempt zone.
3. Failure Evaluation
After the attempt, the script watches a defined failure window to detect rejection back through the attempt level.
4. Trap and Pressure Scoring
Trap quality uses rejection wick behavior, relative volume, and failure timing.
5. Visual Output
The chart displays the attempt zone, trap pocket, opposite-pressure rail, centered trap label, event labels, right-side tags, alerts, and a compact AG Pro decision panel.
🗺️ How to Read the Chart
Attempt Zone = the area around the continuation level where breakout or continuation participants may enter.
Trap Pocket = the area where failed continuation can create trapped participants.
Opposite-Pressure Rail = the level used to read whether the failed continuation is turning into stronger pressure against the attempt.
Centered Trap Label = the main visual anchor inside the active trap pocket.
Event Labels = compact labels for attempts, long traps, short traps, and pressure confirmation.
Right-Side Tags = current trap state, attempt level, and pressure quality.
Panel = summarizes trap state, attempt type, trapped side, trap quality, pressure quality, next context, and timeframe.
🚦 Signals & States
• ATTEMPT ACTIVE → price attempted continuation and is still inside the failure evaluation window.
• TRAP ACTIVE → the continuation attempt failed back through the attempt level.
• OPPOSITE PRESSURE → price confirmed pressure away from the failed continuation attempt.
• CONTINUATION HOLD → the attempt is holding beyond the continuation zone.
• ATTEMPT EXPIRED → the attempt did not create a timely failure or pressure signal.
• WAIT ATTEMPT → no valid continuation attempt is active.
🔔 Alerts Logic
Alerts trigger when a major continuation-failure state appears.
• Continuation Attempt → price attempted continuation beyond recent structure.
• Failed Continuation Trap → continuation attempt failed back through the attempt zone with trap quality.
• Opposite Pressure Confirmed → opposite pressure confirmed after a failed continuation attempt.
Alerts are attention markers, not trade instructions.
🧩 Confluence Logic
The context becomes stronger when:
• Continuation bias is clear
• Price attempts continuation beyond recent structure
• The attempt fails back through the zone quickly
• Rejection wick quality is strong
• Relative volume supports participation
• Opposite-pressure rail confirms after the trap
• The panel state agrees with the chart labels
If these elements do not align, the script avoids forcing a trap interpretation.
📊 When to Use
• Breakout failure analysis
• Failed continuation review
• Trend continuation trap studies
• Intraday and swing market-structure analysis
• Crypto, forex, stocks, and index markets
• 1H, 4H, and daily charts
• Markets where continuation attempts are common and readable
⚠️ When NOT to Use
• Very low-liquidity symbols
• Extremely sideways markets with no continuation bias
• News-driven candles that distort rejection quality
• Ultra-low timeframes with excessive noise
• Markets where recent structure is too compressed to define a clean attempt zone
• Situations where a single failed attempt should not be treated as a standalone decision
🎛️ Key Inputs
• Fast EMA Length → defines the faster continuation-bias component.
• Slow EMA Length → confirms the broader continuation direction.
• ATR Length → normalizes attempt zones, trap pockets, labels, and failure levels.
• Continuation Breakout Lookback → defines recent structure used to identify continuation attempts.
• Failure Evaluation Window → controls how long after an attempt the script can classify failure.
• Attempt Zone ATR → controls the thickness of the continuation attempt zone.
• Trap Wick Threshold → defines how much rejection quality is needed before a failure becomes trap context.
• Use Volume Confirmation → adds relative volume to trap-quality scoring.
• Projection Bars → controls how far zones, rails, and right-side tags project.
• Label Font Size → controls chart label and tag text size.
• Panel Font Size → controls panel text size.
🖥️ Interface & Visual Design
The visual hierarchy is built around the failed-continuation story.
The attempt zone shows where continuation was attempted.
The trap pocket shows where trapped participants may become part of the next narrative.
The opposite-pressure rail gives a clean reference for pressure confirmation.
The centered badge keeps the active trap context readable at first glance.
The AG Pro panel summarizes the current trap state without forcing the user to decode every element manually.
🧪 Practical Usage Workflow
1. Let the script identify the active continuation bias.
2. Watch for an attempt beyond recent structure.
3. Check whether the attempt holds or fails back through the zone.
4. If trap context appears, watch the opposite-pressure rail.
5. Use the panel to confirm trap state, trapped side, and quality scores.
6. Interpret the output inside broader trend, liquidity, volatility, and support/resistance context.
🔍 Interpretation Guidelines
A continuation attempt does not guarantee follow-through. It means price attempted to move beyond recent structure in the trend direction.
A trap active state does not guarantee reversal. It means the continuation attempt failed back through the attempt zone with enough quality to deserve attention.
Opposite pressure does not guarantee trend change. It means trapped participants may be adding pressure against the attempted continuation.
The strongest readings occur when trap state, pressure rail, and broader market context align.
🚫 What This Script Is NOT
This script is not a prediction engine.
It is not financial advice.
It is not an auto-trading system.
It does not provide guaranteed entry or exit signals.
It is not a generic breakout indicator.
It is not a simple reversal marker.
⚠️ Limitations & Transparency
EMA bias can lag during fast reversals.
Failure windows may miss slow-developing traps.
Low-liquidity markets can produce misleading wick behavior.
High volatility can make attempt zones wider or less stable.
Timeframe differences can change how continuation attempts appear.
The script is designed for structured interpretation, not certainty.
🧠 Market Context Notes
Failed continuation traps often matter most when traders are leaning heavily in one direction and price fails to reward that pressure.
The same failed attempt can have different meaning in a strong trend, range, liquidity sweep, or volatility shock.
The script should be read together with broader structure, volume, liquidity, and trend context.
🧾 Use Case Examples
• If price attempts upside continuation and then closes back below the attempt level with a strong upper wick, the script may show long-trap context.
• If price attempts downside continuation and then rejects back above the attempt level, the script may show short-trap context.
• If price continues beyond the pressure rail after a trap, the script may show opposite-pressure confirmation.
🧱 System Philosophy
Failed Continuation Trap Map is part of the AGPro Series approach to decision-support tools:
clear structure, premium chart readability, honest interpretation, and no promise of certainty.
The goal is to help traders see when continuation logic breaks, without turning every failure into a forced reversal signal.
🔐 Non-Promise Statement
No script can know the future.
No failed continuation guarantees reversal.
No signal should be interpreted without broader market context.
📉 Risk Disclosure
Trading involves risk.
Markets can move unpredictably.
This script is for educational and analytical purposes only.
It does not provide financial advice or guaranteed trading outcomes.
Users remain responsible for their own decisions.
📚 Educational Note
Use this script to study how continuation attempts fail and how trapped participants can affect the next phase of market behavior.
The value is not only in the trap label. The value is in learning when a continuation narrative is accepted, rejected, or converted into opposite pressure.
Indicator

Impulse Correction Balance Map [AGPro Series]Impulse Correction Balance Map
🧠 Core Idea
Is the current correction still healthy compared with the prior impulse, or is the impulse losing structural balance?
📌 Overview / What it does
Impulse Correction Balance Map is a rule-based impulse and correction visualization tool designed to compare the current pullback with the prior directional swing leg.
The script identifies a valid bullish or bearish impulse, measures correction depth, maps the healthy-to-balanced correction pocket, and highlights whether price is still respecting the impulse structure or moving into failure risk.
It does not predict price direction, automate trades, or guarantee continuation after a pullback. It is a structured market-structure and wave-analysis tool for reading impulse strength, correction depth, balance, continuation, and failure context.
🎯 Purpose & Design Philosophy
Many pullback tools mark a retracement or draw generic Fibonacci levels.
This script was built to answer a more practical question:
Is the correction proportionate to the impulse that created it?
The design goal is to help traders evaluate pullbacks as part of a complete impulse-correction relationship instead of treating every retracement as equal.
⚡ Why This Script Is Different
Most tools focus on static retracement levels, generic trend strength, or simple pullback labels.
This script does NOT mark every pullback as a clean opportunity.
Instead, it builds the impulse leg first, measures the correction against that leg, separates healthy correction, balanced pullback, deep correction, continuation, and failure risk, then displays the story through premium chart visuals and a compact AG Pro panel.
⚙️ Methodology
1. Swing Detection
The script uses confirmed swing pivots to identify meaningful bullish or bearish impulse legs.
2. Impulse Validation
An impulse must meet a minimum ATR-normalized size before it becomes the active reference leg.
3. Correction Mapping
After the impulse forms, the script tracks the deepest correction point and calculates retracement depth as a percentage of the impulse.
4. Balance Evaluation
Correction depth is classified into healthy, balanced, deep, continuation, or failure states.
5. Visual Output
The chart displays the impulse box, correction pocket, depth ladder, centered pocket label, right-side tags, event labels, alerts, and a compact AG Pro decision panel.
🗺️ How to Read the Chart
Impulse Box = the prior validated directional swing leg.
Correction Pocket = the projected healthy-to-balanced retracement area.
Depth Ladder = reference rails for shallow, balanced, and deep correction zones.
Centered Pocket Label = the main visual anchor for the active balance pocket and quality score.
Right-Side Tags = current correction depth, balance state, and continuation reference.
Event Labels = key moments such as healthy correction, deep correction, continuation, or correction failure.
Panel = summarizes balance state, impulse direction, correction depth, impulse size, quality score, next context, and timeframe.
🚦 Signals & States
• HEALTHY CORRECTION → correction depth remains shallow relative to the impulse.
• BALANCED PULLBACK → correction is deeper but still inside the normal balance area.
• DEEP CORRECTION → correction is pressing into a riskier retracement zone.
• HIGH FAILURE RISK → correction is beyond the preferred balance area.
• CONTINUATION → price extends beyond the impulse end in the impulse direction.
• CORRECTION FAIL → price invalidates the impulse start area.
• WAIT IMPULSE → no valid impulse reference is active yet.
🔔 Alerts Logic
Alerts trigger when a major impulse-correction state appears.
• Healthy Correction → correction remains inside the healthy retracement area.
• Deep Correction Risk → correction depth moves into the deep-correction risk area.
• Continuation Trigger → price breaks beyond the impulse end in the impulse direction.
• Correction Failure → correction invalidates the impulse start area.
Alerts are attention markers, not trade instructions.
🧩 Confluence Logic
The context becomes stronger when:
• The impulse leg is large enough relative to ATR
• Correction depth remains proportionate
• Price respects the balance pocket
• Continuation appears after a controlled correction
• The panel state agrees with the event label
• Broader trend structure supports the impulse direction
If these elements do not align, the script avoids forcing a continuation interpretation.
📊 When to Use
• Trend continuation analysis
• Pullback evaluation
• Swing structure review
• Crypto, forex, stocks, and index markets
• Wave-style impulse and correction studies
• 1H, 4H, and daily charts
• Markets with clear directional legs and retracement behavior
⚠️ When NOT to Use
• Very low-liquidity symbols
• Extremely choppy markets with no clear swing structure
• News-driven candles where pivots may be distorted
• Ultra-low timeframes with excessive noise
• Markets where every pullback is immediately invalidated by volatility
• Situations where a single retracement should not be treated as a standalone decision
🎛️ Key Inputs
• Swing Pivot Length → controls how swing highs and lows are confirmed.
• Minimum Impulse ATR → defines how large the impulse must be before it becomes active.
• ATR Length → normalizes impulse size, label spacing, and correction context.
• Healthy Correction Max % → defines the upper boundary of the shallow correction zone.
• Balance Correction Max % → defines the upper boundary of the balanced correction zone.
• Deep Correction Max % → defines the deep-correction risk boundary.
• Projection Bars → controls how far correction pockets, rails, and tags project.
• Label Font Size → controls chart label and tag text size.
• Panel Font Size → controls panel text size.
🖥️ Interface & Visual Design
The visual hierarchy is built around the impulse-correction relationship.
The impulse box shows the directional leg.
The correction pocket shows where a controlled retracement can remain balanced.
The depth ladder shows where the correction becomes shallow, balanced, deep, or risky.
The centered badge makes the pocket readable at first glance.
The AG Pro panel summarizes the current state without forcing the user to inspect every level manually.
🧪 Practical Usage Workflow
1. Wait for a valid impulse leg to appear.
2. Check the correction pocket and depth ladder.
3. Read the current balance state in the panel.
4. Watch whether the correction stays healthy, becomes deep, or fails.
5. Look for continuation only after the correction context remains controlled.
6. Interpret the result inside broader trend, liquidity, and volatility context.
🔍 Interpretation Guidelines
A healthy correction does not guarantee continuation. It means the retracement is still proportionate to the prior impulse.
A deep correction does not guarantee reversal. It means the pullback is approaching an area where the original impulse is less structurally clean.
A continuation trigger does not guarantee follow-through. It means price extended beyond the impulse end according to the script's rule set.
A correction failure is a structural warning, not a trading command.
🚫 What This Script Is NOT
This script is not a prediction engine.
It is not financial advice.
It is not an auto-trading system.
It does not provide guaranteed entry or exit signals.
It is not a standard Fibonacci retracement tool.
It is not a full Elliott Wave counter.
⚠️ Limitations & Transparency
Swing detection depends on pivot confirmation, so signals can appear after pivots are confirmed.
Timeframe differences can change impulse and correction structure.
High volatility may cause correction depth to expand quickly.
Low-liquidity markets may produce unreliable swing pivots.
The script is designed for structured interpretation, not certainty.
🧠 Market Context Notes
Impulse-correction behavior is strongest when the market has a clear directional leg, a readable retracement, and enough liquidity for swing structure to matter.
The same correction depth can mean different things in a strong trend, a range, or a volatility shock.
The script should be read together with broader structure, volume, volatility, and market regime.
🧾 Use Case Examples
• If a bullish impulse forms and the correction remains shallow, the map may show healthy correction context.
• If a bearish impulse forms and price retraces deeply against it, the map may show deep correction or failure risk.
• If price breaks beyond the impulse end after a controlled correction, the map may show continuation.
🧱 System Philosophy
Impulse Correction Balance Map is part of the AGPro Series approach to decision-support tools:
clear structure, premium chart readability, honest interpretation, and no promise of certainty.
The goal is to help traders understand the relationship between impulse strength and correction depth without turning analysis into signal spam.
🔐 Non-Promise Statement
No script can know the future.
No correction depth guarantees continuation or reversal.
No signal should be interpreted without broader market context.
📉 Risk Disclosure
Trading involves risk.
Markets can move unpredictably.
This script is for educational and analytical purposes only.
It does not provide financial advice or guaranteed trading outcomes.
Users remain responsible for their own decisions.
📚 Educational Note
Use this script to study how impulses and corrections relate to each other.
The value is not only in the label. The value is in learning whether a pullback is proportionate, stretched, balanced, or structurally weak compared with the impulse that came before it.
Indicator

Crossframe Bias Ledger [JOAT]Crossframe Bias Ledger
Introduction
Crossframe Bias Ledger is an open-source non-repainting higher-timeframe bias overlay built to align an intermediate timeframe, a major timeframe, and the local chart into one directional map. It uses safely delayed `request.security()` calls, crossframe basis clouds, premium/discount rails, alignment boxes, execution-state labels, and an optional TP/SL scaffold on fresh confirmed alignment shifts.
The script solves directional context across timeframes. Many local signals fail because they are taken against dominant higher-timeframe structure. Crossframe Bias Ledger keeps the user anchored to higher-timeframe alignment while still making the output actionable on the trading timeframe.
Core Concepts
1. Safe Higher-Timeframe Requests
All higher-timeframe values are retrieved using delayed indexing so incomplete higher-timeframe bars do not leak into the current chart:
idxHigher = barstate.isrealtime ? 1 : 0
idxCurrent = barstate.isrealtime ? 0 : 1
2. Primary and Secondary Trend Stacks
Fast, slow, and signal EMAs are retrieved from two higher timeframes and converted into directional scores.
3. Premium / Discount Map
The two higher-timeframe bases define a premium/discount zone. Price trading above the upper rail is treated as premium. Price trading below the lower rail is treated as discount. Price between them is treated as rebalancing.
4. Fresh Alignment Shifts
When the crossframe score crosses into confirmed bullish or bearish alignment, the script marks this as a fresh state transition and can build an informational TP/SL ladder.
5. Rebalance vs Continuation Logic
The script distinguishes rebalancing entries inside the premium/discount box from continuation conditions outside it.
Features
Non-repainting crossframe logic: Uses safely delayed higher-timeframe requests
Dual cloud system: Primary and secondary timeframe clouds on the chart
Premium / discount rails: Crossframe valuation map between the two HTF bases
Bias box: Forward execution window for the current crossframe state
Fresh alignment detection: Distinguishes a new bull/bear shift from an already active state
Continuation and rebalance readouts: Shows whether price is extending or rebalancing
Optional TP/SL ladder: Informational scaffold for new alignment shifts
Top-right dashboard: Displays state, signal, timeframe bias, location, execution mode, basis, and score
How to Use This Indicator
Step 1: Read whether the state is aligned up, aligned down, or mixed.
Step 2: Check if price is trading in premium, discount, or rebalance territory.
Step 3: Use fresh shifts to identify new state transitions. Use continuation and rebalance readings to differentiate execution style.
Step 4: Keep local entries aligned with the dominant crossframe bias whenever possible.
Indicator Limitations
Higher-timeframe logic is intentionally delayed for safety, so it will not react as quickly as unstable lookahead-based implementations
Premium/discount interpretation depends on the chosen timeframes
Mixed states are intentional and may persist when higher timeframes disagree
The TP/SL ladder is informational and does not place trades
Originality Statement
Crossframe Bias Ledger is original in the way it combines safe higher-timeframe delay logic, dual-basis premium/discount mapping, fresh alignment shifts, and execution-state scaffolding into one open-source overlay. The script is intended to provide a reusable top-down directional framework rather than a generic MTF trend line.
Disclaimer
This indicator is provided for educational and informational purposes only. It is not financial advice. Higher-timeframe alignment may still fail, reverse, or become mixed as new data forms. Always use independent analysis and risk management.
-Made with passion by jackofalltrades
Indicator

Volume Spike Aftershock Planner [AGPro Series]Volume Spike Aftershock Planner
🧠 Core Idea
After a volume spike, is price actually defending the impulse, absorbing it, or losing control completely?
📌 Overview / What it does
Volume Spike Aftershock Planner is designed to evaluate what happens after an abnormal volume expansion candle appears on the chart. Instead of stopping at the spike itself, the script studies the post-impulse behavior and organizes that structure into a readable decision-support framework.
The script maps a spike anchor, an active aftershock band, a failure boundary, and a target-room reference. It also produces contextual labels, right-side price tags, and a compact information panel that summarizes the current aftershock condition with a rule-based score.
This script does not attempt to predict the next candle, automate entries, or generate guaranteed continuation signals. It is an analytical visualization tool that helps users judge whether the spike is still being respected, partially absorbed, or fully invalidated.
🎯 Purpose & Design Philosophy
This script was built to solve a common gap in volume analysis.
Most traders can see when volume suddenly expands. The harder question is what to do with that information after the impulse bar closes. A large volume candle can lead to continuation, rejection, absorption, or complete failure, and those outcomes do not deserve the same interpretation.
This tool helps traders who want a more structured way to read post-spike behavior. It supports a patient, evidence-based mindset by focusing on participation quality, impulse defense, failure thresholds, and available room rather than hype or prediction.
⚡ Why This Script Is Different
Most volume tools focus on spike detection, raw histogram expansion, or one-bar climax alerts.
This script does NOT stop at identifying unusual participation.
Instead, it tracks the aftershock environment that forms after the spike, measures whether price is holding the impulse anchor, maps when the move is being absorbed, and highlights when the context has either matured or failed. The result is not just a volume event marker, but a structured framework for interpreting what the spike still means.
⚙️ Methodology
1. Context Detection
The script scans for abnormal volume participation and range expansion relative to recent behavior. It also reviews body quality so that weak, indecisive candles are filtered more carefully.
2. Reference Mapping
Once a valid spike is confirmed, the script establishes a spike anchor and builds an aftershock band around that reference. It also defines a failure boundary and a room projection.
3. Reaction Evaluation
Price is then evaluated relative to the anchor and surrounding rails. The script checks whether the impulse is being defended, fading back through the anchor, or failing beyond the allowed structure.
4. Visual Output
The final output includes the aftershock band, anchor reference, room line, failure line, event labels, right-side tags, optional bar coloring, and a dashboard panel that summarizes the current state.
🗺️ How to Read the Chart
Zones:
The aftershock band represents the active post-spike area where the market is being evaluated. It is the main structure zone for interpreting whether the impulse still matters.
Labels:
Labels mark important contextual events such as bull spike, bear spike, holding behavior, absorbed behavior, target review, and failure.
Colors:
Teal highlights constructive bullish behavior or defended impulse structure.
Pink highlights bearish structure, invalidation, or failed context.
Gold highlights review areas such as absorption or target-room interaction.
Indigo highlights the spike anchor reference.
Panel:
The panel summarizes the spike state, the Aftershock Score, participation quality, available room, and the current action state.
🚦 Signals & States
• Bull Spike → A bullish high-participation impulse anchor has been detected.
• Bear Spike → A bearish high-participation impulse anchor has been detected.
• Holding → Price is still defending the impulse structure after the spike.
• Aftershock Ready → The post-spike condition is strong enough to deserve active attention.
• Absorbed → Price has moved back through the anchor and the impulse is losing control.
• Target Review → The projected first room objective has been reached and context should be reassessed.
• Failed → The active aftershock structure has broken down beyond the allowed limit.
• Wait Spike → No valid active spike context is currently available.
• Expired → The spike is too old to remain actionable within the current framework.
🔔 Alerts Logic
Alerts can trigger when a new bullish or bearish spike is detected, when price begins to hold the impulse, when the aftershock condition becomes ready, when the move becomes absorbed, when target room is reached, or when the context fails.
These alerts are attention markers only. They highlight a structural event inside the script logic. They are not trade instructions, automated entries, or guarantees of follow-through.
🧩 Confluence Logic
The context becomes stronger when multiple conditions align at the same time.
For example, a high relative-volume spike with strong candle expansion, defended anchor structure, stable participation decay, and clear room beyond the band creates a much stronger environment than a spike that immediately collapses back through its reference level.
This confluence logic is what separates a meaningful aftershock structure from a noisy one-bar event.
📊 When to Use
• Markets with reliable volume behavior
• Crypto pairs with clean participation swings
• Stocks and indices with readable impulse candles
• Breakout or breakdown follow-through evaluation
• Continuation review after a strong reaction candle
• 1H, 4H, and 1D chart studies where impulse quality matters
⚠️ When NOT to Use
• Illiquid symbols with distorted or unreliable volume
• Extremely noisy low-range environments
• Symbols where volume feed quality is poor
• Isolated one-bar anomalies with no structural follow-through
• Extreme volatility conditions where impulse rails become unstable too quickly
🎛️ Key Inputs
• Relative Volume Length → Controls the participation baseline used for spike comparison.
• Minimum Relative Volume → Controls how large the volume expansion must be before the candle qualifies as a spike.
• Minimum Range Ratio → Controls how much price expansion is required.
• Minimum Body Ratio → Filters out weak spike candles with poor body commitment.
• Aftershock Band ATR → Controls the depth of the active aftershock zone.
• Failure Buffer → Controls how far price can move before the spike idea is considered broken.
• Minimum Ready Score → Controls how strict the script is before showing stronger actionable states.
• Visual Settings → Control labels, panel location, theme, font size, and optional chart styling.
🖥️ Interface & Visual Design
The visual design is built around clarity at first glance.
The panel gives a fast structural summary without forcing the user to inspect every line manually. The chart layer uses premium contrast and a clear hierarchy so the aftershock band, anchor, failure boundary, and room references remain readable without overwhelming the candles.
The goal is not decoration. The goal is clean interpretation under live market conditions.
🧪 Practical Usage Workflow
1. Read the panel to understand the current spike state and score.
2. Check whether a valid spike anchor and aftershock band are active.
3. Evaluate whether price is holding, absorbed, or failing relative to the anchor.
4. Review available room and decide whether the current context is mature, early, or already extended.
5. Use labels and tags as structured context markers, not as automatic commands.
🔍 Interpretation Guidelines
Treat the script as a structured reading framework.
A stronger score suggests that the spike had better participation, cleaner range expansion, and more stable post-spike structure. A weaker score suggests that the move may be losing informational value.
An absorbed state does not mean reversal is guaranteed. It means the original impulse is no longer being defended as cleanly as before.
A target-review state does not mean the move must stop. It means the first projected room objective has already been reached and the user should reassess the context rather than assuming endless continuation.
🚫 What This Script Is NOT
This script is not a prediction engine.
It is not a financial advice tool.
It is not an automated trading system.
It is not a broker integration.
It does not place orders.
It does not guarantee continuation, reversal, or profitability.
⚠️ Limitations & Transparency
This script is rule-based and depends on the quality of the underlying market data.
Timeframe changes can materially alter how spikes, bands, and room projections appear. High-volatility environments can also reduce the stability of post-spike structures. In thin or distorted markets, volume expansion may look meaningful while carrying very little analytical value.
The script should always be interpreted in broader market context rather than in isolation.
🧠 Market Context Notes
Volume spikes are often strongest when they appear at meaningful structure transitions, liquidity shifts, or expansion points where the market is forced to reveal intent.
That said, not every spike represents sustainable conviction. Some are exhaustion bursts, some are absorption events, and some are temporary reactions inside a larger opposing structure. The aftershock behavior is often more important than the spike itself.
🧾 Use Case Examples
Example 1:
Price breaks above a local range with a large bullish volume surge. The script marks a bull spike, price holds above the anchor, and the panel shifts into a stronger aftershock state. This suggests the impulse still deserves attention.
Example 2:
Price prints a large bearish impulse, but then quickly moves back through the anchor. The script shifts into an absorbed condition, signaling that the original downside impulse is losing control.
Example 3:
A high-volume move expands sharply, then reaches the target-room area. The script marks target review, reminding the user to reassess the move rather than assuming continuation is still efficient.
🧱 System Philosophy
AGPro Series tools are designed as decision-support frameworks, not signal vending machines.
The philosophy is simple: map structure clearly, make states readable, reduce noise, and help the user think better around live price behavior.
🔐 Non-Promise Statement
This script does not promise certainty.
It does not promise that a volume spike will continue, reverse, hold, or fail in any predetermined way. It simply organizes the available structure so the user can evaluate the situation with more clarity.
📉 Risk Disclosure
Trading and investing involve risk.
Market conditions can change quickly, and any analytical tool can produce outputs that become invalid under new volatility, liquidity, or structural conditions. Users remain fully responsible for their own decisions, risk management, and execution.
This script is provided for educational and analytical purposes only. It is not financial advice.
📚 Educational Note
This tool is most useful when treated as a market-reading assistant.
The best results usually come from combining it with broader structure analysis, liquidity awareness, and disciplined risk management rather than using it as a standalone trigger system.
Indicator

Indicator

Donchian Retest Readiness [AGPro Series]# Donchian Retest Readiness
🧠 Core Idea
After price breaks a Donchian Channel boundary, is the broken edge ready to act as a clean retest and continuation reference?
📌 Overview / What it does
Donchian Retest Readiness is a breakout-boundary decision-support script built around Donchian Channels.
The script maps the rolling Donchian high, low, and midpoint, detects channel breaks, builds a retest pocket around the broken edge, scores retest quality from 0 to 100, and projects continuation lanes with target rails.
It does not predict price direction, automate trades, or provide guaranteed signals. It organizes Donchian break context, retest quality, channel edge, risk, and action state into a clean visual workflow.
🎯 Purpose & Design Philosophy
Many breakout tools mark the moment price leaves a range, but the difficult part often comes after the break: deciding whether the broken edge is being respected.
This script was built for traders who want to evaluate Donchian breakout retests without treating every new high or new low as a complete trading idea.
The design supports structured observation: break first, retest pocket second, hold quality third.
⚡ Why This Script Is Different
Most Donchian tools focus on channel highs and lows.
This script does NOT stop at drawing the Donchian Channel.
Instead, it converts the broken channel edge into a decision zone, evaluates whether price returns to that area, measures hold quality, and summarizes readiness with a clear 0-100 score.
⚙️ Methodology
1. Donchian Channel Mapping
2. Breakout Boundary Detection
3. Retest Pocket Construction
4. Hold / Failure Evaluation
5. 0-100 Retest Readiness Score
6. Panel And Alert Output
🗺️ How to Read the Chart
The Donchian Channel shows the rolling high, low, and midpoint.
The retest pocket appears around the broken channel edge after a breakout.
READY RETEST labels appear when price interacts with the broken edge and holds with enough quality.
Continuation lanes and target rails show the projected area beyond the accepted retest context.
The panel summarizes Break State, Retest Score, Channel Edge, Risk, and Action.
🚦 Signals & States
• READY → A qualified Donchian retest has formed.
• MONITOR → A Donchian break is active and retest behavior is being evaluated.
• WAIT → The channel is valid, but no active break / retest context is present.
• INVALIDATED → Price failed back through the broken channel edge.
• BLOCKED → The Donchian channel is not suitable for evaluation under current settings.
🔔 Alerts Logic
Bullish Donchian Retest Ready triggers when price breaks above the Donchian high, returns to the broken edge, and holds with enough score quality.
Bearish Donchian Retest Ready triggers when price breaks below the Donchian low, returns to the broken edge, and holds with enough score quality.
Donchian Break Watch alerts mark the first boundary break when enabled.
Donchian Retest Invalidated triggers when price fails back through the broken edge.
Alerts are attention markers, not trade instructions.
🧩 Confluence Logic
The retest score combines wick response, close pressure beyond the broken edge, proximity to the retest pocket, breakout impulse, relative volume, and channel width quality.
When several of these conditions align, the retest context becomes stronger.
📊 When to Use
• Breakout markets
• Trend continuation setups
• Pullbacks after new highs or new lows
• Donchian Channel structure analysis
• Intraday or swing contexts where retest behavior matters
⚠️ When NOT to Use
• Very low-liquidity symbols
• Extremely noisy chop
• Abnormal spread conditions
• News spikes where retest behavior is unstable
• Markets where every boundary break immediately reverses
🎛️ Key Inputs
• Donchian Length → controls the rolling channel high and low.
• ATR Length → controls retest pocket depth, buffers, targets, and label spacing.
• Minimum Channel Width → blocks weak channels that are too narrow.
• Retest Pocket ATR → controls how wide the broken-edge retest pocket is.
• Minimum Ready Score → controls how selective READY states are.
• Projection Bars → controls how far pockets and targets extend.
• Visual settings → control channel, fill, pocket, lane, labels, tags, and panel.
🖥️ Interface & Visual Design
The script uses a clean AG Pro panel to summarize the current Donchian context.
The visual hierarchy is designed to keep the channel visible while making the active retest pocket and READY label easy to see.
Default settings keep failed and early watch labels off so publication screenshots remain clean.
🧪 Practical Usage Workflow
1. Read the panel state.
2. Check the Donchian channel boundary.
3. Wait for a break and retest pocket.
4. Evaluate whether price holds the broken edge.
5. Review target rails and failure risk.
🔍 Interpretation Guidelines
A READY retest means the broken Donchian edge is being respected according to the script rules.
It does not mean price must continue.
An invalidated retest means price failed back through the broken edge and the breakout context lost quality.
🚫 What This Script Is NOT
This script is not a prediction engine.
It is not a buy or sell signal generator.
It is not an automated trading system.
It does not guarantee breakouts, continuation, or reversals.
⚠️ Limitations & Transparency
Donchian behavior can vary by symbol, timeframe, volatility, and liquidity.
Shorter timeframes may produce more noise.
Longer Donchian lengths may react more slowly.
The script should be interpreted within broader structure, market regime, and risk context.
🧠 Market Context Notes
Donchian edges often become meaningful when market participants react to new highs, new lows, and breakout continuation attempts.
The strongest contexts usually combine a clean boundary break, controlled retest, and enough continuation room.
🧾 Use Case Examples
When price breaks above the Donchian high and later retests the broken edge without closing back through it, the script may mark a bullish READY RETEST.
When price breaks below the Donchian low and retests the edge from below with enough quality, the script may mark a bearish READY RETEST.
When price breaks out and then closes back through the broken edge, the retest can become invalidated.
🧱 System Philosophy
This script follows the AGPro Series approach: structured context, practical scoring, clean visuals, and decision-support states instead of noisy prediction claims.
🔐 Non-Promise Statement
No script can provide certainty.
No output should be treated as guaranteed.
All states are rule-based analytical markers.
📉 Risk Disclosure
Trading involves risk.
Users are responsible for their own decisions, risk management, and position sizing.
This script is for educational and analytical purposes only and does not provide financial advice.
📚 Educational Note
The purpose of this script is to help users study Donchian Channel breakout and retest behavior through a structured visual framework.
Indicator

Gap Reclaim Readiness [AGPro Series]# Gap Reclaim Readiness
🧠 Core Idea
Can price reclaim a gap edge with enough acceptance to make the structure worth monitoring?
📌 Overview / What it does
Gap Reclaim Readiness is a chart-first gap edge decision-support script built to evaluate whether price has returned to a gap boundary and reclaimed it with enough structural quality.
The script maps active gap zones, identifies the reclaim edge, builds a focused reclaim pocket, scores the reclaim from 0 to 100, and summarizes the current state inside a compact AG Pro panel.
It does not predict price direction, automate trades, or provide guaranteed signals. It is designed to organize gap-edge context, reclaim quality, fill risk, and continuation state into a clean visual workflow.
🎯 Purpose & Design Philosophy
Many gap tools focus only on whether a gap exists or whether it has been filled.
This script was built for the more practical question: after a gap forms, does price respect and reclaim the edge strongly enough to deserve attention?
It helps traders who use price action, gap reactions, continuation structure, and intraday context, while supporting a patient decision-making process instead of impulsive reaction.
⚡ Why This Script Is Different
Most tools focus on detecting gaps or tracking gap fill.
This script does NOT behave like a generic gap fill tracker.
Instead, it focuses on the reclaim edge: whether price returns to the boundary, accepts it, loses it, or fails to develop a clean reclaim context.
⚙️ Methodology
1. Gap Context Detection
2. Reclaim Edge Mapping
3. Reclaim Pocket Construction
4. Reaction And Acceptance Evaluation
5. 0-100 Reclaim Score
6. Fill Risk And Continuation State
7. Visual Output And Panel Summary
🗺️ How to Read the Chart
The gap zone marks the structural area created by a qualifying gap or displacement-style gap event.
The reclaim edge marks the key boundary price must respect to form a valid reclaim context.
The reclaim pocket highlights the area around the edge where reaction quality is evaluated.
READY RECLAIM labels appear when the reclaim context meets the required score threshold.
Target rails show projected continuation references after a qualified reclaim.
The panel summarizes Gap Edge, Reclaim Score, Fill Risk, Continuation, and Action.
🚦 Signals & States
• READY → A qualified gap edge reclaim has formed.
• MONITOR → A gap structure exists and the script is watching for reclaim behavior.
• WAIT → No active reclaim context is currently valid.
• INVALIDATED → Price failed back through the reclaim edge.
• EXPIRED → The reclaim window closed without a qualified reclaim.
🔔 Alerts Logic
Bullish Gap Reclaim Ready triggers when price reclaims a bullish gap edge with enough score.
Bearish Gap Reclaim Ready triggers when price reclaims a bearish gap edge with enough score.
Gap Reclaim Invalidated triggers when price fails back through the reclaim edge.
Gap Reclaim Expired triggers when the reclaim window closes without a qualified reclaim.
Alerts are attention markers, not trade instructions.
🧩 Confluence Logic
The reclaim score combines edge interaction, close acceptance, time quality, relative volume, gap size, and available continuation room.
When several of these conditions align, the context becomes stronger.
When they do not align, the script remains in WAIT, MONITOR, INVALIDATED, or EXPIRED state.
📊 When to Use
• Intraday price action workflows
• Gap reaction analysis
• Breakout and reclaim structures
• Continuation after displacement
• Markets where gap edges or price void boundaries matter
⚠️ When NOT to Use
Avoid relying on this script in extremely illiquid markets, very noisy low-volume symbols, holiday sessions, or conditions where gaps and displacement structures are not meaningful.
It should also not be used as a standalone decision tool without broader market context.
🎛️ Key Inputs
• Gap Mode controls how strict the gap detection logic is.
• Minimum Gap Size filters weak structures.
• Displacement Gap Fallback helps continuous markets where classic open gaps are rare.
• Reclaim Pocket ATR controls the depth of the reclaim pocket.
• Minimum Ready Score controls how strong the reclaim must be before READY appears.
• Fill Risk Threshold controls when a reclaim context becomes too filled or exhausted.
• Visual settings control labels, zones, right-side tags, panel location, and font size.
🖥️ Interface & Visual Design
The interface is designed to keep the chart readable while making the active reclaim structure easy to understand.
The panel uses the AG Pro blue header style and summarizes the current state without covering the whole chart.
Zones, pockets, labels, and target rails are designed to show structure first and avoid unnecessary noise.
🧪 Practical Usage Workflow
1. Identify whether the panel shows an active gap edge.
2. Check the reclaim pocket and nearby price reaction.
3. Read the reclaim score and fill risk.
4. Confirm whether the action state is READY, MONITOR, WAIT, INVALIDATED, or EXPIRED.
5. Combine the output with broader structure, liquidity, trend, and risk context.
🔍 Interpretation Guidelines
A higher reclaim score means the gap edge reaction is cleaner according to the script logic.
A high fill risk means the gap context may already be too consumed.
READY means the reclaim condition deserves attention, not that price must continue.
WAIT means there is no valid active reclaim context.
🚫 What This Script Is NOT
This script is not a prediction engine.
It is not financial advice.
It is not an auto-trading system.
It does not provide guaranteed signals.
It does not replace risk management or independent analysis.
⚠️ Limitations & Transparency
Gap behavior changes across markets, timeframes, liquidity conditions, and volatility regimes.
Continuous markets may create fewer classic gaps, so adaptive displacement logic is included to support broader usability.
Different symbols and timeframes may require different sensitivity settings.
🧠 Market Context Notes
Gap reclaim behavior is often stronger when aligned with trend, liquidity response, volume participation, and clean structure.
Weak reclaim attempts can fail quickly when price loses the edge or when the gap becomes fully consumed.
🔐 Non-Promise Statement
No script can guarantee future price behavior.
This tool provides structured visual context only.
📉 Risk Disclosure
Trading involves risk.
Users remain responsible for their own decisions.
This script is for educational and analytical purposes only and does not provide financial advice or guaranteed trading outcomes.
Indicator

Breakout Follow-Through Planner [AGPro Series]Breakout Follow-Through Planner
🧠 Core Idea
Did the breakout receive enough follow-through to stay valid?
📌 Overview / What it does
Breakout Follow-Through Planner is a chart-first breakout planning tool designed to evaluate what happens after price clears a recent structure edge.
Instead of treating the breakout candle as the full story, the script maps the broken level, creates a follow-through corridor, tracks post-break travel, measures close progress, monitors retest-depth risk, and converts the full sequence into a 0-100 Follow-Through Score.
The script produces a breakout line, follow-through corridor, weak-continuation labels, failure rail, target-room guide, alerts, and a clean AGPro decision panel. It does not predict price, automate trades, or issue entry/exit commands.
🎯 Purpose & Design Philosophy
This script was built for traders who already understand that a breakout is only the first event.
The practical question comes after the break: does price travel away from the level, hold enough distance, and preserve clean room, or does it stall and begin to retest too deeply? This planner turns that post-break phase into a readable decision process.
The design supports a planning mindset: identify the breakout, review follow-through quality, respect the failure rail, measure target room, and decide whether the active context still deserves attention.
⚡ Why This Script Is Different
Most breakout tools focus on the moment price crosses a level.
This script does NOT clone Breakout Volume Quality, Breakout Retest Readiness, Acceptance Breakout Planner, Volume Expansion Breakout Planner, or a generic support/resistance breakout scanner.
Instead, it focuses on post-break travel quality. The key question is not simply "did price break?" or "was volume high?" or "did the retest hold?" The key question is whether the breakout received enough follow-through after the break to remain structurally valid.
⚙️ Methodology
1. Context Detection
The script builds recent upper and lower breakout references from a configurable prior structure window.
2. Reference Mapping
When price closes beyond a reference edge by an ATR-normalized buffer, the planner starts an active breakout follow-through plan.
3. Reaction Evaluation
The model evaluates break candle quality, volume support, follow-through travel, number of closes beyond the breakout close, retest-depth risk, target room, and failure rail behavior.
4. Visual Output
The chart shows the breakout line, active follow-through corridor, failure rail, target-room guide, compact labels, and an AGPro panel summarizing the current decision state.
🗺️ How to Read the Chart
Follow-Through Corridor = the active path from the breakout close toward the target-room guide. Its text is centered inside the corridor.
Breakout Line = the structure edge that was cleared and now anchors the active plan.
Failure Rail = the invalidation reference behind the breakout line. It is an analytical guide, not a stop order.
Target Room = the projected planning guide based on the prior structure height.
Labels = compact markers such as BFT UP, BFT DN, FT READY, WEAK FT, RETEST RISK, FAIL RAIL, ROOM HIT, and TRACK.
Colors = teal supports constructive bullish follow-through, pink supports bearish follow-through, amber marks caution, indigo marks target-room review, and red marks failure rail pressure.
Panel = the main decision interface showing Breakout Side, Follow-Through, Retest Risk, Target Room, and Action.
🚦 Signals & States
• BFT UP → a bullish breakout started a follow-through review.
• BFT DN → a bearish breakout started a follow-through review.
• FT WATCH → follow-through evidence is developing but not complete.
• FT READY → travel, closes, score quality, and retest-depth conditions are constructive.
• WEAK FT → the follow-through window aged without enough progress.
• RETEST RISK → price moved too deeply back toward or through the breakout line.
• FAIL RAIL → price closed through the failure rail after the breakout plan.
• ROOM HIT → price reached the target-room guide and context should be reviewed.
🔔 Alerts Logic
Alerts can trigger when a bullish or bearish breakout plan starts, follow-through reaches the ready state, weak follow-through or retest risk appears, the failure rail is hit, or target-room review is reached.
These alerts are attention markers for chart review. They are not trade instructions, automated strategy rules, or guaranteed outcomes.
🧩 Confluence Logic
The strongest follow-through context usually appears when the breakout candle is clean, price travels away from the breakout close, multiple closes hold beyond the breakout close, retest depth remains controlled, volume support is present, and target room is still readable.
When these conditions weaken, the planner can shift toward FT WATCH, WEAK FT, RETEST RISK, FAILED, or TARGET REVIEW.
📊 When to Use
• Breakout continuation review
• Range exits where post-break travel matters
• Trend continuation attempts after structure breaks
• Breakouts that need a clear failure rail and target-room reference
• Chart review workflows where the trader wants a decision state instead of another raw breakout marker
⚠️ When NOT to Use
• Low-liquidity markets with unreliable candles or volume
• Extremely noisy ranges where every breakout immediately snaps back inside
• Abnormal news spikes where ATR and structure references may distort quickly
• Situations where the user needs full trade management, position sizing, or automation
🎛️ Key Inputs
• Structure Lookback → controls the recent high/low reference used for breakout detection.
• Break Buffer ATR → defines how far price must close beyond the reference edge.
• Minimum Break Quality → filters weaker breakout candles before the planner starts.
• Follow-Through Window → controls the early review period after the breakout.
• Required Travel ATR → defines the preferred post-break travel distance.
• Maximum Clean Retest Depth ATR → controls when retest depth becomes risk.
• Failure Rail ATR → sets the analytical invalidation rail behind the breakout line.
• Target Room Range Multiple → projects the target-room guide from prior structure height.
• Visual and Panel Settings → control corridor visibility, labels, panel location, theme, and font sizes.
🖥️ Interface & Visual Design
The interface is intentionally chart-first.
The follow-through corridor carries the main story, while the breakout line, failure rail, and target guide create a clean level-risk-room hierarchy. Labels are compact and controlled by cooldown and maximum-visible settings so the chart remains active without becoming crowded.
The AGPro panel uses a merged blue title row and a compact decision layout for fast review.
🧪 Practical Usage Workflow
1. Read the panel to identify the current breakout side and follow-through state.
2. Check the breakout line and follow-through corridor.
3. Review whether price is traveling away, stalling, retesting too deeply, or reaching target room.
4. Use the failure rail as a structural review reference.
5. Treat the Action row as a planning prompt, not as an instruction.
🔍 Interpretation Guidelines
The Follow-Through Score should be read as context quality, not certainty.
A higher score means the breakout has cleaner post-break travel under the script's rules. A lower score means the breakout may be stalling, losing distance, retesting too deeply, or lacking enough supporting evidence.
The target-room guide does not forecast price. It gives a structured reference for whether the current path still has room to review.
🚫 What This Script Is NOT
This script is not a prediction engine.
This script is not financial advice.
This script is not an auto-trading system.
This script does not provide guaranteed signals.
This script is not a generic support/resistance map.
This script is not a Breakout Volume Quality clone.
This script is not a Breakout Retest Readiness clone.
⚠️ Limitations & Transparency
The script is rule-based and depends on the selected lookback, ATR length, timeframe, and symbol behavior.
Different markets can produce different breakout behavior. Lower timeframes may show more noise. Higher timeframes may produce fewer but cleaner events.
Volatility changes can affect corridor size, failure rail distance, target-room projection, and event frequency. Outputs should be interpreted within broader market context.
🧠 Market Context Notes
Breakout follow-through is usually most useful when structure is readable, liquidity is sufficient, and the market has enough room to travel after the break.
Volume can support the score, but the script is not built around volume alone. The central decision layer is post-break price travel and structural validity.
🧾 Use Case Examples
When price breaks above recent structure and immediately travels away with multiple closes beyond the breakout close, the planner can move from FT WATCH toward FT READY.
When price breaks but returns deeply through the breakout line before enough travel appears, the planner can mark RETEST RISK or FAIL RAIL.
When price reaches the projected target-room guide, the planner shifts to ROOM HIT so the context can be reviewed instead of blindly extended.
🧱 System Philosophy
The script is built around the AGPro decision-engine approach: structure first, quality score second, risk and target context always visible, and no promise-based signals.
🔐 Non-Promise Statement
No script can provide certainty.
No output should be treated as a guarantee.
The tool organizes breakout follow-through context so users can review price action with more structure.
📉 Risk Disclosure
Trading involves risk.
Users are responsible for their own decisions.
This script does not provide financial advice.
📚 Educational Note
Use the planner to study how breakouts behave after the first break. The value is in comparing clean follow-through, weak continuation, deep retests, and failure-rail behavior across many examples.
Indicator

Trend Re-Entry Planner [AGPro Series]Trend Re-Entry Planner
🧠 Core Idea
Is an active trend pullback creating a clean re-entry planning context, or is the reset becoming too risky?
📌 Overview / What it does
Trend Re-Entry Planner is a chart-first trend continuation planning tool designed to evaluate pullbacks inside an active trend structure. The default profile is tuned for 1H charts, where re-entry pockets, trigger candles, invalidation edges, and target-room context usually remain more readable.
The script builds a re-entry pocket from the current impulse range, scores the quality of the pullback, maps a trend defense line, shows an invalidation edge, and estimates target-room context. The goal is to help users judge whether a pullback is becoming organized enough for review or whether the trend context should be rebuilt.
It does not predict price, automate entries, or turn every pullback into a signal. It is a rule-based planning framework for evaluating trend re-entry structure.
🎯 Purpose & Design Philosophy
This script was built for traders who already track trend continuation but want a cleaner way to decide whether a pullback is worth attention.
Many trend tools show direction. Many pullback tools mark a reaction. This script focuses on the planning layer between those two ideas: trend side, pullback depth, reset quality, trigger behavior, target room, risk edge, and next action.
The design supports a disciplined workflow: evaluate context first, then decide whether the setup is ready, confirmed, invalidated, or still waiting.
⚡ Why This Script Is Different
Most tools focus on trend direction, moving average crosses, or broad pullback labels.
This script does NOT clone SuperTrend pullback grading, generic trend continuation signals, or low-volume pullback zones.
Instead, it uses an EMA trend stack and impulse-based re-entry pocket to build a planning view around the current pullback. The output is not just a marker. It is a decision panel with a 0-100 re-entry score, pullback depth, risk edge, target-room context, and next-action state.
⚙️ Methodology
1. Context Detection
The script identifies active bullish or bearish trend structure using an EMA stack and directional slope.
2. Reference Mapping
It maps the current impulse range and builds a concept-native re-entry pocket from that range.
3. Reaction Evaluation
The engine scores trend slope, pullback depth, reset quality near the mid EMA, trigger candle behavior, and target-room availability.
4. Visual Output
The script displays the re-entry pocket, invalidation edge, target-room guide, event labels, sparse context labels, and a premium AG Pro planning panel.
🗺️ How to Read the Chart
Zones = the re-entry pocket and target-room area used for planning context.
Labels = READY, CONFIRMED, INVALIDATED, FOLLOW-THROUGH, and sparse context states.
Colors = teal for bullish continuation context, pink for bearish or invalidation context, yellow for watch/review states, and indigo for target-room or follow-through emphasis.
Panel = the compact decision dashboard showing trend side, re-entry score, pullback depth, risk edge, and action.
🚦 Signals & States
• WATCH → the pullback is developing but still needs confirmation or cleaner structure.
• READY → the re-entry context has enough quality for closer review.
• CONFIRMED → a qualifying trigger candle appears after the pullback context improves.
• FOLLOW-THROUGH → the confirmed context produces a stronger continuation marker.
• INVALIDATED → price crosses the active invalidation edge and the plan should be rebuilt.
🔔 Alerts Logic
Alerts trigger when the script detects READY, CONFIRMED, INVALIDATED, or FOLLOW-THROUGH states.
Each alert is an attention marker tied to the rule-based state engine. Alerts are not trade instructions and do not guarantee that continuation will occur.
🧩 Confluence Logic
The context becomes stronger when trend slope, pullback depth, mid-EMA reset quality, trigger candle behavior, and target-room availability align.
The script intentionally requires multiple conditions instead of labeling every trend pullback as meaningful.
📊 When to Use
• 1H charts with active directional structure
• Directional markets with clear trend structure
• Pullbacks after a visible impulse move
• Continuation review workflows
• Trend-following plans where risk edge and target room matter
⚠️ When NOT to Use
• Low-liquidity symbols with unreliable price movement
• Extremely choppy markets with frequent trend-stack flips
• News-driven volatility where pullback structure changes too quickly
• Markets where the active impulse range is stale or unclear
🎛️ Key Inputs
• Sensitivity → adjusts how selective the re-entry score model is.
• Planning Profile → keeps the default behavior tuned for hourly re-entry planning or allows manual/higher-timeframe adjustment.
• Impulse Lookback → controls the range used to build the re-entry pocket.
• Re-Entry Depth settings → define the shallow, ideal, and deep areas of the pocket.
• Thresholds → control WATCH, READY, and CONFIRMED state requirements.
• Visual settings → control zones, EMA stack, labels, panel theme, panel location, and font sizes.
🖥️ Interface & Visual Design
The interface is built around a clean AG Pro panel and chart-first planning visuals.
The re-entry pocket and target-room guide are intentionally restrained so price remains readable. Labels are limited and spaced to keep the chart informative without becoming crowded.
The first panel row uses the standard AGPro merged blue header format.
🧪 Practical Usage Workflow
1. Read the panel to identify trend side and current action.
2. Check whether price is interacting with the re-entry pocket.
3. Evaluate the score, pullback depth, and risk edge.
4. Wait for READY or CONFIRMED state before treating the context as review-worthy.
5. Rebuild the plan if the invalidation edge is crossed.
🔍 Interpretation Guidelines
Think in terms of planning quality, not certainty.
A higher score means the current pullback has more constructive re-entry characteristics according to the script's rule set. A lower score means the pullback is less organized, has poor target room, lacks a clear trigger, or has moved too close to invalidation.
Use the script as a structure-reading tool within broader market context.
🚫 What This Script Is NOT
• Not a prediction engine
• Not financial advice
• Not an auto-trading system
• Not guaranteed signals
• Not a SuperTrend pullback clone
• Not a generic support/resistance zone map
⚠️ Limitations & Transparency
The script is rule-based and depends on visible chart data.
Timeframe differences, volatility shifts, low liquidity, and sudden news events can change how re-entry structure appears.
The score reflects the internal model only. It does not know future order flow, future liquidity, or future market intent.
🧠 Market Context Notes
Trend re-entry quality is usually clearer when a market has directional structure, a readable impulse, and enough room before nearby obstacles.
When a trend is mature, overly extended, or choppy, the same pullback behavior may carry less useful information.
🧾 Use Case Examples
When price pulls into the re-entry pocket during a bullish EMA stack and then prints a constructive trigger candle, the script may shift from WATCH to READY or CONFIRMED.
When price crosses the invalidation edge, the script marks the context as INVALIDATED so the user can rebuild the plan instead of forcing the old structure.
🧱 System Philosophy
AGPro planning tools are designed to turn chart structure into a clearer decision workflow.
This script follows that philosophy by focusing on context, readiness, risk edge, and next action rather than simple signal output.
🔐 Non-Promise Statement
No script can guarantee continuation, reversal, profit, or accuracy.
This tool provides structured context only. Users should combine it with their own analysis, timeframe review, and risk management process.
📉 Risk Disclosure
Trading involves risk.
Users are responsible for their own decisions, position sizing, trade management, and risk control.
This script does not provide financial advice and does not guarantee trading outcomes.
📚 Educational Note
Trend Re-Entry Planner is intended to help users study how pullbacks behave inside active trend structure and how planning context can be organized more clearly.
Indicator

Trend Pullback Risk Planner [AGPro Series]Trend Pullback Risk Planner
🧠 Core Idea
Is the current pullback normal trend digestion, or is it becoming a risk shift that deserves review?
📌 Overview / What it does
Trend Pullback Risk Planner is a chart-first trend risk planner built to evaluate active pullbacks inside an established trend.
The script maps a Pullback Risk Pocket, trend defense line, invalidation reference, target-room guide, compact state labels, alert conditions, and a clean AGPro panel. It converts trend slope, pullback depth, volume dry-up, defense response, and target obstruction into a 0-100 Continuation Score.
It does not predict price movement, automate execution, or print buy/sell commands. Its purpose is to help traders judge whether a pullback is still controlled enough to review, or whether the trend context is starting to lose quality.
🎯 Purpose & Design Philosophy
This script was built for traders who already see a trend but need a cleaner way to evaluate pullback risk.
Many pullback tools focus on marking every retracement as a possible continuation setup. This planner focuses on the decision question behind the setup: is the pullback still being defended, is it getting too deep, does target room remain clean, and what should be reviewed next?
The design supports a risk-first mindset. It helps users read pullback behavior without turning the chart into a crowded signal board or a generic support/resistance map.
⚡ Why This Script Is Different
Most tools focus on identifying pullbacks or continuation signals.
This script does NOT try to clone a low-volume pullback zone, a generic trend continuation score, a Supertrend pullback model, or a broad support/resistance system.
Instead, it treats the pullback as a live risk review. The unique output is the Pullback Risk Pocket: a controlled planning area where depth, defense, volume behavior, target room, and invalidation context are evaluated together before the panel prints the next action state.
⚙️ Methodology
1. Context Detection
The planner identifies trend side using EMA stack structure and normalized trend slope. Users can keep the side automatic or restrict the tool to bullish-only or bearish-only review.
2. Reference Mapping
The script builds a Pullback Risk Pocket between the base trend reference and the defense line. It also maps an invalidation reference and a target-room guide.
3. Reaction Evaluation
The model evaluates pullback depth versus ATR, trend slope, volume dry-up, wick/close response inside the pocket, and distance to the nearest target-side obstruction.
4. Visual Output
The result is shown through a centered risk pocket label, defense/risk/target guide lines, compact event labels, alerts, and an AGPro decision panel.
🗺️ How to Read the Chart
Zones = the Pullback Risk Pocket where an active pullback is reviewed for normal digestion versus risk shift.
Labels = continuation-ready, risk-watch, weak-pullback, risk-shift, follow-through, and sparse pocket-context markers.
Colors = bullish trend context uses AGPro teal, bearish trend context uses AGPro pink, warning states use yellow, and invalidation/risk-shift states use red.
Panel = the panel summarizes Trend Side, Pullback Depth, Risk Pocket status, Continuation Score, target-room context, and Action.
🚦 Signals & States
• TREND ACTIVE → trend context exists, but price has not reached the pullback risk pocket.
• POCKET NEAR → price is approaching the pullback risk pocket and deserves attention.
• HEALTHY PULLBACK → pullback is being reviewed with constructive but not yet high-grade conditions.
• RISK WATCH → pullback depth or response quality is becoming less clean.
• CONTINUATION READY → pullback risk pocket is defending with sufficient score and target-room context for review.
• FOLLOW-THROUGH → price is responding after a defended pullback pocket.
• WEAK PULLBACK → pullback touched the pocket, but score quality is weak.
• RISK SHIFT → price crossed the invalidation reference and the context should be rebuilt.
• NO TREND → trend structure is not aligned enough for the planner.
🔔 Alerts Logic
Alerts trigger when the planner detects a Continuation Ready state, a Risk Watch state, a Risk Shift event, or Follow-Through after a defended pocket.
These alerts are attention markers. They are not trade instructions, not execution commands, and not guaranteed outcomes.
🧩 Confluence Logic
The strongest context appears when trend slope, controlled pullback depth, quiet retracement volume, a constructive defense response, and clean target room align at the same time.
When one or more of these elements weakens, the planner shifts toward POCKET NEAR, RISK WATCH, WEAK PULLBACK, or RISK SHIFT instead of forcing a continuation interpretation.
📊 When to Use
• Trending markets with visible pullback structure
• Continuation review after a clean directional leg
• Situations where pullback depth and defense quality matter
• Trade-planning workflows that need risk, invalidation, and target-room context
⚠️ When NOT to Use
• Flat, low-directional range conditions
• Low-liquidity charts with unreliable wick and volume behavior
• Extreme news volatility where pullbacks can invalidate quickly
• Situations where the user expects an automatic buy/sell system
🎛️ Key Inputs
• Planner Side → controls Auto, Bullish Only, or Bearish Only evaluation.
• Sensitivity → changes how strict the risk pocket and scoring model behave.
• EMA Lengths → define fast trend pressure, base pullback reference, and defense line.
• Pullback Depth Lookback → controls how the script measures retracement depth from the latest trend-side extreme.
• Risk Pocket Width ATR → controls the thickness of the pullback review area.
• Invalidation Buffer ATR → controls the distance of the invalidation reference beyond the defense line.
• Clean Target Room ATR → defines preferred room before target-side obstruction.
• Visual settings → control pocket visibility, guide lines, labels, panel location, theme, and font sizes.
🖥️ Interface & Visual Design
The interface is built around one main object: the Pullback Risk Pocket.
The centered pocket label keeps the active state visible without forcing users to read many separate markers. The guide lines show defense, invalidation, and target-room context. The AGPro panel keeps the decision state compact and readable.
Labels use controlled spacing, cooldown, and maximum-count settings so the chart remains active without becoming crowded.
🧪 Practical Usage Workflow
1. Read the panel Action state.
2. Check Trend Side and Pullback Depth.
3. Review whether price is near, inside, defending, or breaching the Pullback Risk Pocket.
4. Compare the Continuation Score with target-room context.
5. Treat alerts as attention markers and confirm broader market context independently.
🔍 Interpretation Guidelines
A higher Continuation Score means the active pullback is showing stronger alignment between trend slope, controlled depth, volume dry-up, defense response, and remaining target room.
CONTINUATION READY does not mean a trade should be opened. It means the pullback remains structurally constructive under the script's rule set.
RISK WATCH and RISK SHIFT are caution states. They help users slow down when pullback depth, defense response, or invalidation context becomes weaker.
🚫 What This Script Is NOT
This script is not a prediction engine.
It is not financial advice.
It is not an auto-trading system.
It does not provide guaranteed signals.
It is not a generic support/resistance zone map.
It is not a clone of Low Volume Pullback Zones, Trend Continuation Quality, or Supertrend Pullback Quality.
⚠️ Limitations & Transparency
Timeframe differences can change trend slope, pullback depth, and target-room readings.
Volume behavior can vary across markets and data feeds.
Fast volatility expansion can move price through the pocket before a clean review state appears.
The script is rule-based and should be interpreted as an analytical planning layer, not as certainty.
🧠 Market Context Notes
Pullbacks are not automatically healthy because they occur inside a trend. A clean trend pullback usually needs controlled depth, reduced against-trend pressure, visible defense response, and enough room before the next obstruction.
This planner is designed to keep that review process structured.
🧾 Use Case Examples
When price pulls into the risk pocket with controlled depth, softer relative volume, and a strong close back toward the trend side, the planner may classify the state as CONTINUATION READY.
When price enters the pocket but response quality is weak or depth becomes excessive, the planner may show RISK WATCH.
When price crosses the invalidation reference beyond the defense line, the planner may show RISK SHIFT.
🧱 System Philosophy
Trend Pullback Risk Planner follows the AGPro Series decision-engine approach:
Trend first.
Pullback risk second.
Defense and target room before action.
Attention markers instead of promises.
🔐 Non-Promise Statement
No script can guarantee that a pullback will continue.
No state should be interpreted as certainty.
All outputs should be reviewed within broader market context.
📉 Risk Disclosure
Trading involves risk.
Users are responsible for their own decisions, risk management, and trade execution.
This script is for educational and analytical purposes only and does not provide financial advice.
📚 Educational Note
The script is designed to help users think in structured pullback-risk terms: trend, depth, defense, target room, invalidation, and review.
Indicator

Volume Follow-Through Planner [AGPro Series]Volume Follow-Through Planner
🧠 Core Idea
Did high volume create real continuation, or was it only a one-bar event?
📌 Overview / What it does
Volume Follow-Through Planner is a decision-oriented volume analytics overlay built to evaluate what happens after a qualified high-volume candle appears.
Instead of only marking volume spikes, the script opens a follow-through review window, measures next-bar progress, spread quality, close location, trend-side alignment, risk-rail defense, target-room progress, and converts the result into a 0-100 follow-through score.
It produces volume event labels, a forward follow-through box, a centered box label, a risk rail, a target-room guide, continuation/failure state labels, optional target-review labels, alert conditions, and a compact AGPro planning panel. It does not predict future price, automate execution, or claim that a high-volume event must continue.
🎯 Purpose & Design Philosophy
This script was built for traders who want volume to answer a practical planning question: did the event actually create usable continuation context?
Many volume tools stop at detection. They show that volume was high, but they do not explain whether later candles accepted, extended, failed, or faded after the event.
Volume Follow-Through Planner fills that gap by treating volume as the start of a review process, not the final answer. The goal is a cleaner decision layer: event quality, follow-through quality, risk edge, bias context, and next action.
⚡ Why This Script Is Different
Most volume tools focus on identifying spikes, climaxes, absorption, or simple participation changes.
This script does NOT try to clone Volume Climax Detector, Volume Absorption Zones, Breakout Volume Quality, or a generic breakout scanner.
Instead, it focuses on post-event behavior. The volume event must be strong enough to matter, but the main question is what happens next: continuation, weak follow-through, risk building, target review, or failure.
⚙️ Methodology
1. Context Detection
The script measures local relative volume against a rolling volume baseline, normalizes candle spread by ATR, checks body quality, close location, and trend-side alignment.
2. Reference Mapping
When a qualified event appears, the script anchors a follow-through box from the event close toward a target-room guide and places a risk rail beyond the event candle.
3. Reaction Evaluation
During the review window, the planner measures next-bar progress, favorable movement, adverse movement, follow-through closes, rail defense, and time efficiency.
4. Visual Output
The result is converted into a 0-100 follow-through score, chart labels, centered box text, guide lines, panel rows, and alert conditions.
🗺️ How to Read the Chart
Zones = the follow-through box projected from the event close toward the target-room guide.
Labels = volume event, follow-through ready, one-bar event, target review, or failed event states.
Colors = teal for constructive bullish context, pink for constructive bearish context, yellow for caution, and indigo for target/strong review states.
Panel = compact decision summary showing Volume Event, Follow-Through, Spread Quality, Bias, and Action.
Risk rail = the invalidation reference behind the event candle. A confirmed close beyond it marks the active event as failed.
🚦 Signals & States
• Volume Event → a qualified high-volume candle opened a follow-through review.
• FT WATCH → the event is active but still needs more progress.
• FT READY → follow-through quality reached the planner threshold.
• RISK BUILDING → adverse movement is rising while the event is still active.
• ONE-BAR EVENT → volume appeared, but follow-through did not develop enough inside the review window.
• FAILED → price closed beyond the risk rail.
• TARGET REVIEW → the event reached the target-room guide and should be reviewed in context.
🔔 Alerts Logic
Alerts trigger when a qualified volume event appears, when follow-through reaches the ready threshold, when the risk rail is broken, when the target-room guide is reached, and when an event becomes a one-bar event.
Alerts are attention markers. They are not trade instructions, entry rules, or automated execution logic.
🧩 Confluence Logic
The strongest context appears when relative volume, spread quality, close location, next-bar progress, follow-through closes, and trend-side bias align.
When the event has strong participation but weak progress, the planner reduces the follow-through score instead of treating volume alone as enough.
📊 When to Use
• After noticeable participation expansion
• During directional continuation attempts
• Around strong candle events that need confirmation from later bars
• On liquid instruments with reliable volume data
• When the main question is whether volume created continuation or only temporary attention
⚠️ When NOT to Use
• Very low-liquidity symbols
• Charts with unreliable or missing volume data
• Extremely noisy micro timeframes
• Markets where one candle can distort volume baselines
• Conditions where the user needs a full volume profile, absorption zone, or climax detector instead
🎛️ Key Inputs
• Sensitivity → controls how demanding the volume event gate is.
• Volume Lookback → defines the baseline used for relative volume.
• Minimum Planner Score → sets the FT READY threshold.
• Follow-Through Window → controls how many bars are used for early review.
• Risk Rail Buffer → adjusts the invalidation reference behind the event candle.
• Target Guide ATR → controls the projected target-room guide.
• Cooldown Bars → limits repeated events around the same move.
• Visual settings → control labels, optional target-review labels, boxes, guide lines, panel location, panel theme, and font sizes.
🖥️ Interface & Visual Design
The panel is designed as a compact planning cockpit rather than a data dump.
The first row uses the AGPro blue merged header style, while the rows below focus only on the decision fields needed for fast interpretation.
The chart visuals are intentionally moderate: enough labels to make the chart feel active, but controlled by cooldown, maximum visible objects, and spacing settings.
🧪 Practical Usage Workflow
1. Read the panel and check whether a volume event is active.
2. Inspect the follow-through box and risk rail.
3. Watch whether price progresses beyond the event close or fades back toward the rail.
4. Use the Follow-Through score and Action row as context for further review.
5. Confirm the broader market structure, volatility, and liquidity environment separately.
🔍 Interpretation Guidelines
Think of the first volume event as a question, not an answer.
Strong follow-through means the event received continuation support. Weak follow-through means volume did not yet translate into useful directional progress. A failed event means the risk rail was broken and the original event context should be rejected.
The score is a planning aid. It should be interpreted with market structure, higher-timeframe context, and risk controls.
🚫 What This Script Is NOT
• Not a prediction engine
• Not financial advice
• Not auto trading
• Not guaranteed signals
• Not a volume climax detector
• Not an absorption zone map
• Not a generic support/resistance tool
⚠️ Limitations & Transparency
Volume quality depends on the chart symbol and exchange feed.
Timeframe changes can materially alter event frequency, volume baselines, and follow-through behavior.
Extreme volatility can make the risk rail or target-room guide less stable.
The script is rule-based and cannot understand news, liquidation cascades, macro events, or hidden order flow.
🧠 Market Context Notes
High volume is most useful when later candles confirm that participation had directional effect.
If price cannot progress after the event, the volume may represent temporary effort, late participation, absorption-like behavior, or simple noise.
This script focuses on that after-event evaluation.
🧾 Use Case Examples
When a strong bullish volume event appears and later candles close above the event close, the follow-through score can improve toward FT READY.
When a bearish volume event appears but price immediately reclaims the event area and breaks the rail, the state can shift to FAILED.
When volume expands but price stays trapped near the event close, the state can become ONE-BAR EVENT.
🧱 System Philosophy
The AGPro planner style is built around decision quality.
A chart tool should not only show what happened. It should help the user evaluate validity, strength, risk, target room, and the next state to monitor.
🔐 Non-Promise Statement
No script can provide certainty.
No signal, state, score, label, or alert guarantees a future outcome.
📉 Risk Disclosure
Trading involves risk.
Users are responsible for their own analysis, execution, risk management, and decisions.
This script is for educational and analytical purposes only and does not provide financial advice.
📚 Educational Note
Use the planner to study how volume events behave after they appear. The most important information is often not the event itself, but whether later candles confirm, weaken, or invalidate it.
Indicator

Stop Run Continuation Planner [AGPro Series]Stop Run Continuation Planner
🧠 Core Idea
Did the stop run fuel continuation instead of reversal?
📌 Overview / What it does
Stop Run Continuation Planner is a chart-first liquidity continuation tool built around a specific post-sweep question: after price runs stops beyond a recent high or low, is the market reclaiming back inside for reversal, or accepting beyond the swept edge for continuation?
The script maps stop-run zones, continuation references, invalidation edges, target corridors, compact state labels, alerts, a 0-100 Continuation Score, and a Reversal Risk reading. It is designed to organize observable stop-run behavior into a structured planning workflow.
It does not predict future price, automate execution, or issue buy and sell commands. It is an analytical and visualization tool built for structured review.
🎯 Purpose & Design Philosophy
This script was built for the cases where a stop run does not turn into a reversal. Many liquidity tools focus on the sweep itself. This script focuses on what happens after the sweep.
The design supports a planner mindset: identify the stop run, measure continuation acceptance, locate invalidation, estimate target room, judge reversal risk, and decide what deserves attention next.
⚡ Why This Script Is Different
Most stop-run tools focus on reversal reclaim behavior, generic liquidity grabs, or broad SMC-style mapping.
This script does NOT treat every sweep as a reversal event.
Instead, it evaluates whether price is accepting beyond the swept edge with enough quality, target room, and controlled reversal risk to justify a continuation review.
⚙ Methodology
1. Context Detection
Recent high and low references are defined with a configurable lookback.
2. Reference Mapping
When price sweeps beyond a reference, the script maps the swept edge, continuation side, invalidation edge, and forward target corridor.
3. Reaction Evaluation
Continuation Score blends sweep depth, close acceptance, volume participation, trend-side support, and target room. Reversal Risk tracks rejection, weak acceptance, and context conflict.
4. Visual Output
Qualified states produce stop-run boxes, target corridors, compact labels, alerts, and a clean AG Pro panel.
🗺 How to Read the Chart
Zones = the active stop-run area between the swept reference and the sweep extreme.
Corridors = the forward review area used for target room assessment.
Labels = watch or continuation state markers.
Colors = teal for bullish continuation context, pink for bearish continuation context, and red for invalidation pressure.
Panel = Stop Run, Continuation Score, Reversal Risk, Target Room, and Action.
🚦 Signals & States
• Upper Run Watch → price swept a recent high, but continuation acceptance still needs confirmation.
• Lower Run Watch → price swept a recent low, but continuation acceptance still needs confirmation.
• Bull Continuation Ready → bullish post-sweep continuation quality is strong enough for review.
• Bear Continuation Ready → bearish post-sweep continuation quality is strong enough for review.
• Invalidation Review → price has moved through the active invalidation edge.
• Target Review → price is testing the active target corridor.
• Reversal Risk Elevated → rejection risk is growing and continuation quality is weakening.
🔔 Alerts Logic
Alerts trigger when bullish or bearish continuation reaches ready state, when a watch condition appears, when invalidation review is triggered, when price tests the target corridor, or when reversal risk becomes elevated.
Important: alerts are attention markers, not trade instructions.
🧩 Confluence Logic
When sweep depth, close acceptance, volume participation, trend support, and clean target room align, the continuation context becomes stronger.
When price closes back inside the swept edge or rejection grows, Reversal Risk rises and the continuation plan weakens.
📊 When to Use
• After price runs above recent highs or below recent lows
• During breakout continuation attempts after a liquidity sweep
• In trending or expanding markets
• When traders need risk, target, and next-action context after a fast sweep event
⚠️ When NOT to Use
• Extremely low-liquidity markets
• Very noisy micro-timeframes
• News-driven candles with abnormal spread or slippage
• Markets where volume data is unreliable
• Situations where the user expects automated entries or guaranteed outcomes
🎛️ Key Inputs
• Continuation Side → evaluates bullish events, bearish events, or both
• Sensitivity → changes how strict the continuation requirements are
• Stop-Run Reference Lookback → defines the sweep reference levels
• Confirmation Mode → changes how much confirmation is required
• Minimum Continuation Score → sets the ready threshold
• Watch Score → controls earlier watch-state visibility
• Invalidation Edge Buffer → adjusts the wrong-side planning edge
• Target Corridor R Multiple → controls target-corridor projection
• Visual settings → control zones, labels, font size, panel location, and render limits
🖥️ Interface & Visual Design
The script is chart-first and decision-focused. The chart carries the zones, corridors, and labels. The panel provides a compact state summary without turning the script into a crowded dashboard.
The first panel row follows the AGPro standard: one merged blue header row containing only the script name.
🧪 Practical Usage Workflow
1. Read the panel state and Continuation Score.
2. Check whether price swept above a recent high or below a recent low.
3. Review whether price is accepting beyond the swept edge.
4. Compare Reversal Risk with the invalidation edge.
5. Review target room before treating continuation as stronger context.
🔍 Interpretation Guidelines
A high Continuation Score means the stop run is showing stronger continuation behavior under the script rules. It does not mean continuation must happen.
The invalidation edge and target corridor are planning references, not guaranteed levels.
The best use is to compare the planner state with broader market structure, liquidity, volatility, and personal risk process.
🚫 What This Script Is NOT
• Not a prediction engine
• Not financial advice
• Not auto trading
• Not guaranteed signals
• Not a generic support/resistance map
• Not an order-block or FVG scanner
• Not a stop-run reversal tool
⚠️ Limitations & Transparency
Stop-run behavior changes across symbols, sessions, and timeframes.
High volatility can widen risk and target references.
Low liquidity can distort sweep quality, volume response, and label timing.
No rule-based script can fully account for news, spread changes, slippage, or sudden liquidity shifts.
🧠 Market Context Notes
Stop runs often happen near visible highs, lows, session extremes, or recent structure.
A sweep becomes more useful for continuation planning when the market accepts beyond the swept edge instead of reclaiming back inside.
🧾 Use Case Examples
When price sweeps above a recent high, closes beyond the swept edge, and the Continuation Score improves, the planner may show bullish continuation readiness.
When price sweeps below a recent low and continues accepting below that edge, the planner may show bearish continuation readiness.
When price sweeps but closes back inside with stronger rejection, Reversal Risk can rise and the panel may shift to caution.
🧱 System Philosophy
AGProLabs tools are built around structured interpretation. The goal is not to add another raw signal. The goal is to turn market behavior into a cleaner review process with score, state, risk, target, and next action.
🔐 Non-Promise Statement
No indicator can remove uncertainty.
No score can guarantee continuation.
No zone, label, panel row, alert, or corridor should be interpreted as a guaranteed outcome.
📉 Risk Disclosure
Trading involves risk.
This script is provided for educational and analytical use only.
It does not provide financial advice or guaranteed trading outcomes.
Users remain responsible for their own analysis, risk management, and execution.
Indicator

Opening Pullback Planner [AGPro Series]Opening Pullback Planner
🧠 Core Idea
Is the first pullback after the open constructive, failing, or too stale to plan around?
📌 Overview / What it does
Opening Pullback Planner is a session pullback decision tool built around the first meaningful retracement after the opening drive. Instead of treating the open as only a breakout moment, it waits for the drive reference to lock, then maps the pullback area where continuation quality can be evaluated.
The script produces an opening pullback box, continuation trigger, failure line, target-room guide, 0-100 continuation score, risk-edge reading, compact event labels, alerts, and a clean AG Pro planning panel.
It does not predict price direction, automate trades, or mark every opening range breakout. Its purpose is to organize the pullback phase after the opening drive so traders can judge whether the first reset is constructive, failing, invalidated, or no longer worth attention.
🎯 Purpose & Design Philosophy
Many session tools focus on the first opening break, the opening range, or the first impulse. The problem is that a strong open often becomes difficult to plan only after price pulls back.
Opening Pullback Planner was built to fill that gap. It helps traders who study intraday continuation, first-pullback behavior, session execution, and risk-defined planning after the initial move.
The design philosophy is simple: lock the opening drive, map the first pullback box, evaluate recovery quality, define the failure line, and keep the next action readable without turning the chart into a crowded signal board.
⚡ Why This Script Is Different
Most tools focus on opening range breakouts, first-drive strength, fixed session boxes, or generic pullback signals.
This script does NOT clone Opening Drive Quality, does NOT act as an ORB breakout tool, and does NOT draw generic support/resistance zones.
Instead, it focuses on the first pullback after the opening drive. It asks whether the pullback is deep enough to matter, shallow enough to preserve structure, recovering with acceptable close quality, holding a measurable failure line, and offering enough target room for continued review.
⚙️ Methodology
1. Context Detection
The script builds an opening reference from either a fixed session window or the first bars of the day. This creates the drive structure that the pullback plan will use.
2. Reference Mapping
After the opening reference locks, the script maps a drive-native pullback box, continuation trigger, failure line, and target-room guide.
3. Reaction Evaluation
The engine evaluates pullback depth, close recovery, relative volume, volatility fit, room-to-risk, and drive quality to create a 0-100 continuation score.
4. Visual Output
The chart shows the pullback box with centered text, continuation and failure references, target-room guide, compact event labels, optional markers, and the AG Pro panel.
🗺️ How to Read the Chart
Opening Pullback Box = the first pullback review area derived from the locked opening drive.
Continuation Trigger = the level price must reclaim or break after the pullback for continuation context to strengthen.
Failure Line = the invalidation reference where the active pullback plan loses structural integrity.
Target Guide = a projected target-room reference based on the opening drive range.
Labels = event markers for drive retain, pullback test, constructive recovery, trigger readiness, pullback risk, failure line, stale plan, and target check.
Colors = teal for bullish continuation context, pink for bearish or invalid context, amber for caution, and indigo for structural emphasis.
Panel = the decision layer showing Pullback State, Drive Side, Continuation Score, Risk Edge, and Action.
🚦 Signals & States
• DRIVE RETAIN → the opening drive quality is strong enough to map a pullback plan.
• PULLBACK TEST → price has entered the opening pullback box.
• CONSTRUCTIVE → pullback depth and recovery quality are acceptable inside the model.
• TRIGGER READY → price has moved through the continuation trigger after a valid pullback.
• PULLBACK RISK → the pullback is becoming too deep, slow, or weak for clean continuation review.
• FAILURE LINE → the active pullback plan has lost structural integrity.
• PULLBACK STALE → the first pullback plan did not resolve inside the review window.
• TARGET CHECK → price reached the projected target-room guide.
🔔 Alerts Logic
The script includes alerts for:
• Opening Pullback Plan Armed → a qualified opening drive mapped the first pullback plan.
• Opening Pullback Test → price is testing the pullback box.
• Constructive Opening Pullback → the pullback is recovering constructively.
• Opening Pullback Continuation Trigger → the continuation trigger is active after the pullback.
• Opening Pullback Failure Line Broken → the plan has broken its failure reference.
• Opening Pullback Plan Expired → the first pullback plan became stale before confirmation.
• Opening Pullback Target Check → price reached the target-room guide.
Alerts are attention markers. They are not trade instructions.
🧩 Confluence Logic
The context becomes stronger when the opening drive has acceptable quality, the first pullback reaches the planned box without violating the failure line, recovery closes improve, volume does not collapse during recovery, and target room remains clean.
The context becomes weaker when the pullback is too deep, recovery is poor, the plan takes too long to resolve, or price violates the failure line.
📊 When to Use
• Intraday session planning after the opening move.
• First-pullback continuation review.
• Daily chart review when the higher-timeframe fallback is enabled.
• Markets where the opening drive often creates a useful early reference.
• Stocks, indices, futures, crypto, or FX charts where the selected opening session is meaningful.
• Review workflows where risk edge and target room need to be visible.
⚠️ When NOT to Use
• Very low-liquidity markets.
• Extremely noisy opens with unstable spreads.
• News-driven bars that distort the opening reference.
• Higher timeframes where session pullback structure is not meaningful.
• Markets where the selected opening window does not represent real participation.
🎛️ Key Inputs
• Opening Reference Mode → chooses between a fixed session window and first bars of day.
• Opening Drive Window → defines the drive reference used before pullback mapping begins.
• Higher Timeframe Fallback → keeps daily, weekly, and monthly charts visually useful by mapping broader opening references.
• Sensitivity → adjusts how strict the planner is with pullback recovery and score requirements.
• Constructive Score Threshold → controls when constructive pullback labels can appear.
• Pullback Box Shallow / Ideal / Deep → define the preferred retracement area.
• Continuation Trigger Buffer ATR → adjusts the trigger line beyond the drive extreme.
• Failure Line Buffer ATR → adjusts the invalidation reference beyond the pullback box.
• Target Guide Range Multiple → controls the projected target-room guide.
• Visual settings → control box, lines, labels, markers, projection, label limits, and font size.
• Panel settings → control panel visibility, location, theme, and font size.
🖥️ Interface & Visual Design
The interface is chart-first and decision-focused. The main visual object is one opening pullback box with centered state text, supported by a continuation trigger, failure line, and target guide.
The panel follows the AGPro public-release standard with one merged blue header row containing only the script name. The five panel rows are Pullback State, Drive Side, Continuation Score, Risk Edge, and Action.
Labels are compact, capped, and offset away from candles so the chart stays active without becoming crowded.
🧪 Practical Usage Workflow
1. Let the opening reference lock.
2. Read the panel to see whether the drive retained enough quality.
3. Watch whether price tests the opening pullback box.
4. Evaluate the continuation score, recovery state, risk edge, and failure line.
5. Treat alerts and labels as review prompts, not instructions.
🔍 Interpretation Guidelines
A strong continuation score means the pullback is controlled, recovering cleanly, preserving the failure line, and keeping useful room to the projected target guide.
A constructive label means the first pullback is behaving better inside the model. It does not mean continuation must occur.
A failure-line label means the plan has lost the structure it needed for this specific pullback framework.
The best use comes from combining the panel state with broader market context, liquidity, volatility, higher-timeframe structure, and personal risk rules.
🚫 What This Script Is NOT
• Not a prediction engine.
• Not financial advice.
• Not auto trading.
• Not guaranteed signals.
• Not a generic support/resistance map.
• Not an order block or FVG scanner.
• Not an Opening Drive Quality clone.
• Not a full opening range breakout system.
⚠️ Limitations & Transparency
Timeframe selection affects the opening reference and the pullback box. A 5-minute chart and a 15-minute chart can produce different plans.
Session definitions matter. The selected opening window should match the asset and market being studied.
Higher-timeframe fallback mode is a broader chart-reference layer. It should be read as a weekly, monthly, or yearly opening-pullback framework rather than a literal intraday open.
Volatility changes can expand or compress risk, target, and pullback behavior.
Low liquidity, abnormal spreads, and high-impact news can reduce the usefulness of any opening pullback model.
🧠 Market Context Notes
The first pullback after the open can be useful because it tests whether the opening move still has sponsorship. A shallow pullback may show strength but offer limited risk clarity. A deep pullback may offer a better reset but also higher failure risk.
This script keeps that decision visible by separating drive retention, pullback quality, continuation trigger, failure line, and target room.
🧾 Use Case Examples
When price locks a bullish opening drive, pulls back into the mapped box, holds above the failure line, and recovers toward the continuation trigger, the panel may shift toward a constructive or ready state.
When price enters the pullback box but keeps closing weakly or pushes beyond the deep boundary, the planner may mark pullback risk.
When price breaks the failure line, the opening pullback plan is no longer structurally intact inside this model.
🧱 System Philosophy
Opening Pullback Planner follows the AGPro Series decision-engine approach: a script should help the trader evaluate validity, strength, risk, target room, and next action instead of only printing another signal.
The tool is built to make one session behavior easier to read: the first pullback after the opening drive.
🔐 Non-Promise Statement
No script can provide certainty.
No opening pullback model can guarantee continuation, reversal, or profitability.
This script provides structured context only.
📉 Risk Disclosure
Trading involves risk.
Users are responsible for their own decisions.
This script does not provide financial advice, investment advice, or guaranteed trading outcomes.
📚 Educational Note
Use this script as an educational planning and visualization tool. The strongest use comes from reading the first opening pullback together with broader market structure, liquidity, volatility, and personal risk rules.
Indicator

Pullback Acceptance Planner [AGPro Series]Pullback Acceptance Planner
🧠 Core Idea
Is the current trend pullback being accepted as continuation, or rejected as failure?
📌 Overview / What it does
Pullback Acceptance Planner is a public-free TradingView planner built to evaluate one specific decision point: the moment price pulls back into a trend-support area and the trader needs to know whether the retracement is being accepted or rejected.
The script maps a live pullback acceptance pocket, accepted/rejected state labels, an invalidation risk shelf, a target-room band, and a clean AGPro decision panel. It converts pullback depth, close acceptance, trend support, volume behavior, invalidation distance, and target room into a 0-100 Acceptance Score.
It does not predict price direction, automate entries, or label every small retracement. Its purpose is to make the pullback review process cleaner, more visual, and more decision-focused.
🎯 Purpose & Design Philosophy
This script was built because many pullback tools stop at showing where price touched a moving average, trend line, or generic zone. That is not enough for a trader who needs to decide whether the pullback is still constructive.
Pullback Acceptance Planner fills that gap by focusing on acceptance behavior after the pullback reaches the planning pocket. It helps traders review trend-side support, close quality, participation, risk distance, and remaining room in one structured view.
The mindset is practical: do not chase every pullback, and do not treat every retracement as a signal. Wait for the pullback to show whether it is being accepted or rejected.
⚡ Why This Script Is Different
Most pullback tools focus on moving-average touches, simple continuation markers, or generic trend-risk labels.
This script does NOT clone Low Volume Pullback Zones, Trend Pullback Risk Planner, Opening Drive Quality, SuperTrend pullback tools, or broad continuation dashboards.
Instead, it answers a narrower question: after price enters a general trend pullback pocket, is the close behavior strong enough to call the pullback accepted, or is the invalidation shelf being lost?
That acceptance-first framing is the core identity of the script.
⚙️ Methodology
1. Context Detection
The engine reads EMA stack alignment, base EMA slope, ATR structure, and the selected planning side to determine whether a bullish or bearish pullback context is active.
2. Reference Mapping
The script builds a pullback acceptance pocket around the base EMA, then maps an invalidation risk shelf behind the pocket and a target-room band toward the nearest prior obstruction.
3. Reaction Evaluation
The 0-100 Acceptance Score evaluates pullback depth, close acceptance beyond the pocket edge, trend support, volume behavior, invalidation distance, and target room.
4. Visual Output
The chart displays the acceptance pocket, risk shelf, target-room band, compact state labels, alerts, and a five-row AGPro planner panel.
🗺️ How to Read the Chart
Zones = the pullback acceptance pocket, invalidation risk shelf, and target-room band.
Labels = current state changes such as PB ACCEPTED, PB REJECTED, ACCEPT WATCH, ROOM REVIEW, or PB FORMING.
Colors = bullish acceptance uses teal, bearish acceptance uses pink, watch/room review uses yellow or indigo, and rejection uses red.
Panel = the decision summary: Pullback State, Acceptance Score, Risk Edge, Room, and Action.
🚦 Signals & States
• PB ACCEPTED → price closed beyond the active pullback pocket with enough score quality.
• ACCEPT WATCH → pullback context is improving but still needs cleaner confirmation.
• ROOM REVIEW → acceptance quality exists, but nearby obstruction leaves limited target room.
• PB FORMING → price is inside or near the pocket and the planner is still building context.
• PB REJECTED → price crossed the invalidation shelf and the active pullback context failed.
• TREND WAIT / NO PULLBACK → there is no active pullback acceptance context to review.
🔔 Alerts Logic
Alerts trigger when a bullish or bearish pullback reaches accepted state, when acceptance watch appears, when target room needs review, when the pullback is rejected, or when a major follow-through event appears after acceptance.
Alerts are attention markers. They are not trade instructions.
🧩 Confluence Logic
The context becomes stronger when trend side, clean pullback depth, constructive close acceptance, controlled or recovering volume, reasonable invalidation distance, and sufficient target room align at the same time.
The score is intentionally multi-factor so a single moving-average touch cannot create a high-quality state by itself.
📊 When to Use
• Trending markets with clean retracements
• Swing or intraday continuation review
• Markets where pullback behavior matters more than raw trend direction
• Crypto, forex, stocks, indices, and commodities with enough liquidity
• Situations where a trader wants an invalidation reference and target-room read before acting
⚠️ When NOT to Use
• Very low-liquidity symbols
• Extremely noisy sideways chop
• News-driven spikes where ATR and trend structure distort quickly
• Ultra-low timeframes with unstable spread or poor execution quality
• Markets where price repeatedly crosses the base EMA without directional structure
🎛️ Key Inputs
• Planning Side → chooses Auto, Bullish Pullback, or Bearish Pullback.
• Sensitivity → changes trend strictness and scoring behavior.
• EMA Lengths → define the trend stack and acceptance pocket anchor.
• ATR Length → normalizes pocket width, labels, risk shelf, and target room.
• Pullback Review Window → controls how long a pocket touch remains active.
• ACCEPTED Threshold → sets the minimum score for accepted-state labels.
• Label / Panel Settings → control visibility, location, theme, font size, label size, and label density.
🖥️ Interface & Visual Design
The interface is chart-first. The main chart objects are the acceptance pocket, risk shelf, and target-room band, each with centered text when displayed.
The panel uses the AGPro standard: one merged blue header row containing only the script name, followed by five decision rows. The layout is intentionally compact so the chart stays premium, readable, and useful on first glance.
🧪 Practical Usage Workflow
1. Read the panel to identify Pullback State and Acceptance Score.
2. Check whether price is inside, above, or below the acceptance pocket.
3. Review the invalidation risk shelf before interpreting an accepted state.
4. Check the target-room band to see whether the path is open or obstructed.
5. Treat labels and alerts as review markers, not automatic trade decisions.
🔍 Interpretation Guidelines
A higher score means the pullback has cleaner depth, stronger close behavior, better trend support, healthier volume behavior, more reasonable invalidation distance, and better room.
An accepted label means the pullback has met the script's rule-based acceptance conditions. It does not mean price must continue.
A rejected label means the pullback context failed according to the invalidation shelf. It does not mean the market must reverse.
🚫 What This Script Is NOT
• Not a prediction engine
• Not financial advice
• Not auto trading
• Not guaranteed signals
• Not a generic support/resistance zone tool
• Not an order block, FVG, or broad SMC map
⚠️ Limitations & Transparency
• Timeframe differences can change how clean the pocket and score appear.
• Volatility expansion can widen risk and distort close acceptance.
• Low-liquidity markets can make volume behavior less reliable.
• Strong news candles can cross both pocket and target references too quickly.
• The script uses rule-based approximations, not future knowledge.
🧠 Market Context Notes
Pullback acceptance often depends on whether price can return toward trend support without losing structure. A constructive pullback usually keeps risk contained, avoids aggressive countertrend volume, and then shows acceptance through the pocket edge.
This script turns that process into a visual planner so the user can review risk, room, and state in one place.
🧾 Use Case Examples
When a bullish trend pulls back into the acceptance pocket, the script may print ACCEPT WATCH first. If price later closes above the pocket edge with enough score quality, the state can shift to PB ACCEPTED.
When a bearish trend rallies into the pocket but then closes back below the acceptance edge, the script can mark bearish acceptance. If price crosses the invalidation shelf instead, the state shifts toward rejection.
🧱 System Philosophy
Pullback Acceptance Planner follows the AGPro planner-style direction: the chart should not only show another signal. It should help the trader evaluate setup validity, strength, risk, target room, and next action.
🔐 Non-Promise Statement
No script can provide certainty.
No score can guarantee outcome.
This tool is designed for structured review and educational analysis.
📉 Risk Disclosure
Trading involves risk. Market conditions can change quickly, and historical or rule-based signals do not guarantee future results.
Users are responsible for their own analysis, risk management, and decisions.
This script does not provide financial advice.
📚 Educational Note
Use the script to study how pullbacks behave around trend support, invalidation shelves, and target-room constraints. The best value comes from comparing the planner state with broader market context.
Indicator

Momentum Pullback Continuation [AGPro Series]Momentum Pullback Continuation
🧠 Core Idea
Is a momentum pullback resetting cleanly for continuation, or is the move losing its execution quality?
📌 Overview / What it does
Momentum Pullback Continuation is a chart-first continuation planner built for traders who review momentum-driven trends after a controlled pullback.
The script maps a momentum reset pocket, continuation trigger line, invalidation rail, target-room corridor, state labels, alerts, and a clean AGPro planning panel. It converts trend support, momentum slope, pullback depth, close recovery, volume behavior, and target room into a 0-100 Continuation Score.
The default publication preset is 1H-focused. Higher timeframes can be tested from the inputs, but the strongest intended use case is hourly momentum pullback review.
It does not predict price, automate entries, or turn every trend pullback into a signal. It is a structured decision tool for evaluating whether the current momentum reset deserves closer review.
🎯 Purpose & Design Philosophy
This script was built to fill the gap between basic momentum readings and practical continuation planning.
Many traders can see that momentum exists, but the harder question is whether the pullback is resetting in a controlled way or damaging the continuation structure. This planner focuses on that decision layer.
The design supports a disciplined workflow: identify the active momentum side, inspect the reset pocket, evaluate the score, locate the invalidation rail, compare target room, and read the next-action state.
⚡ Why This Script Is Different
Most tools focus on momentum oscillators, moving-average direction, divergence events, or generic continuation labels.
This script does NOT clone Hidden Divergence Continuation Zones, Trend Continuation Quality, Structural Momentum Oscillator, ROC Momentum Shift Map, or a generic pullback signal map.
Instead, it treats the pullback as a planning event. The main output is not a buy/sell marker. It is a momentum reset decision state with score, risk edge, target-room context, and action guidance.
⚙️ Methodology
1. Context Detection
The script identifies bullish or bearish momentum context using an EMA stack, normalized trend slope, and smoothed rate-of-change pressure.
2. Reference Mapping
It builds a concept-native Momentum Reset Pocket around the active trend support area, then maps a continuation trigger line, invalidation rail, and target-room guide.
3. Reaction Evaluation
The score model evaluates momentum slope, pullback depth, trend support, close recovery, volume behavior, and available target room.
4. Visual Output
The chart shows the reset pocket, target-room corridor, trigger and risk guides, compact event labels, sparse context labels, alerts, and a premium AGPro panel.
🗺️ How to Read the Chart
Reset Pocket = the area where a momentum pullback is expected to stabilize before continuation can be reviewed.
Trigger Line = the fast continuation reference that price needs to recover after the reset.
Invalidation Rail = the planning line where the active reset context is considered lost.
Target-Room Corridor = the forward planning area between current price and the target-room guide.
Labels = RESET, WATCH, READY, WEAK, and INVALID attention markers.
Colors = teal marks bullish continuation context, pink marks bearish continuation context, amber marks weak or caution states, indigo marks watch/target-room context, and red marks invalidation.
Panel = summarizes Momentum State, Pullback Quality, Continuation Score, Risk Edge, and Action.
🚦 Signals & States
• RESET → price has interacted with the momentum reset pocket.
• WATCH → the reset is developing, but recovery or score quality is not complete.
• READY → momentum, pullback depth, recovery, volume context, and target room align strongly enough for structured review.
• WEAK → the pullback is too deep, low quality, or not recovering well enough.
• INVALID → price has crossed the invalidation rail and the active reset context should be rebuilt.
🔔 Alerts Logic
Alerts trigger when READY, WATCH, WEAK RESET, or INVALID states appear.
Each alert is an attention marker tied to the rule-based state engine. Alerts are not trade instructions and do not guarantee that continuation will occur.
🧩 Confluence Logic
The continuation context becomes stronger when trend support, positive momentum slope, controlled pullback depth, clean close recovery, acceptable volume behavior, and target-room availability align.
The script intentionally requires multiple conditions instead of labeling every pullback inside a trend as meaningful.
📊 When to Use
• Directional markets with visible momentum pressure
• 1H charts and nearby intraday momentum review
• Trend continuation review workflows
• Pullbacks after a clear momentum impulse
• Situations where risk edge and target room matter before acting
• Markets where volume and close behavior are readable enough to support context
⚠️ When NOT to Use
• Low-liquidity symbols with unreliable candles or volume
• Extremely choppy markets with frequent trend-side flips
• News-driven volatility where reset structure changes too quickly
• Very flat markets where momentum pressure is absent
• Instruments where the active pullback is far beyond the mapped risk edge
🎛️ Key Inputs
• Continuation Side → selects Auto, Bullish Only, or Bearish Only evaluation.
• Timeframe Profile → keeps the default script behavior focused on 1H charts, with optional broader intraday or all-timeframe testing.
• Sensitivity → adjusts how strict the momentum reset model is.
• EMA settings → define trigger, reset, and support references.
• Momentum ROC settings → control the internal momentum pressure reading.
• Reset Pocket Width → changes how wide the reset area is around trend support.
• READY / WATCH Score → sets state thresholds.
• Visual settings → control zones, guide lines, labels, panel theme, panel location, and font sizes.
🖥️ Interface & Visual Design
The interface is designed to stay chart-first and practical.
The reset pocket and target-room corridor provide the main visual planning structure. Labels are compact and spaced with cooldown controls. The AGPro panel uses a single merged blue header row and focuses only on the core decision fields.
🧪 Practical Usage Workflow
1. Read the panel Momentum State.
2. Check whether price is interacting with the Momentum Reset Pocket.
3. Compare Pullback Quality and Continuation Score.
4. Locate the Risk Edge and Target-Room Corridor.
5. Use the Action row to decide whether the context is READY, still WATCH, weak, invalid, or only worth scanning.
🔍 Interpretation Guidelines
Think of the script as a continuation readiness map, not a command system.
A higher score means the active momentum pullback matches the script's internal definition of cleaner continuation structure. A lower score means one or more components are missing, such as trend support, recovery quality, volume context, or target room.
The invalidation rail is a planning boundary for the active context. It is not a guaranteed stop level and should not replace the user's own risk process.
🚫 What This Script Is NOT
This script is not a prediction engine.
This script is not financial advice.
This script is not an auto-trading system.
This script does not provide guaranteed signals.
This script does not replace independent confirmation, position sizing, or risk management.
⚠️ Limitations & Transparency
Momentum continuation behavior changes across symbols, sessions, and timeframes.
The default 1H Focus profile intentionally suppresses active labels, zones, and alerts outside the intended hourly review window.
Low-liquidity markets can distort volume behavior and reset quality.
High volatility can widen risk edges and reduce target-room clarity.
Sideways conditions can create repeated resets without clean continuation.
No rule-based script can fully account for sudden news, spread changes, slippage, or discretionary execution constraints.
🧠 Market Context Notes
Momentum pullbacks are often more useful when the broader trend remains intact, the pullback is controlled rather than impulsive against trend, and the recovery candle shows clear close quality.
The best reads usually come from alignment between structure, momentum, volume, volatility, and clean forward room.
🧾 Use Case Examples
When price pulls into the reset pocket during bullish momentum and then recovers the trigger line with a stronger score, the script can mark READY for continuation review.
When price enters the pocket but momentum slope fades and pullback depth becomes excessive, the script can mark WEAK RESET.
When price crosses the invalidation rail, the active reset context is treated as lost and should be rebuilt.
🧱 System Philosophy
AGPro tools are built around structured interpretation.
The goal is not to create more chart noise. The goal is to turn visible market behavior into a cleaner decision framework: context, quality, risk, target room, and next action.
🔐 Non-Promise Statement
No script can provide certainty.
No score guarantees continuation.
The output should be interpreted as structured context, not as a promise of future price movement.
📉 Risk Disclosure
Trading involves risk.
Users are responsible for their own analysis, confirmation, position sizing, and decisions.
This script is for educational and analytical use only and does not provide financial advice.
📚 Educational Note
Use the planner to study how momentum resets behave across different symbols and timeframes. Over time, compare READY, WATCH, WEAK RESET, and INVALID states to understand which environments produce cleaner continuation structure.
Indicator

Continuation Acceptance Planner [AGPro Series]Continuation Acceptance Planner
🧠 Core Idea
Is this continuation setup being accepted, delayed, or invalidated before the next decision point?
📌 Overview / What it does
Continuation Acceptance Planner is a chart-first continuation planning tool built to evaluate whether a pullback inside an active trend is producing real acceptance or only temporary hesitation.
The script builds a live continuation acceptance band around a trend base, scores the context from 0 to 100, maps the invalidation rail, checks target room against the nearest obstruction, and prints compact state labels such as ACCEPTED, DELAYED, PAUSED, WATCH, and INVALID.
It does not predict future price movement, automate entries, or produce guaranteed trade signals. Its role is to organize continuation context into a cleaner decision framework.
🎯 Purpose & Design Philosophy
This script was built for traders who want to judge continuation quality without turning every trend pullback into a signal.
Most continuation tools focus on bounce detection or trend strength only. This planner focuses on the decision layer: acceptance quality, pullback risk, target room, invalidation context, and the next action state.
The design supports a patient execution mindset. It helps the user ask whether the continuation is actually being accepted, still delayed, temporarily paused, too extended, or losing validity.
⚡ Why This Script Is Different
Most tools focus on generic trend continuation signals after a moving average touch or pullback bounce.
This script does NOT act as a simple buy/sell continuation indicator, and it does not clone a broad trend-continuation quality scanner.
Instead, it treats continuation as a planning problem: price must interact with an acceptance band, show a quality close, maintain enough room before obstruction, and stay above or below a clear invalidation rail.
⚙️ Methodology
1. Context Detection
The script identifies bullish or bearish continuation context using fast, base, and slow EMA alignment plus trend slope.
2. Reference Mapping
It creates a continuation acceptance band around the base EMA and maps the invalidation rail using the band edge, slow EMA, and ATR buffer.
3. Reaction Evaluation
It evaluates pullback depth, close acceptance, volume support, and whether price is delaying, accepting, extending, or moving toward invalidation.
4. Visual Output
The script displays a centered acceptance-band label, invalidation and target guides, compact state labels, and a premium AG Pro planning panel.
🗺️ How to Read the Chart
Zones = the live continuation acceptance band around the trend base.
Labels = accepted, delayed, invalidation, or watch-state markers with optional 0-100 score.
Colors = bullish continuation context uses teal, bearish continuation context uses pink, delayed context uses amber, and risk or invalidation context uses red.
Panel = a compact decision dashboard showing Continuation Score, Acceptance, Pullback Risk, Target Room, and Action.
🚦 Signals & States
• ACCEPTED → continuation context has a qualified acceptance close and enough score to review.
• DELAYED → price is interacting with the acceptance band but has not produced enough clean acceptance.
• PAUSED → the prior continuation side still matters, but the trend stack needs to rebuild before the setup becomes clean again.
• WATCH → continuation context exists, but the setup still needs clearer reaction.
• EXTENDED → price is away from the acceptance band and may be late for clean continuation planning.
• INVALID RISK → price is moving beyond the planner's invalidation rail.
🔔 Alerts Logic
Alerts trigger when continuation acceptance, delayed acceptance, invalidation risk, or blocked target room conditions appear.
Alerts are attention markers only. They are not trade instructions and should be interpreted with the broader chart context.
🧩 Confluence Logic
The strongest continuation context appears when trend alignment, controlled pullback depth, close acceptance, volume support, and clean target room align.
When these components align, the continuation score improves and the panel moves toward a clearer planning state.
📊 When to Use
• Primary timeframe: 1H
• Secondary timeframe: 4H
• Trending markets with structured pullbacks
• Continuation setups after a controlled pause
• Pullbacks into a moving trend base
• Situations where target room and invalidation clarity matter
⚠️ When NOT to Use
• When expecting dense signals on 1D or 1W charts
• Very low liquidity environments
• Extremely noisy sideways conditions
• High-volatility shock moves where trend anchors distort quickly
• Markets with no clean trend alignment
🎛️ Key Inputs
• Sensitivity → changes how strict the acceptance engine is.
• Target Obstruction Lookback → defines the prior obstruction used for target-room evaluation.
• Acceptance Band Width ATR → controls the width of the continuation band.
• Confirmation Mode → defines whether acceptance requires close behavior only, close plus volume, or stricter alignment.
• Label and Panel Settings → control visual density, font size, panel location, and theme.
🖥️ Interface & Visual Design
The panel is designed as a compact planning dashboard, not a data-heavy scanner.
The first row follows the AG Pro blue merged-header standard. The remaining rows focus only on the information needed for continuation planning: score, acceptance, pullback risk, target room, and action.
Chart visuals are intentionally controlled so the acceptance band, invalidation rail, target guide, and labels remain readable.
🧪 Practical Usage Workflow
1. Read the panel state.
2. Check whether price is interacting with the acceptance band.
3. Review the continuation score and pullback risk.
4. Compare target room with the invalidation rail.
5. Use labels and alerts as attention markers, not as automatic decisions.
🔍 Interpretation Guidelines
Think in terms of setup quality, not prediction.
A higher score means the current continuation context has stronger alignment across trend, pullback depth, close behavior, volume, and target room.
A delayed state means the idea is not necessarily invalid, but the chart has not yet produced clean acceptance.
A paused state means the prior continuation context is still nearby, but alignment weakened enough that patience matters more than chasing.
An invalidation-risk state means the continuation structure should be reassessed.
🚫 What This Script Is NOT
• Not a prediction engine
• Not financial advice
• Not an auto-trading system
• Not a guaranteed signal generator
• Not a generic support/resistance or order-block map
• Not a gap continuation planner or breakout acceptance planner
⚠️ Limitations & Transparency
Timeframe differences can change how continuation bands and target-room references appear.
Volatility expansion can move the acceptance band and invalidation rail quickly.
Low-volume or synthetic symbols may reduce the usefulness of the volume component.
All outputs are rule-based and should be interpreted within broader market context.
🧠 Market Context Notes
Continuation planning depends on trend structure, liquidity, volatility, and obstruction distance.
The cleanest cases usually appear when pullbacks are controlled, the acceptance close is clear, and the next obstruction is not too close.
In the current public-release tuning, the script reads cleanest on 1H charts and remains usable on 4H. Daily and weekly charts can still provide context, but they are less expressive for the intended acceptance-versus-delay workflow.
🧾 Use Case Examples
When price pulls back into the acceptance band during a bullish trend and closes back above the base EMA with sufficient target room, the planner may shift toward ACCEPTED.
When price stays inside the band without a clean close, the planner may remain DELAYED.
When price closes beyond the invalidation rail, the planner flags INVALID RISK.
🧱 System Philosophy
The script follows the AGProLabs decision-engine approach: a useful public tool should help traders evaluate validity, strength, risk, target room, and the next action state.
It is built to guide interpretation, not to replace trader judgment.
🔐 Non-Promise Statement
No script can provide certainty.
No output from this script guarantees continuation, reversal, profit, or loss avoidance.
📉 Risk Disclosure
Trading involves risk.
Users are responsible for their own decisions.
This script does not provide financial advice and should be used only as an educational and analytical tool.
📚 Educational Note
Use the planner to study how continuation acceptance develops across different symbols, sessions, volatility regimes, and timeframes.
Indicator

Gap Continuation Planner [AGPro Series]TITLE
Gap Continuation Planner
🧠 Core Idea
Is the active gap being accepted for continuation, or is it losing the structure needed for a clean plan?
📌 Overview / What it does
Gap Continuation Planner is a chart-first gap planning tool built to evaluate what happens after a gap appears. Instead of treating every gap as an automatic fill candidate, it asks whether price is accepting the gap edge, following through away from the gap, and preserving a measurable defense line.
The script produces a gap defense zone, a continuation corridor, an acceptance edge, a defense line, a target guide, compact labels, alerts, and a clean AGPro decision panel. The panel converts the live context into a 0-100 continuation score, fill-risk reading, and next-action state.
It does not predict future price, automate trades, or tell the user to buy or sell. It organizes observable gap behavior into a more disciplined continuation-planning framework.
🎯 Purpose & Design Philosophy
This script was built for traders who do not want to reduce every gap to a simple fill-or-fade idea.
Many gaps initially look strong, but the important question is whether the market continues to accept the gap after the first reaction. Gap Continuation Planner focuses on that middle layer: gap acceptance, follow-through, volatility load, defense quality, fill pressure, and forward room.
The design supports a planner mindset. The goal is to slow the decision process down and review whether the structure is valid enough to deserve attention.
⚡ Why This Script Is Different
Most gap tools focus on gap detection, gap fill percentage, or historical gap zones.
This script does NOT work as a generic gap-fill reaction tool, support/resistance map, imbalance catalog, or automatic signal generator.
Instead, it treats the latest gap as a continuation planning object. The model studies whether price is accepting the continuation side of the gap, whether follow-through is developing, whether the defense line remains intact, whether fill risk is rising, and whether there is enough forward room for the plan to remain clean.
⚙️ Methodology
1. Context Detection
The script detects classic opening gaps, wick gaps, body-separation gaps, and controlled continuation launch windows when adaptive mode is enabled.
2. Reference Mapping
Each accepted gap creates a gap defense zone, an acceptance edge, a defense line, and a target guide.
3. Reaction Evaluation
The engine scores gap size, open acceptance, follow-through, volatility load, fill risk, and forward room.
4. Visual Output
The chart displays a centered gap-zone label, a centered continuation-corridor label, event labels, planner lines, and a compact AGPro panel.
🗺️ How to Read the Chart
Zones = the detected gap defense area.
Continuation corridor = the forward planning area between the accepted gap edge and target guide.
Acceptance edge = the side of the gap that price should hold for continuation structure to remain stronger.
Defense line = an ATR-buffered invalidation reference beyond the far side of the gap.
Labels = state changes such as new gap, acceptance watch, continuation ready, defense review, or failed acceptance.
Colors = bullish continuation context uses teal, bearish continuation context uses pink, watch states use indigo, and caution states use amber.
Panel = summarizes gap state, continuation score, defense line, fill risk, and next action.
🚦 Signals & States
• New Gap → a fresh gap continuation window has been detected.
• Acceptance Watch → price is holding the continuation side of the gap, but follow-through still needs confirmation.
• Continuation Ready → the gap has stronger acceptance, follow-through, room, and risk structure.
• Defense Test → price is retesting the gap edge or defense area.
• Fill Risk → the gap is being penetrated enough to reduce continuation quality.
• Gap Failed → the active gap has lost continuation acceptance.
🔔 Alerts Logic
Alerts trigger when a new gap continuation window appears, when the gap reaches READY state, when acceptance watch begins, when defense review becomes relevant, or when gap acceptance is lost.
Alerts are attention markers. They are not trade instructions and do not guarantee that continuation will occur.
🧩 Confluence Logic
The strongest continuation context appears when gap size, gap-edge acceptance, follow-through distance, stable volatility, low fill pressure, and enough forward room align.
When these elements align, the continuation score improves. When fill pressure rises or volatility becomes too hot, the score weakens.
📊 When to Use
• After opening gaps in stocks, indices, futures, or session-based markets
• During continuation attempts after a strong gap
• When reviewing whether a gap is holding acceptance or losing structure
• Around breakout continuation sessions where risk and target references need to be visible
⚠️ When NOT to Use
• Extremely low-liquidity markets
• Very noisy or overlapping session opens
• News-driven gaps with unstable spreads
• Markets where volume and session structure behave unusually
• Environments where price is already far beyond a reasonable risk reference
🎛️ Key Inputs
• Sensitivity → adjusts how strict the gap and score requirements are.
• Gap Mode → controls whether the script reads classic gaps only or adaptive continuation windows.
• Acceptance Bars → changes how many bars must hold the continuation side of the gap.
• Follow-Through ATR → controls the preferred travel away from the gap edge.
• Defense Buffer → sets the ATR spacing for the defense line.
• Forward Room Lookback → helps estimate whether nearby structure limits continuation room.
• Minimum Continuation Score → sets the READY threshold.
• Visual settings → control zones, corridors, lines, labels, object limits, and panel appearance.
• Show Failed / Stale Objects → controls whether old failed corridors remain visible. It is disabled by default for a cleaner publication view.
🖥️ Interface & Visual Design
The interface is built for quick planner-style review. The chart carries the structural map, while the panel provides the decision summary.
The first panel row follows the AGPro merged blue header standard. The remaining rows focus only on the practical planning fields: state, score, defense, fill risk, and action.
The visual hierarchy is intentionally restrained so the gap, corridor, and labels are readable without turning the chart into a crowded signal map.
By default, failed or stale gap objects are hidden after they lose live planning value. Event labels remain available so the chart keeps context without carrying too many old failed boxes.
🧪 Practical Usage Workflow
1. Read the panel state and continuation score.
2. Check whether price is holding the gap acceptance edge.
3. Review the continuation corridor and target guide.
4. Compare fill risk against the defense line.
5. Use alerts as review markers, not execution commands.
6. Confirm the context with broader market structure, liquidity, and personal risk rules.
🔍 Interpretation Guidelines
A high continuation score means the active gap has stronger structure inside this model. It does not mean the move must continue.
Low fill risk supports continuation structure. Rising fill risk means price is starting to challenge the gap.
The defense line is a planning reference. It is not a guaranteed stop level and should not replace the user's own risk process.
Continuation corridors are visual planning areas, not promised target zones.
🚫 What This Script Is NOT
This script is not a prediction engine.
This script is not financial advice.
This script is not an auto-trading system.
This script does not provide guaranteed signals.
This script does not replace independent confirmation, risk management, or execution discipline.
⚠️ Limitations & Transparency
Gap behavior varies heavily across asset classes, sessions, and timeframes.
Adaptive launch windows can help continuous markets, but they should still be interpreted as structured gap-like planning areas rather than classic exchange-session gaps.
High volatility can make defense and target references wider.
Low liquidity can distort gap quality, label timing, and fill-risk readings.
No rule-based script can fully account for news, slippage, spread changes, or sudden liquidity shifts.
🧠 Market Context Notes
Gap continuation is often more meaningful when it aligns with trend pressure, session participation, volatility structure, and clean forward room.
A gap is not important simply because it exists. It becomes more useful when price accepts one side of it and maintains a measurable defense structure.
🧾 Use Case Examples
When price gaps up, holds above the gap edge, and the continuation score improves, the script can help review whether the gap is being defended.
When price gaps down and repeatedly rejects back below the gap edge, the panel can help evaluate bearish continuation structure.
When fill risk rises quickly, the script highlights that the gap may be losing acceptance rather than continuing cleanly.
🧱 System Philosophy
AGProLabs tools are built around structured interpretation. The goal is not to add more signals to the chart. The goal is to turn market behavior into a cleaner review process.
Gap Continuation Planner follows that approach by converting a raw gap into a measurable planning object.
🔐 Non-Promise Statement
No indicator can remove uncertainty.
No score can guarantee continuation.
No planner can replace the trader's responsibility to manage risk.
📉 Risk Disclosure
Trading involves risk.
This script is provided for educational and analytical use only.
It does not provide financial advice, investment advice, trading advice, or guaranteed outcomes.
Users remain responsible for their own decisions, risk management, position sizing, and execution.
📚 Educational Note
The strongest use of this tool is to study whether a gap is being accepted or rejected as structure develops. It is designed to support review, patience, and disciplined interpretation.
Indicator