Premium on BTC in Russia (%)
Indicator shows the relative "premium" or "discount" of buying BTC with Ruble vs the USD on Binance.
Figures are shown in %.
Positive figures indicate a "premium" vs USD, negative indicates a "discount".
Indicator is calculated on the close of the 4h candles of each input.
Crypto

AnyChartI changed few lines of code from TradingView's original Open Interest indicator to make this one. I wanted to compare other charts to while entering my trade like looking at BTC when trading in alts. It has option to view any chart. Add other things to improve your analysis.

Market Hedge RatioRatio of crypto (total, Bitcoin, or Ethereum market cap) to major stable coins.
A low ratio suggests a lot of people are sitting in cash (sidelined if crypto rallies).
A high ratio suggests possible demand saturation.

TrendsThe Trends indicator is created for trend trading and (Bitsgap) crypto bots of crypto assets over longer time periods.
Works best for 4h, Daily and Weekly candles (even Monthly), but unsuitable for hourly candles and day trading.
This indicator shows you if a crypto pair is in a Bear, Bull or Sideways market.
The idea is to simplify decision making when to sell or buy, or what pairs to use with trading bots.
Stick to the rule of not having bots in a Bear trend!
- Blue = Bull trend
- Red = Bear trend
- Green = Sideways trend - which can be profitable with trading bots

Binance Open InterestIntro
A free and open source indicator that shows you open interest for Binance USDT and coin margin perpetual swap contracts, plotted as candlesticks.
Open interest means the total number of outstanding derivatives contracts, or in plain and simple English: the total amount of positions that traders have opened and still remain open.
Instructions
I've included data for a variety of cryptocurrencies that are quite popular right now.
However, since it's open source you can of course add any coin you want.
It's important to know that coin margin contracts have their open interest denominated in USD.
So if, for example, the ETH/USD perp shows a value of 470 million, that means 470 mil USD.
Tether margin contracts on the other hand are denominated in the coin itself.
So if, for example, the SOL/USDT perp shows a value of 1 million, that means 1 mil SOL worth of open contracts.
This is how the exchange created and denominated the contracts and I kept it this way to keep the data clean.
You could multiply that 1 mil SOL by the SOL price and it would show you the total open interest in USD terms of course, but that would make the candles look a bit funky.
If you look at the code you can see that for the coin margin contracts I've multiplied BTC open interest by a 100 and for altcoins I multiplied it by 10.
This is because of the Binance contract specifications, they use a multiplier of a 100 for bitcoin and altcoins have a multiplier of 10.
If you google "Binance Trading Rules of coin-margined Contracts" you'll find this info.
Some coins only have a USDT margin perp and not a coin margin perp.
YFI for example doesn't have a coin margin perp, but it is included in the list.
So if you select YFI and choose "coin margin" the indicator won't show anything.
The indicator still works, just select a different contract and you'll see open interest data appear again.
Access
It's free so just favourite it and you'll be able to add it to your chart and use it.
And it's also open source so you could just copy the code and make your own version of it.
Cheers.

BjCandlePatternsLibrary "BjCandlePatterns"
Patterns is a Japanese candlestick pattern recognition Library for developers. Functions here within detect viable setups in a variety of popular patterns. Please note some patterns are without filters such as comparisons to average candle sizing, or trend detection to allow the author more freedom.
doji(dojiSize, dojiWickSize) Detects "Doji" candle patterns
Parameters:
dojiSize : (float) The relationship of body to candle size (ie. body is 5% of total candle size). Default is 5.0 (5%)
dojiWickSize : (float) Maximum wick size comparative to the opposite wick. (eg. 2 = bottom wick must be less than or equal to 2x the top wick). Default is 2
Returns: (series bool) True when pattern detected
dLab(showLabel, labelColor, textColor) Produces "Doji" identifier label
Parameters:
showLabel : (bool) Shows label when input is true. Default is false
labelColor : (series color) Color of the label border and arrow
textColor : (series color) Text color
Returns: (series label) A label visible at the chart level intended for the title pattern
bullEngulf(maxRejectWick, mustEngulfWick) Detects "Bullish Engulfing" candle patterns
Parameters:
maxRejectWick : (float) Maximum rejection wick size.
The maximum wick size as a percentge of body size allowable for a top wick on the resolution candle of the pattern. 0.0 disables the filter.
eg. 50 allows a top wick half the size of the body. Default is 0% (Disables wick detection).
mustEngulfWick : (bool) input to only detect setups that close above the high prior effectively engulfing the candle in its entirety. Default is false
Returns: (series bool) True when pattern detected
bewLab(showLabel, labelColor, textColor) Produces "Bullish Engulfing" identifier label
Parameters:
showLabel : (bool) Shows label when input is true. Default is false
labelColor : (series color) Color of the label border and arrow
textColor : (series color) Text color
Returns: (series label) A label visible at the chart level intended for the title pattern
bearEngulf(maxRejectWick, mustEngulfWick) Detects "Bearish Engulfing" candle patterns
Parameters:
maxRejectWick : (float) Maximum rejection wick size.
The maximum wick size as a percentge of body size allowable for a bottom wick on the resolution candle of the pattern. 0.0 disables the filter.
eg. 50 allows a botom wick half the size of the body. Default is 0% (Disables wick detection).
mustEngulfWick : (bool) Input to only detect setups that close below the low prior effectively engulfing the candle in its entirety. Default is false
Returns: (series bool) True when pattern detected
bebLab(showLabel, labelColor, textColor) Produces "Bearish Engulfing" identifier label
Parameters:
showLabel : (bool) Shows label when input is true. Default is false
labelColor : (series color) Color of the label border and arrow
textColor : (series color) Text color
Returns: (series label) A label visible at the chart level intended for the title pattern
hammer(ratio, shadowPercent) Detects "Hammer" candle patterns
Parameters:
ratio : (float) The relationship of body to candle size (ie. body is 33% of total candle size). Default is 33%.
shadowPercent : (float) The maximum allowable top wick size as a percentage of body size. Default is 5%.
Returns: (series bool) True when pattern detected
hLab(showLabel, labelColor, textColor) Produces "Hammer" identifier label
Parameters:
showLabel : (bool) Shows label when input is true. Default is false
labelColor : (series color) Color of the label border and arrow
textColor : (series color) Text color
Returns: (series label) A label visible at the chart level intended for the title pattern
star(ratio, shadowPercent) Detects "Star" candle patterns
Parameters:
ratio : (float) The relationship of body to candle size (ie. body is 33% of total candle size). Default is 33%.
shadowPercent : (float) The maximum allowable bottom wick size as a percentage of body size. Default is 5%.
Returns: (series bool) True when pattern detected
ssLab(showLabel, labelColor, textColor) Produces "Star" identifier label
Parameters:
showLabel : (bool) Shows label when input is true. Default is false
labelColor : (series color) Color of the label border and arrow
textColor : (series color) Text color
Returns: (series label) A label visible at the chart level intended for the title pattern
dragonflyDoji() Detects "Dragonfly Doji" candle patterns
Returns: (series bool) True when pattern detected
ddLab(showLabel, labelColor) Produces "Dragonfly Doji" identifier label
Parameters:
showLabel : (bool) Shows label when input is true. Default is false
labelColor : (series color) Color of the label border and arrow
Returns: (series label) A label visible at the chart level intended for the title pattern
gravestoneDoji() Detects "Gravestone Doji" candle patterns
Returns: (series bool) True when pattern detected
gdLab(showLabel, labelColor, textColor) Produces "Gravestone Doji" identifier label
Parameters:
showLabel : (bool) Shows label when input is true. Default is false
labelColor : (series color) Color of the label border and arrow
textColor : (series color) Text color
Returns: (series label) A label visible at the chart level intended for the title pattern
tweezerBottom(closeUpperHalf) Detects "Tweezer Bottom" candle patterns
Parameters:
closeUpperHalf : (bool) input to only detect setups that close above the mid-point of the candle prior increasing its bullish tendancy. Default is false
Returns: (series bool) True when pattern detected
tbLab(showLabel, labelColor, textColor) Produces "Tweezer Bottom" identifier label
Parameters:
showLabel : (bool) Shows label when input is true. Default is false
labelColor : (series color) Color of the label border and arrow
textColor : (series color) Text color
Returns: (series label) A label visible at the chart level intended for the title pattern
tweezerTop(closeLowerHalf) Detects "TweezerTop" candle patterns
Parameters:
closeLowerHalf : (bool) input to only detect setups that close below the mid-point of the candle prior increasing its bearish tendancy. Default is false
Returns: (series bool) True when pattern detected
ttLab(showLabel, labelColor, textColor) Produces "TweezerTop" identifier label
Parameters:
showLabel : (bool) Shows label when input is true. Default is false
labelColor : (series color) Color of the label border and arrow
textColor : (series color) Text color
Returns: (series label) A label visible at the chart level intended for the title pattern
spinningTopBull(wickSize) Detects "Bullish Spinning Top" candle patterns
Parameters:
wickSize : (float) input to adjust detection of the size of the top wick/ bottom wick as a percent of total candle size. Default is 34%, which ensures the wicks are both larger than the body.
Returns: (series bool) True when pattern detected
stwLab(showLabel, labelColor, textColor) Produces "Bullish Spinning Top" identifier label
Parameters:
showLabel : (bool) Shows label when input is true. Default is false
labelColor : (series color) Color of the label border and arrow
textColor : (series color) Text color
Returns: (series label) A label visible at the chart level intended for the title pattern
spinningTopBear(wickSize) Detects "Bearish Spinning Top" candle patterns
Parameters:
wickSize : (float) input to adjust detection of the size of the top wick/ bottom wick as a percent of total candle size. Default is 34%, which ensures the wicks are both larger than the body.
Returns: (series bool) True when pattern detected
stbLab(showLabel, labelColor, textColor) Produces "Bearish Spinning Top" identifier label
Parameters:
showLabel : (bool) Shows label when input is true. Default is false
labelColor : (series color) Color of the label border and arrow
textColor : (series color) Text color
Returns: (series label) A label visible at the chart level intended for the title pattern
spinningTop(wickSize) Detects "Spinning Top" candle patterns
Parameters:
wickSize : (float) input to adjust detection of the size of the top wick/ bottom wick as a percent of total candle size. Default is 34%, which ensures the wicks are both larger than the body.
Returns: (series bool) True when pattern detected
stLab(showLabel, labelColor, textColor) Produces "Spinning Top" identifier label
Parameters:
showLabel : (bool) Shows label when input is true. Default is false
labelColor : (series color) Color of the label border and arrow
textColor : (series color) Text color
Returns: (series label) A label visible at the chart level intended for the title pattern
morningStar() Detects "Bullish Morning Star" candle patterns
Returns: (series bool) True when pattern detected
msLab(showLabel, labelColor, textColor) Produces "Bullish Morning Star" identifier label
Parameters:
showLabel : (bool) Shows label when input is true. Default is false
labelColor : (series color) Color of the label border and arrow
textColor : (series color) Text color
Returns: (series label) A label visible at the chart level intended for the title pattern
eveningStar() Detects "Bearish Evening Star" candle patterns
Returns: (series bool) True when pattern detected
esLab(showLabel, labelColor, textColor) Produces "Bearish Evening Star" identifier label
Parameters:
showLabel : (bool) Shows label when input is true. Default is false
labelColor : (series color) Color of the label border and arrow
textColor : (series color) Text color
Returns: (series label) A label visible at the chart level intended for the title pattern
haramiBull() Detects "Bullish Harami" candle patterns
Returns: (series bool) True when pattern detected
hwLab(showLabel, labelColor, textColor) Produces "Bullish Harami" identifier label
Parameters:
showLabel : (bool) Shows label when input is true. Default is false
labelColor : (series color) Color of the label border and arrow
textColor : (series color) Text color
Returns: (series label) A label visible at the chart level intended for the title pattern
haramiBear() Detects "Bearish Harami" candle patterns
Returns: (series bool) True when pattern detected
hbLab(showLabel, labelColor, textColor) Produces "Bearish Harami" identifier label
Parameters:
showLabel : (bool) Shows label when input is true. Default is false
labelColor : (series color) Color of the label border and arrow
textColor : (series color) Text color
Returns: (series label) A label visible at the chart level intended for the title pattern
haramiBullCross() Detects "Bullish Harami Cross" candle patterns
Returns: (series bool) True when pattern detected
hcwLab(showLabel, labelColor, textColor) Produces "Bullish Harami Cross" identifier label
Parameters:
showLabel : (bool) Shows label when input is true. Default is false
labelColor : (series color) Color of the label border and arrow
textColor : (series color) Text color
Returns: (series label) A label visible at the chart level intended for the title pattern
haramiBearCross() Detects "Bearish Harami Cross" candle patterns
Returns: (series bool) True when pattern detected
hcbLab(showLabel, labelColor) Produces "Bearish Harami Cross" identifier label
Parameters:
showLabel : (bool) Shows label when input is true. Default is false
labelColor : (series color) Color of the label border and arrow
Returns: (series label) A label visible at the chart level intended for the title pattern
marubullzu() Detects "Bullish Marubozu" candle patterns
Returns: (series bool) True when pattern detected
mwLab(showLabel, labelColor, textColor) Produces "Bullish Marubozu" identifier label
Parameters:
showLabel : (bool) Shows label when input is true. Default is false
labelColor : (series color) Color of the label border and arrow
textColor : (series color) Text color
Returns: (series label) A label visible at the chart level intended for the title pattern
marubearzu() Detects "Bearish Marubozu" candle patterns
Returns: (series bool) True when pattern detected
mbLab(showLabel, labelColor, textColor) Produces "Bearish Marubozu" identifier label
Parameters:
showLabel : (bool) Shows label when input is true. Default is false
labelColor : (series color) Color of the label border and arrow
textColor : (series color) Text color
Returns: (series label) A label visible at the chart level intended for the title pattern
abandonedBull() Detects "Bullish Abandoned Baby" candle patterns
Returns: (series bool) True when pattern detected
abwLab(showLabel, labelColor, textColor) Produces "Bullish Abandoned Baby" identifier label
Parameters:
showLabel : (bool) Shows label when input is true. Default is false
labelColor : (series color) Color of the label border and arrow
textColor : (series color) Text color
Returns: (series label) A label visible at the chart level intended for the title pattern
abandonedBear() Detects "Bearish Abandoned Baby" candle patterns
Returns: (series bool) True when pattern detected
abbLab(showLabel, labelColor, textColor) Produces "Bearish Abandoned Baby" identifier label
Parameters:
showLabel : (bool) Shows label when input is true. Default is false
labelColor : (series color) Color of the label border and arrow
textColor : (series color) Text color
Returns: (series label) A label visible at the chart level intended for the title pattern
piercing() Detects "Piercing" candle patterns
Returns: (series bool) True when pattern detected
pLab(showLabel, labelColor, textColor) Produces "Piercing" identifier label
Parameters:
showLabel : (bool) Shows label when input is true. Default is false
labelColor : (series color) Color of the label border and arrow
textColor : (series color) Text color
Returns: (series label) A label visible at the chart level intended for the title pattern
darkCloudCover() Detects "Dark Cloud Cover" candle patterns
Returns: (series bool) True when pattern detected
dccLab(showLabel, labelColor, textColor) Produces "Dark Cloud Cover" identifier label
Parameters:
showLabel : (bool) Shows label when input is true. Default is false
labelColor : (series color) Color of the label border and arrow
textColor : (series color) Text color
Returns: (series label) A label visible at the chart level intended for the title pattern
tasukiBull() Detects "Upside Tasuki Gap" candle patterns
Returns: (series bool) True when pattern detected
utgLab(showLabel, labelColor, textColor) Produces "Upside Tasuki Gap" identifier label
Parameters:
showLabel : (bool) Shows label when input is true. Default is false
labelColor : (series color) Color of the label border and arrow
textColor : (series color) Text color
Returns: (series label) A label visible at the chart level intended for the title pattern
tasukiBear() Detects "Downside Tasuki Gap" candle patterns
Returns: (series bool) True when pattern detected
dtgLab(showLabel, labelColor, textColor) Produces "Downside Tasuki Gap" identifier label
Parameters:
showLabel : (bool) Shows label when input is true. Default is false
labelColor : (series color) Color of the label border and arrow
textColor : (series color) Text color
Returns: (series label) A label visible at the chart level intended for the title pattern
risingThree() Detects "Rising Three Methods" candle patterns
Returns: (series bool) True when pattern detected
rtmLab(showLabel, labelColor, textColor) Produces "Rising Three Methods" identifier label
Parameters:
showLabel : (bool) Shows label when input is true. Default is false
labelColor : (series color) Color of the label border and arrow
textColor : (series color) Text color
Returns: (series label) A label visible at the chart level intended for the title pattern
fallingThree() Detects "Falling Three Methods" candle patterns
Returns: (series bool) True when pattern detected
ftmLab(showLabel, labelColor, textColor) Produces "Falling Three Methods" identifier label
Parameters:
showLabel : (bool) Shows label when input is true. Default is false
labelColor : (series color) Color of the label border and arrow
textColor : (series color) Text color
Returns: (series label) A label visible at the chart level intended for the title pattern
risingWindow() Detects "Rising Window" candle patterns
Returns: (series bool) True when pattern detected
rwLab(showLabel, labelColor, textColor) Produces "Rising Window" identifier label
Parameters:
showLabel : (bool) Shows label when input is true. Default is false
labelColor : (series color) Color of the label border and arrow
textColor : (series color) Text color
Returns: (series label) A label visible at the chart level intended for the title pattern
fallingWindow() Detects "Falling Window" candle patterns
Returns: (series bool) True when pattern detected
fwLab(showLabel, labelColor, textColor) Produces "Falling Window" identifier label
Parameters:
showLabel : (bool) Shows label when input is true. Default is false
labelColor : (series color) Color of the label border and arrow
textColor : (series color) Text color
Returns: (series label) A label visible at the chart level intended for the title pattern
kickingBull() Detects "Bullish Kicking" candle patterns
Returns: (series bool) True when pattern detected
kwLab(showLabel, labelColor, textColor) Produces "Bullish Kicking" identifier label
Parameters:
showLabel : (bool) Shows label when input is true. Default is false
labelColor : (series color) Color of the label border and arrow
textColor : (series color) Text color
Returns: (series label) A label visible at the chart level intended for the title pattern
kickingBear() Detects "Bearish Kicking" candle patterns
Returns: (series bool) True when pattern detected
kbLab(showLabel, labelColor, textColor) Produces "Bearish Kicking" identifier label
Parameters:
showLabel : (bool) Shows label when input is true. Default is false
labelColor : (series color) Color of the label border and arrow
textColor : (series color) Text color
Returns: (series label) A label visible at the chart level intended for the title pattern
lls(ratio) Detects "Long Lower Shadow" candle patterns
Parameters:
ratio : (float) A relationship of the lower wick to the overall candle size expressed as a percent. Default is 75%
Returns: (series bool) True when pattern detected
llsLab(showLabel, labelColor, textColor) Produces "Long Lower Shadow" identifier label
Parameters:
showLabel : (bool) Shows label when input is true. Default is false
labelColor : (series color) Color of the label border and arrow
textColor : (series color) Text color
Returns: (series label) A label visible at the chart level intended for the title pattern
lus(ratio) Detects "Long Upper Shadow" candle patterns
Parameters:
ratio : (float) A relationship of the upper wick to the overall candle size expressed as a percent. Default is 75%
Returns: (series bool) True when pattern detected
lusLab(showLabel, labelColor, textColor) Produces "Long Upper Shadow" identifier label
Parameters:
showLabel : (bool) Shows label when input is true. Default is false
labelColor : (series color) Color of the label border and arrow
textColor : (series color) Text color
Returns: (series label) A label visible at the chart level intended for the title pattern
bullNeck() Detects "Bullish On Neck" candle patterns
Returns: (series bool) True when pattern detected
nwLab(showLabel, labelColor, textColor) Produces "Bullish On Neck" identifier label
Parameters:
showLabel : (bool) Shows label when input is true. Default is false
labelColor : (series color) Color of the label border and arrow
textColor : (series color) Text color
Returns: (series label) A label visible at the chart level intended for the title pattern
bearNeck() Detects "Bearish On Neck" candle patterns
Returns: (series bool) True when pattern detected
nbLab(showLabel, labelColor, textColor) Produces "Bearish On Neck" identifier label
Parameters:
showLabel : (bool) Shows label when input is true. Default is false
labelColor : (series color) Color of the label border and arrow
textColor : (series color) Text color
Returns: (series label) A label visible at the chart level intended for the title pattern
soldiers(wickSize) Detects "Three White Soldiers" candle patterns
Parameters:
wickSize : (float) Maximum allowable top wick size throughout pattern expressed as a percent of total candle height. Default is 5%
Returns: (series bool) True when pattern detected
wsLab(showLabel, labelColor, textColor) Produces "Three White Soldiers" identifier label
Parameters:
showLabel : (bool) Shows label when input is true. Default is false
labelColor : (series color) Color of the label border and arrow
textColor : (series color) Text color
Returns: (series label) A label visible at the chart level intended for the title pattern
crows(wickSize) Detects "Three Black Crows" candle patterns
Parameters:
wickSize : (float) Maximum allowable bottom wick size throughout pattern expressed as a percent of total candle height. Default is 5%
Returns: (series bool) True when pattern detected
bcLab(showLabel, labelColor, textColor) Produces "Three Black Crows" identifier label
Parameters:
showLabel : (bool) Shows label when input is true. Default is false
labelColor : (series color) Color of the label border and arrow
textColor : (series color) Text color
Returns: (series label) A label visible at the chart level intended for the title pattern
triStarBull() Detects "Bullish Tri-Star" candle patterns
Returns: (series bool) True when pattern detected
tswLab(showLabel, labelColor, textColor) Produces "Bullish Tri-Star" identifier label
Parameters:
showLabel : (bool) Shows label when input is true. Default is false
labelColor : (series color) Color of the label border and arrow
textColor : (series color) Text color
Returns: (series label) A label visible at the chart level intended for the title pattern
triStarBear() Detects "Bearish Tri-Star" candle patterns
Returns: (series bool) True when pattern detected
tsbLab(showLabel, labelColor, textColor) Produces "Bearish Tri-Star" identifier label
Parameters:
showLabel : (bool) Shows label when input is true. Default is false
labelColor : (series color) Color of the label border and arrow
textColor : (series color) Text color
Returns: (series label) A label visible at the chart level intended for the title pattern
wrap(cond, barsBack, borderColor, bgcolor) Produces a box wrapping the highs and lows over the look back.
Parameters:
cond : (series bool) Condition under which to draw the box.
barsBack : (series int) the number of bars back to begin drawing the box.
borderColor : (series color) Color of the four borders. Optional. The default is color.gray.
bgcolor : (series color) Background color of the box. Optional. The default is color.gray.
Returns: (series box) A box who's top and bottom are above and below the highest and lowest points over the lookback
topWick() returns the top wick size of the current candle
Returns: (series float) A value equivelent to the distance from the top of the candle body to its high
bottomWick() returns the bottom wick size of the current candle
Returns: (series float) A value equivelent to the distance from the bottom of the candle body to its low
body() returns the body size of the current candle
Returns: (series float) A value equivelent to the distance between the top and the bottom of the candle body
highestBody() returns the highest body of the current candle
Returns: (series float) A value equivelent to the highest body, whether it is the open or the close
lowestBody() returns the lowest body of the current candle
Returns: (series float) A value equivelent to the highest body, whether it is the open or the close
barRange() returns the height of the current candle
Returns: (series float) A value equivelent to the distance between the high and the low of the candle
bodyPct() returns the body size as a percent
Returns: (series float) A value equivelent to the percentage of body size to the overall candle size
midBody() returns the price of the mid-point of the candle body
Returns: (series float) A value equivelent to the center point of the distance bewteen the body low and the body high
bodyupGap() returns true if there is a gap up between the real body of the current candle in relation to the candle prior
Returns: (series bool) true if there is a gap up and no overlap in the real bodies of the current candle and the preceding candle
bodydwnGap() returns true if there is a gap down between the real body of the current candle in relation to the candle prior
Returns: (series bool) true if there is a gap down and no overlap in the real bodies of the current candle and the preceding candle
gapUp() returns true if there is a gap down between the real body of the current candle in relation to the candle prior
Returns: (series bool) true if there is a gap down and no overlap in the real bodies of the current candle and the preceding candle
gapDwn() returns true if there is a gap down between the real body of the current candle in relation to the candle prior
Returns: (series bool) true if there is a gap down and no overlap in the real bodies of the current candle and the preceding candle
dojiBody() returns true if the candle body is a doji
Returns: (series bool) true if the candle body is a doji. Defined by a body that is 5% of total candle size

CRCHud - HUD Library (Heads Up Display)Library "CRCHud"
Library of functions which will contain functions that allow reusable HUD (Heads up Display) components to used from within other scripts
add_cell_change() - Adds a new cell to designated table which displays the data source value, the line color, data title, and automatically calculated %percent change stats based on lookback value supplied (default - previous bar)

Session Levels - Ultimate Range IndicatorSession Levels - Ultimate Range Indicator
Primarily developed for trading the E-MINI Futures Markets like NQ or ES from the CME Group,
but also more than suitable for Crypto or other instruments.
This indicator highlights the chosen session, which can be Globex, Asian, London and New York.
It plots the important levels and also renders the Opening Range as it forms (a.k.a. Initial Balance).
After the 1st hour Opening Range is finished, it can plot the Standard Deviations / Projections.
See below for a complete feature list.
All Opening Ranges on chart and for the New York session the Range Projections are turned on:
s3.tradingview.com
How to use (example):
If you are trading the Nasdaq Futures (NQ!)
Enable the Globex Overnight session. Basically in the Futures Market, the Globex session is everything outside of US trading hours of Stocks. This draws the important overnight levels, like the Low, 25%, 50%, 75% and the High.
Enable the New York Session with Levels and Opening Range. Generally, 70% of the time the 1st hour will put a Low or High of the day.
If the price is trading above the Globex Low, most likely the Low of the Day is formed and the price target for the day will be 1.5x Standard Deviation and 2x Standard Deviation.
[*} Deviation of the Initial Balance depends on the volume ad overall market structure.
** This is not financial advice or any guarantee **
Features:
Show each Session Highlighted on Intraday chart in it's own color (each session can be turned off and has customizable times and color)
Show Line Levels of each session: Low, 25%, 50%, 75% and the High (customizable color)
Show the Opening Range (Initial Balance) of the Asian, London and New York session. Note: NY has more options.
Opening Range is displayed as a box with level lines (customizable color)
Levels are drawn to the end of the NY Cash session (customizable time)
Show IB Standard Deviations 0.5 - 3.0. Calculated from the Opening Range (Initial Balance)
Option to display Higher Timeframe levels: Previous Day Open/Close and Previous Week Open/Close
All level lines and OR boxes size dynamically as the session progresses
Built in Alerts for when price hits key levels. e.g. Alert when price crosses the NY Opening Range High. Or an Alert when the first STDEV is hit.
Option to toggle display of drawings for Today's trading session only, or Show all recent session levels. This keeps the chart clean or not.
Extras:
The NY Opening Range also has a 50% level line
The NY Opening Bar can be highlighted separately
The Level Lines can have small labels turned on/off. Values are only shown on mouse over to keep a clean chart
Keep in mind:
1) This indicator works on all instruments, but on instruments with limited market hours, your chart setting
has to be set to "Extended Hours" otherwise. For example TSLA on NASDAQ.
2) The Exchange Time Zone for the CME Group is Chicago UTC-6. So the session times you configure in the settings menu are based on that timezone too.
3) Globex opens at 5pm CST and closes when the US session starts 8:30CST.
4) When enabling the Alerts in the Indicator settings, be sure to also create an alarm for this indicator using the Alarm function of Tradingview.

BTC Futures BasisShows various basis percentages in a table and plots historical basis. Also has an alert function for backwardation events. Useful for tracking bullish/bearish sentiment in BTC futures markets.
*Currently displays March and June futures for the following exchanges: Bitmex, Binance, Deribit, Okex, and FTX
Also displays CME Continuous Next Contract. All of the symbols are customizable.
-----------
Market-wide backwardation usually occurs during a heavy sell-off (such as a liquidation cascade).
**For getting alerts of backwardation events, I recommend creating an alert on the 1 minute chart with the condition "Any alert() function call". Alert level is customizable as well.
-----------
*NOTE!! : Futures contracts expire (obviously), so the contract symbols will need to be updated periodically. I will try to keep them updated going into the future.
**NOTE2!! : The alert() function does not track the CME contract. This is to avoid false triggers.

CRC.i Bollinger Bands ®This script is yet another variant of the famous Bollinger Bands® TA tool used to track price volatility as it deviates from the mean of a security using standard deviations (positive &negative). Built for my own personal preferences. But perhaps you might like it, too.
Includes
+ Chart Lines: price, upper and lower bands
+ User Options: SMA length, stdev value
+ Heads up Display (HUD) with TARGET's and other related stats
Bugs? Comments? Requests? Ping me @calmrat

Trend Volatility Tops and Bottoms
Big Picture:
Overall what this script try's to capture is bounces off of moving trend lines.
What you will see when using this script
one Green line, one red line, two gray lines and circles in colors blue, green, red, and purple.
RED AND GREEN LINES:
There are two trend lines, an upper and a lower line that are 1 to 2 standard deviations from the linear regression line formed by the closing price for a look back period. The green is the distance from the close price and the lower line. The red is the list from the close and the upper line. (you don't see the lower and upper lines, but yo do see the green and red lines)
The goal is too easily see when price is approaching those support and resistance levels.
GRAY LINES:
GRAY lines are a form of volatility metric. GRAYS represent the distance from the RED and GREEN lines talked about above. low volatility mean the two GRAY lines will be close and times of high volatility will be father apart.
COLORED CIRCLES:
the color circles represent possible bounce zones, when price is high or low for for a given time period.
PURPLE is caution that there could be a possible price drop
RED is a critical zone for rejection and price drop
BLUE is caution that there could be a possible price increase
GREEN is a critical zone for bounce and price increase
how its used
feel free to play around and Try new things but, how its intended to be used is on 4hr time Frame looking for longer term trends on assets that tend to be less volatile on average.
settings
some settings:
buy deviation, this will say how many standard deviations do you want the lower bounce line to be from the linear regression line
sell deviation, this will say how many standard deviations do you want the upper bounce line to be from the linear regression line
dist to zero buy: how close dose the price has to be to put out a possible bounce.
Recap
-red and purple = possible upcoming price drop... red is more critical than purple
-green and blue = possible upcoming price increase... green is more critical than blue
-use on less volatile assents and on 4hr timeframe
good luck!

ms hypersupertrendThis is a well-known strategy by using 3 different Supertrends and a trend-defining EMA,
feel free to play around with the settings, a backtest on 8h ETHUSDT pair brought some good results using
the 233EMA and investing 75% of a 10k start capital
the idea is to have at least 2 super trends going green above the trend-EMA to go long and exit by turning
2 super trends red (idea: 1 super trend in red could initialize a take profit)
shorts work vice versa
The EMA shows in green for uptrends and in red for downtrends, if it is blue no Signal will be taken because
the 3 super trends are not all above or below the trendline(EMA)
//-------------------------------------------------------------------------------------------------------------------------------------------------
Update 1:
- Fixed a minor input error
- Added ATR stoploss, and commented out the percentage stop loss
- Added time window to backtest
- Added exit on risk/reward is met
- This version is only buy...wait for next update adding shorts and more
As always, thanks for your ideas, likes, and support. Feel free to mess around with the settings and give me your feedback.

Contrarian Scalping Counter Trend Bb Envelope Adx and StochasticContrarian Scalping is an trading strategy designed to take advanted of a counter-trend.
The advantage of these strrategies types is that they have a good profitability but with do not great gain (in relation at the time frame).
Indicators used:
Bollinger
Envelope
ADX
Stochastic
Rules for entry
For short: close of the price is above upper band from bb and envelope, adx is below 30 and stochastic is above 50
For long: close of the price is below lower band from bb and envelope, adx is below 30 and stochastic is below 50
Rules for exit
For short: either close of the candle is below lower band of bb or enveloper or stochastic is below 50
For long: either close o the candle is above upper band of bb or envelope or stochastic is above 50
If there are any questions let me know !

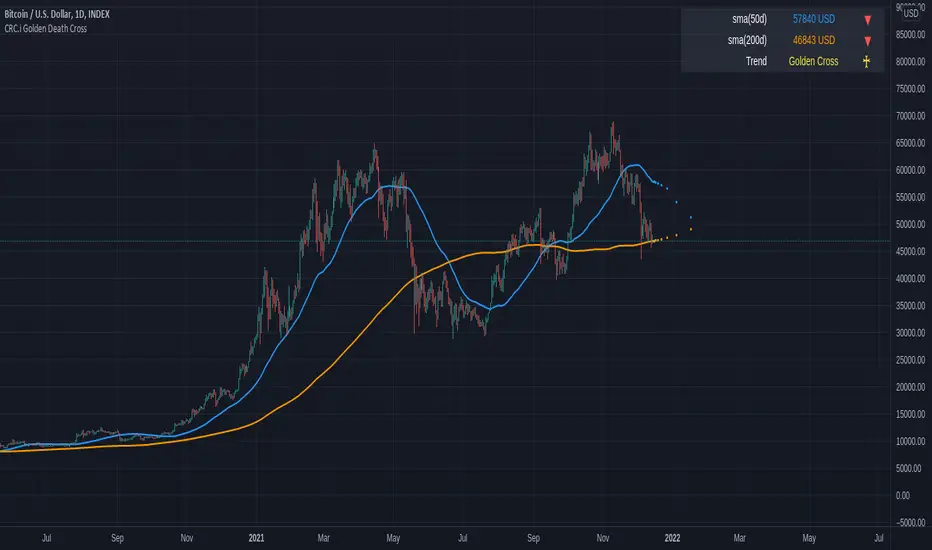
CRC.i Golden Death CrossThis is a simple reproduction of a common indicator used for analyzing the current momentum trend.
Golden Cross => 50 day simple moving average (sma) crosses over the 200 sma
Death Cross => 50 day simple moving average (sma) crosses under the 200 sma
Forecasting used in this indicator is a simple moving average, considering the price sma with length of (sma period - future bar count).
More articles at
mirror.xyz
medium.com
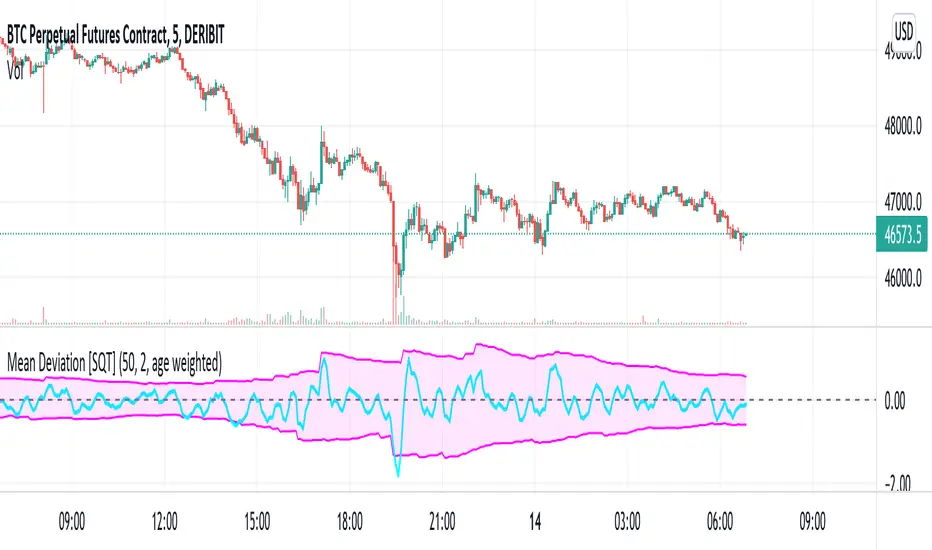
Two sided mean deviation Indicator [SQT]Description
The indicator aims at detecting up and down moves that deviate substantially from their respective means. The up and down means are calculated separately taking the last N up or down candles into account (Use N candles). Based on these means the upper and lower bounds are calculated by adding or subtracting the distributions standard deviation (Sigma bounds), multiplied by a user specified factor. After a substantial move, the bounds will either decay sharply to their mean after N up or down candles have passed (Decay: equally weighted) or gradually (Decay: age weighted, weight can be adjusted in the Pine script). The equally weighted decay is meant to model persistent memory whereas the age weighted decay models fading memory of the market over the last N up or down candles. The upper and lower bounds constitute the shaded area. The signal line is simply an EMA with length 3 of the sum of the last 3 percentage changes. These values can be adjusted from the Pine script directly.
Intended use
The signal line leaving the shaded area indicates a substantial move away from the respective mean under the given parameters. This might be interpreted as a signal for the price to revert back to it's mean during the following candles (mean reversion).
Markets
The indicator may be used on any timeseries that is expected to have mean reverting behaviour. Development was done on DERIBIT:BTCPERP using 5 minute candles.
RSI Average Swing BotThis is a modified RSI version using as a source a big length(50 candles) and an average of all types of sources for candle calculations such as ohlc4, close, high, open, hlc3 and hl2.
In this case we are going to use a 0-1 scale for an easier calculation, where 0.5 is going to be our middle point.
Above 0.5 we consider a bullish possibility.
Below 0.5 we consider a bearish possibility.
I made a small example bot using that initial logic, together with 2 exit points for long or short positions.
If there are any questions, let me know !

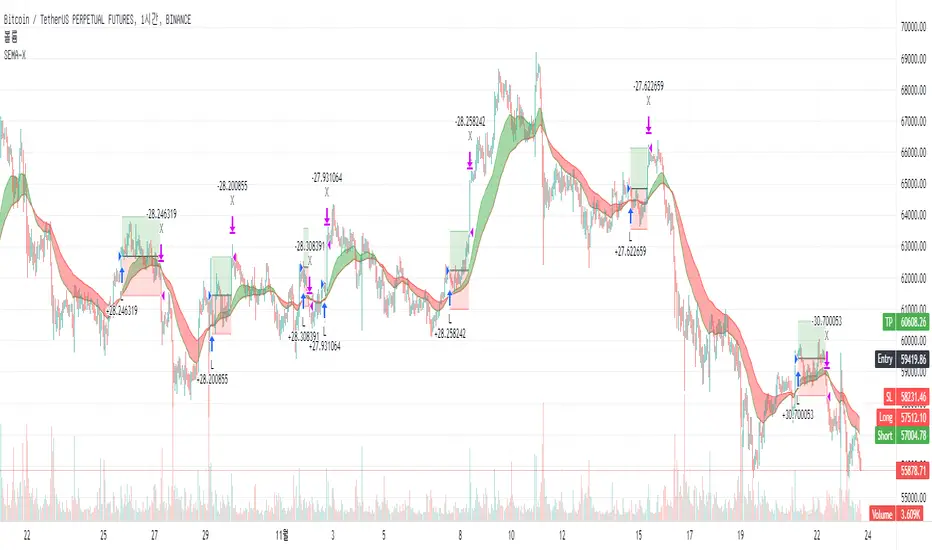
SEMA-XSEMA-X (sema cross)
It's a simple EMA cross strategy
Rules of strategy
1. 2 EMA crossing
2. Long (Golden Cross), Short (Dead Cross)
3. Target profit, stop loss setting
You can also get big trend gains if you set a long target price.
* * *
SEMA-X (세마크로스)
간단한 EMA 교차 전략 입니다.
전략의 규칙
1. 2개의 EMA 교차
2. 매수(골든 크로스), 매도(데드 크로스)
3. 목표가, 손절가 설정
목표가를 길게 설정하면 큰 추세 이익도 얻을 수 있습니다.
Swing Multi Moving Averages Crypto and Stocks StrategySimple and efficient multi moving average strategy combined with risk management and time condition.
Indicators/ Tools used
Multi selection moving average type like SMA , EMA , SMMA , VWMA , VIDYA , FRAMA , T3 and much more
Limit 1 entry max per week, entry on monday exit on sunday or risk management tp/sl.
Rules for entry:
LONG:Close of the candle cross above the moving average while the previous close was below. All of this is happening during monday session.
SHORT:Close of the candle cross below the moving average while the previous close was above. All of this is happening during monday session.
Rules for exit:
We exit either on sunday or if we reach tp/sl levels.
Observations:
I recommend use the strategy 2 types, one for long and another for short, using different parameters since long and short movements behave differently.
For example for long we can use a shorter moving average longth and a higher tp/sl while for short we can use a bigger moving average length and a smaller tp/sl
If you have any questions let me know !

Swing VWAP Crypto and Stocks StrategyThis is a strategy designed for swing trading on markets such as crypto and stocks.
Its components are:
VWAP
Time Management
Risk management
Rules for entry:
We entry only on Monday, if our close of the candle crossed above VWAP
Rules for exit
We exit always on Sunday or if we either hit the TP/SL levels.
If you have any questions let me know

RSI Rising Crypto Trending AlertAlert version of the strategy with the same name
This is crypto and stock market trending strategy designed for long timeframes such as 4h+
From my tests it looks like it works better to trade crypto against crypto than trading against fiat.
Indicators used:
RSI for rising/falling of the trend
BB sidemarket
ROC sidemarket
Rules for entry
For long: RSI values are rising, and bb and roc tells us we are not in a sidemarket
For long: RSI values are falling, and bb and roc tells us we are not in a sidemarket
Rules for exit
We exit when we receive an opposite direction.
Cuation: Because this strategy uses no risk management, I recommend you takje care with it.
If you have any questions, let me know !

ICHIMOKU Crypto Swing AlertThis is a crypto swing alert for the strategy with the same name designed for timeframes bigger than 1h.
The main components are
ICHOMOKU
KDJ
Average High
Average Low
Rules for entry
For long: we have the ichimoku crosses between tenkan and baselines, we have a rising kdj line and at the same time we have a increase in the average high
For short: we have the ichimoku crosses between tenkan and baselines, we have a falling kdj line and at the same time we have an increase in the average low
Rules for exit
We exit when we have inverse conditions than the initial ones used for entry.
Caution
This strategy does not use a risk management, so be careful with it !
If you have any questions let me know !

Scalping Trading System ALERT Crypto and StocksThis is the alert version of the strategy with the same name.
Indicators
SImple Moving Average
Exponential Moving Average
Keltner Channels
MACD Histogram
Stochastics
Rules for entry
long= Close of the candle bigger than both moving averages and close of the candle is between the top and bot levels from Keltner . At the same time the macd histogram is negative and stochastic is below 50.
short= Close of the candle smaller than both moving averages and close of the candle is between the top and bot levels from Keltner . At the same time the macd histogram is positive and stochastic is above 50.
Rules for exit
We exit when we meet an opposite reverse order.
This strategy has no risk management inside, so use it with caution !

SSR - Stablecoin Supply Ratio - Bitcoin - CryptocurrencyThe Stablecoin Supply Ratio (SSR) is the ratio between Bitcoin supply and the supply of stablecoins, denominated in BTC.
When the SSR is low, the current stablecoin supply has more "buying power" to purchase BTC. It serves as a proxy for the supply/demand mechanics between BTC and USD.
