HTF Current/Average RangeThe "HTF(Higher Timeframe) Current/Average Range" indicator calculates and displays the current and average price ranges across multiple timeframes, including daily, weekly, monthly, 4 hour, and user-defined custom timeframes.
Users can customize the lookback period, table size, timeframe, and font color; with the indicator efficiently updating on the final bar to optimize performance.
When the current range surpasses the average range for a given timeframe, the corresponding table cell is highlighted in green, indicating potential maximum price expansion and signaling the possibility of an impending retracement or consolidation.
For day trading strategies, the daily average range can serve as a guide, allowing traders to hold positions until the current daily range approaches or meets the average range, at which point exiting the trade may be considered.
For scalping strategies, the 15min and 5min average range can be utilized to determine optimal holding periods for fast trades.
Other strategies:
Intraday Trading - 1h and 4h Average Range
Swing Trading - Monthly Average Range
Short-term Trading - Weekly Average Range
Also using these statistics in accordance with Power 3 ICT concepts, will assist in holding trades to their statistical average range of the chosen HTF candle.
CODE
The core functionality lies in the data retrieval and table population sections.
The request.security function (e.g., = request.security(syminfo.tickerid, "D", , lookahead = barmerge.lookahead_off)) retrieves high and low prices from specified timeframes without lookahead bias, ensuring accurate historical data.
These values are used to compute current ranges and average ranges (ta.sma(high - low, avgLength)), which are then displayed in a dynamically generated table starting at (if barstate.islast) using table.new, with conditional green highlighting when the current range is greater than average range, providing a clear visual cue for volatility analysis.
Current

OHMLC Lines - Present- Current OHMLC candles
- Show current Open, High, Mid, Low, Close candles levels

Volume PanelDisplays volume data in panel on bottom right of screen. Shows current bar, change from last bar and average of last 20 bars. This number can be changed in settings if you wish to have the average calculated on a different amount of bars.
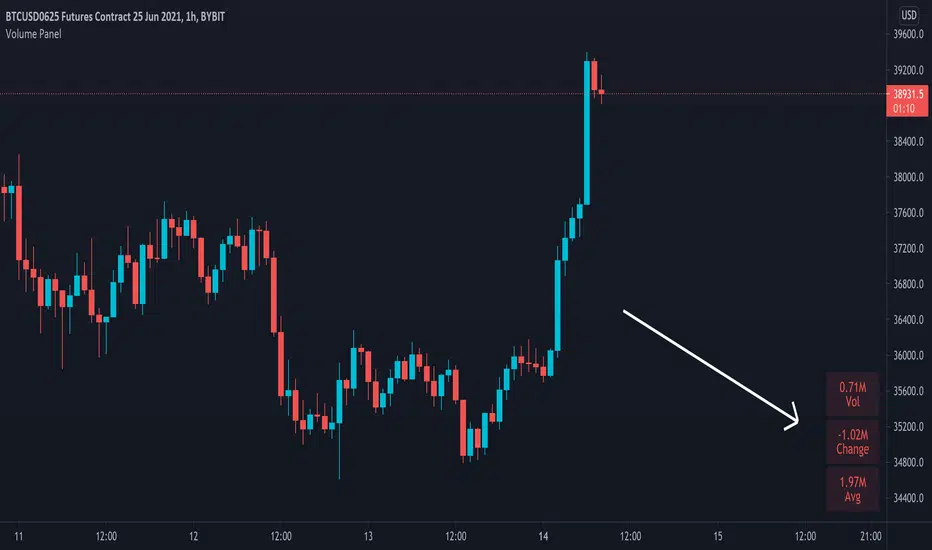

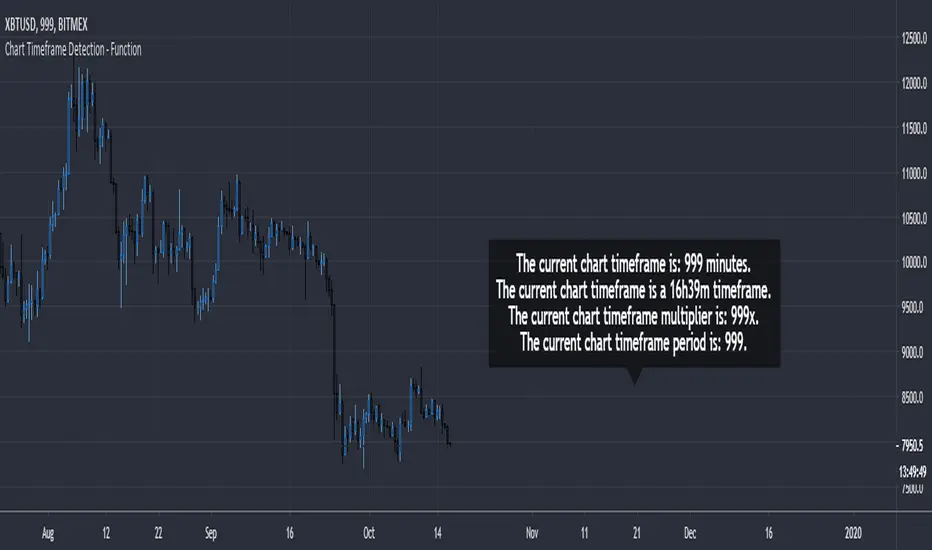
Chart Timeframe Detection - FunctionChart Timeframe Detection - Function
A small and effective function to detect the current chart timeframe in minutes.
It can be used to further detect a specific chart timeframe (a daily timeframe or even a 16h39m timeframe).
The result is returned as integer.
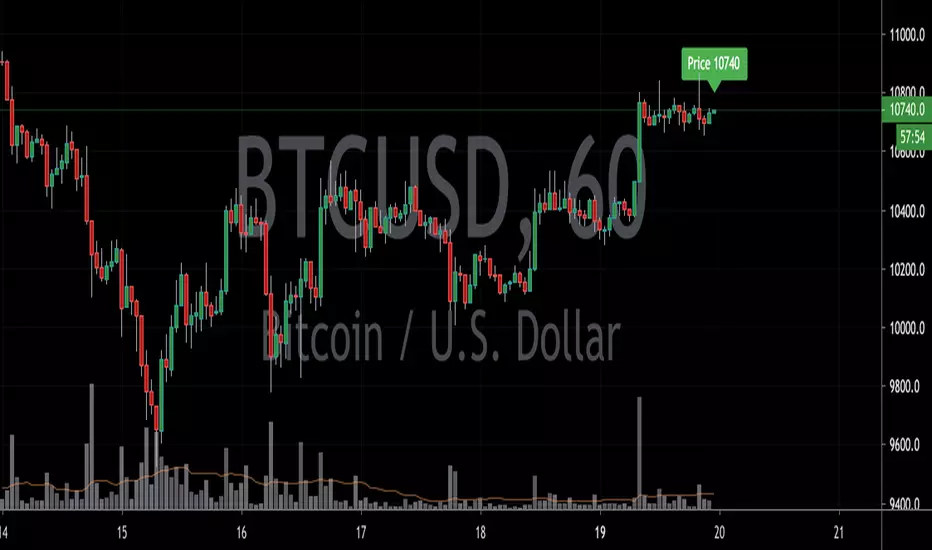
Current Price Label by Westy_A simple Indicator to display the current price of the asset above the current bar. It shows a green label if the close is equal or greater than the open, red otherwise.
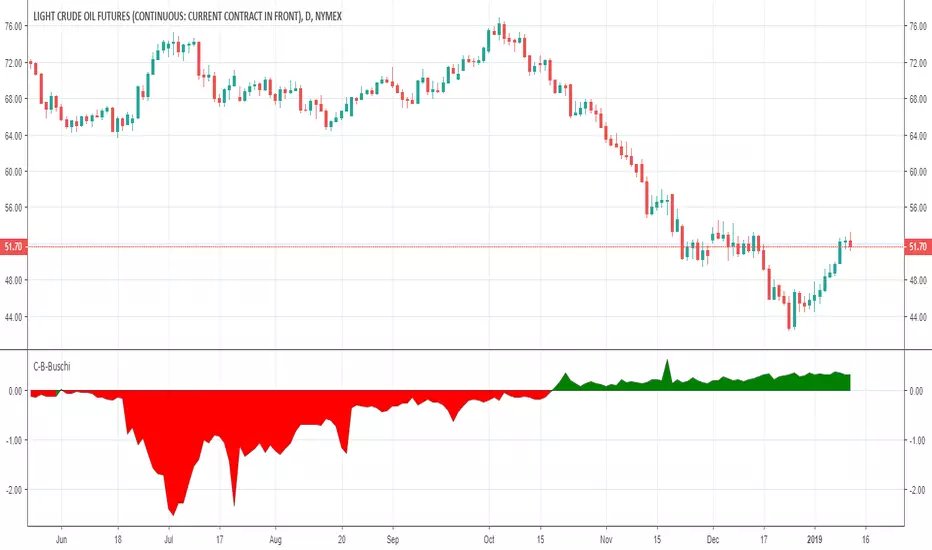
Contango-Backwardation-Buschi
English:
This script shows the difference between a future's continuous current contract (e. g. CL1!) and the continuous next contract (e. g. CL2!). Normally, the next contract is more expensive ("Contango" - shown in green). If the next contract is cheaper, the difference is negative ("Backwardation" - shown in red).
A change between Contango and Backwardation often corresponds with stronger price changes.
Deutsch:
Dieses Skript zeigt den Unterschied zwischen dem kontinuierlichen aktuellem Kontrakt eines Futures (z. B. CL1!) und dem kontinuierlichen Folgekontrakt (z. B. CL2!). Im Normalfall ist der Folgekontrakt teurer ("Contango" - angezeigt in grün). Wenn der Folgekontrakt billiger ist, ist die Differenz negativ ("Backwardation" - angezeigt in rot).
Ein Wechsel zwischen Contango und Backwardation korrespondiert häufig mit größeren Preisänderungen.