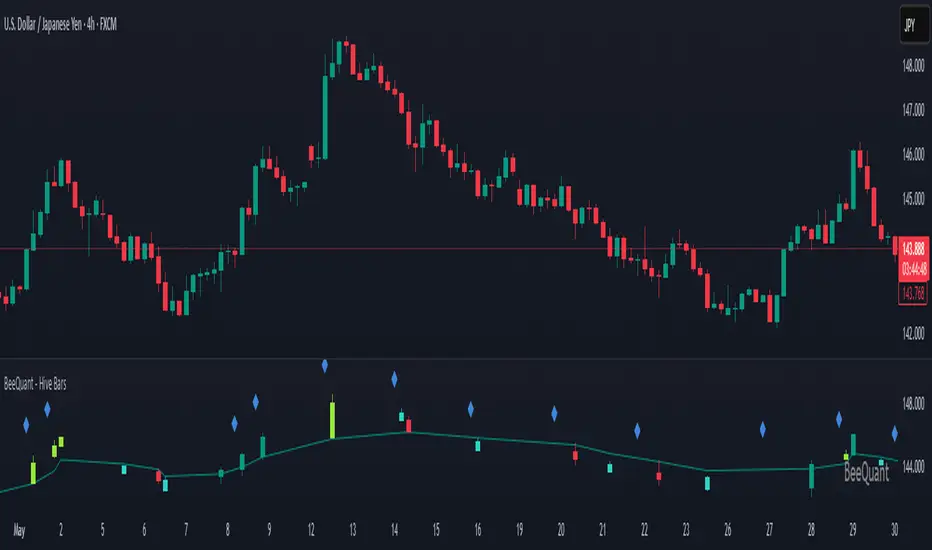
BeeQuant - Hive Bars🔶 OVERVIEW
The "Hive Bars" indicator is a truly revolutionary analytical instrument, meticulously engineered to transcend the limitations of conventional price charting and unveil the profound, underlying essence of market dynamics. Imagine possessing a sophisticated visual engine that intelligently reconstructs raw price data into unique, dynamically consolidated "Hive Bars." These specialized constructs intuitively reveal the dominant market momentum and highlight high-conviction signals often obscured by the ubiquitous noise of traditional candlesticks. This indicator acts as a precision filter, illuminating exactly when pivotal shifts are occurring by coloring these reconstructed units with an adaptive, unparalleled accuracy. It is expertly crafted for the discerning trader seeking an undeniable analytical advantage, offering a fresh, meticulously refined perspective that enables the discernment of concealed patterns, fostering more decisive and confident trading actions. Crucially, "Hive Bars" now feature proactive, real-time alert capabilities, ensuring no critical market inflection point ever goes unnoticed.
__________________________________________________________________________
🧠 CONCEPTS
At its intellectual core, the "Hive Bars" indicator operates upon an advanced, proprietary framework that fundamentally reinterprets market data. It presents this refined information through its unique "Hive Bars"—specialized visual constructs that dynamically encapsulate the consolidated spirit and true directional bias of price action, delivering unparalleled clarity.
⬜ Smart Bar Reconstruction: Hive Bars don’t follow time, they follow the market. They are derived through a sophisticated, multi-faceted internal process that precisely captures the dominant price influence and momentum over variable periods. This structure adapts dynamically to changing conditions, letting you see the real pressure behind price moves with consistency that time-based candles can’t match. This proprietary reconstruction creates a new, inherently consistent, and highly focused visual narrative of underlying market flow, effectively stripping away extraneous "noise" and revealing the market's authentic directional intent.
⬜ Multi-Layered Internal Analysis: A dynamic and live, adaptive line powers the core of Hive Bars. It recalibrates constantly, tracking market structure in real time. Every bar is formed in relation to this internal baseline, giving immediate context to price behavior. You choose the data that drives this line—open, close, high, low, or custom blends—to match your style.
⬜ Intelligent Bar Formation Sequences: Bars are created when the market speaks, not when the clock ticks. A built-in pattern engine reads the flow and waits for real structure to form. This allows the indicator to autonomously consolidate price action, presenting a cleaner, more coherent visualization of trend development as it truly unfolds, rather than fragmented snapshots based on time.
⬜ Visual Signal Precision: "Hive Bars" spring to life with an intuitively powerful coloring system. While primary colors (Green for upward bias, Red for downward bias) denote the prevailing market direction, the "Hive Bars" indicator introduces distinctively colored "Signal Hive Bars". These specialized bars emerge when the market price exhibits a particularly robust, high-conviction interaction with the adaptive internal baseline, standing out instantly and often mark key turning points or breakouts you want to act on.
⬜ Daily Reset Option: For intraday traders, there’s a reset feature that clears the internal build-up at the start of each new trading day. This ensures fresh, unbiased perspectives that are meticulously tailored to the distinct market dynamics and cyclic rhythms of the current trading day.
⬜ Adjustable Sensitivity: With Hive Smoothing, you’re in full control. This setting lets you fine-tune how sensitive the bars are to price movement. Want tighter, faster signals? Dial it down. Prefer broader, more filtered setups? Turn it up. You decide when a new Hive Bar forms—and when a Signal Bar confirms. It’s all based on how you trade and how your asset moves. No guesswork, no one-size-fits-all defaults. Hive Bars adapts to your strategy and trading style, not the other way around.
__________________________________________________________________________
✨ FEATURES
The "Hive Bars" indicator is equipped with a comprehensive suite of cutting-edge features, designed for unparalleled clarity, adaptive responsiveness, augmented analytical depth, seamless interoperability with your broader analytical toolkit, and proactive real-time notifications:
🔹Proprietary Hive Bar Reconstruction
Experience a uniquely advanced visual representation of price action that dynamically consolidates market data, leading to enhanced trend and momentum clarity that goes beyond standard charting and candlestick data.
🔹Customizable Internal Analysis Line
Gain precise control over the underlying adaptive baseline's calculation by selecting various internal price source options, ensuring its alignment with your specific analytical focus.
🔹 Smart Alerts for Key Events 🔔
Get notified in real time when:
◦ A new Hive Bar completes – signaling a fresh structural range reset
◦ A new Signal Hive Bar closes – identifying a potential overbought or oversold condition
Built-in alert conditions make it easy to stay ahead of shifts without watching every candle manually.
🔹Intelligent Bar Formation Sequencing
Diamond-shaped markers clearly indicate the start of the indicator's internal combination logic for enhanced visual understanding.
🔹High-Conviction "Signal Hive Bars" (Distinct Colors)
Receive specialized, uniquely colored visual alerts when Hive Bars exhibit strong, decisive movements relative to the adaptive baseline, indicating moments of heightened market conviction and potential opportunity.
🔹Session-Based Reconstruction
Opt for the "Daily New Start" to intelligently reset the indicator's perspective with each new trading day, providing fresh, session-aligned insights tailored for intraday precision.
🔹Unrivaled External Indicator Collaboration
A truly unique and powerful advantage of "Hive Bars" is its capability to seamlessly integrate and profoundly enhance the performance of other external indicators. By outputting clean, smoothed price data, it lets you feed a higher-quality source into tools like RSI, MACD, moving averages etc. Use close for indicators like RSI, and close for moving averages. The result is better clarity, fewer false signals, and a stronger edge across your setup. Hive Bars isn’t just an indicator, it’s an upgrade for everything you use.
🔹Non-Repainting Historical Integrity
Hive Bars never repaints. Each bar is locked in only after all internal conditions are fully met. This means you can trust every historical signal—it won’t shift or vanish after the fact. What you see in hindsight is exactly what was shown in real time.
🔹Universal Timeframe Compatibility
Whether you're scalping on the 1-minute chart or analyzing multi-month trends, Hive Bars delivers consistent, clean insights. Its architecture adapts to any timeframe without losing fidelity, making it a reliable tool for any strategy or style.
🔹Cross-Market Versatility
Hive Bars is engineered to perform with precision across all major markets—whether you're trading forex, commodities, stocks, or indices. Its adaptive logic automatically aligns with the unique volatility and structure of each asset class, delivering consistently reliable insights no matter where you trade.
__________________________________________________________________________
⚙️ USAGE
Integrating the "Hive Bars" indicator into your daily analytical regimen is an intuitive process that will profoundly enhance your ability to discern crucial market dynamics and spot high-conviction opportunities with unprecedented clarity:
💁 Effortless Application
Simply add the "Hive Bars" indicator to any chart within your TradingView platform. Note that it plots on a separate panel below your main price chart to provide its unique visual output without obscuring the primary price action.
📊 Strategic Calibration
Access the indicator's comprehensive settings panel to meticulously calibrate its powerful engines and unlock its full potential:
⚙ "Internal EMA Config"
Configure the internal adaptive baseline by choosing its source (e.g., CLOSE, HL/2) and its specific EMA length. This shapes the core reference point for the dynamic formation of the "Hive Bars."
🤖 "CONFIG Group"
Here, you decide if you want "Daily New Start" for session-based analytical resets (particularly beneficial for intraday strategies). The "Hive Smoothing" input allows you to control a further layer of consolidation for the "Hive Bars."
🟩🟥 "Color": Customize the appearance of both standard "Hive Bars" and "Signal Hive Bars" to suit your visual preferences, enhancing their immediate interpretability.
🧭 Empirical Exploration
Experimentation with these parameters is paramount. Dedicate time to exploring different combinations across various assets and timeframes to discover the optimal configuration that resonates with your unique trading methodology and the inherent volatility of the market being analyzed.
👀 Interpreting the Unveiled Market Reality: Once calibrated, the "Hive Bars" will present a strikingly clear and actionable picture of market dynamics:
+ Green/Red Hive Bars: These visually denote the consolidated directional bias of the market over the reconstructed period. A sustained sequence of Green "Hive Bars" suggests pervasive bullish pressure and an upward path of least resistance, while a series of Red "Hive Bars" indicates dominant bearish control and a clear downward momentum.
+ "Signal Hive Bars" (Distinct Colors): Pay close attention to these specially colored "Hive Bars." They signify critical moments where the reconstructed price action exhibits a particularly strong, high-conviction interaction with its adaptive internal baseline. These often precede or confirm significant market movements and serve as your clearest, most reliable visual triggers for potential shifts in market control.
⛓️ Intermittent Appearance: Observe that "Hive Bars" do not necessarily appear for every single native time unit of your chart. They are intelligently reconstructed and consolidated representations of price action, appearing only when specific internal conditions are met to present a coherent, high-impact view of distinct market phases.
🔗 Harnessing Advanced External Synergy: To unlock a new dimension of analytical power, profoundly enhance your existing indicator suite by integrating the output of "Hive Bars" as the data source for other external indicators. When adding or configuring indicators such as RSI, Stochastic Oscillators, various Moving Averages (EMA, SMA), or any other indicator that prompts for a 'source' input, you can now select the purified output of the "Hive Bars" as your desired data stream.
For oscillators (e.g., RSI, MACD), select the close or a similar relevant output from "Hive Bars" as your source. This allows the oscillator to react to the purified, consolidated momentum of the "Hive Bars" rather than the potentially noisy raw price data, leading to smoother and more meaningful oscillator signals.
For moving averages (e.g., EMA, SMA), utilize the close or other pertinent "Hive Bar" output as your source. This provides an exceptionally smooth, highly responsive, and less choppy average that precisely tracks the true underlying trend as identified by "Hive Bars." This unique capability allows for the construction of powerfully layered and synergistic trading strategies.
📢 Setting Up Proactive Alerts for Critical Events: Leverage the newly incorporated alert capabilities to maintain real-time awareness of pivotal market developments, even when not actively monitoring your charts.
You can now choose to be alerted specifically when a "New Hive Bar Closed" (signifying the definitive completion of a major market phase as identified by the indicator) or when a "New Signal Hive Bar Closed" (highlighting a high-conviction market event that warrants immediate attention due to its pronounced significance).
__________________________________________________________________________
⚠️ LIMITATIONS
While the "Hive Bars" indicator is an incredibly powerful and advanced tool for dissecting market dynamics, it is vital to understand its inherent design parameters and the prevailing platform-specific constraints for optimal and informed utilization:
👉 Visual Gaps in Plotting: Due to current platform limitations pertaining to custom candle plotting functionality, you may occasionally observe visual gaps or intermittent non-contiguous plotting between "Hive Bars" on the chart. They’re not missing data, but a result of strict plotting rules. A bar is only drawn when all internal conditions are met. This ensures accuracy, even if the chart shows some spacing.
👉 Complementary Tool: This indicator excels at providing high-conviction directional insights and identifying significant market phases. However, it is fundamentally designed as a sophisticated complementary tool to a broader trading strategy, not as a standalone, all-encompassing system. Its true power is unlocked when integrated with other analytical methods.
👉 Input Calibration Essential: The efficacy and depth of insights derived from the "Hive Bars" are highly dependent on the careful and thoughtful calibration of its input parameters, including the "Internal EMA Config," "Hive Smoothing" setting. Optimal results necessitate empirical user experimentation and fine-tuning to discover the configurations best suited for specific assets, analytical objectives, and market conditions.
👉 Exclusion of Auxiliary Data: The "Hive Bars" indicator's primary focus is exclusively on transforming and presenting price data. It does not natively incorporate other vital market information such as fundamental economic data, or news events. Integrating these additional analytical layers remains an essential aspect of constructing a truly comprehensive and robust trading strategy.
█ ▒▒▒▒▒▒▒▒▒▒▒▒▒▒▒▒▒▒▒▒▒▒▒ 『•••• ✎ ••••』 ▒▒▒▒▒▒▒▒▒▒▒▒▒▒▒▒▒▒▒▒▒▒▒▒ █
🎯 CONCLUSION
The "Hive Bars" indicator offers an unparalleled, intuitively accessible, and highly adaptable framework for instantly grasping true price momentum and direction through its intelligent, non-repainting reconstruction of market data. By transforming chaotic raw data into strikingly clear, high-conviction "Hive Bars" and dynamic signals, and now with proactive alerts to highlight critical moments, it empowers you to cut through distractions and identify market currents with unprecedented ease. Think of it as a custom lens for the market. It filters out the clutter and shows you the real structure—bars formed not by time, but by intent. It's about seeing the unseen, with enhanced clarity and a deeper understanding of market forces, now with the power to supercharge all your other tools and keep you informed. No fluff. No hype. Just an edge you can actually see—and use.
▣▣▣▣▣▣▣▣▣▣▣▣▣▣▣▣▣▣▣▣▣▣▣▣▣▣▣▣▣▣▣▣▣▣▣▣▣▣▣▣▣▣▣▣▣▣▣▣▣▣▣
🚨 RISK DISCLAIMER
Engagement in financial market speculation inherently carries a substantial degree of inherent risk, and the potential for capital diminution, potentially exceeding initial deposits, is a pervasive and non-trivial consideration. All content, algorithmic tools, scripts, articles, and educational materials disseminated by "Hive Bars" are exclusively purposed for informational and pedagogical objectives, strictly for reference. Historical performance data, whether explicitly demonstrated or implicitly suggested, offers no infallible assurance or guarantee of future outcomes. Users bear sole and ultimate accountability for their individual trading decisions and are emphatically urged to meticulously assess their financial disposition, risk tolerance parameters, and conduct independent due diligence prior to engaging in any speculative activity.
Customcandles
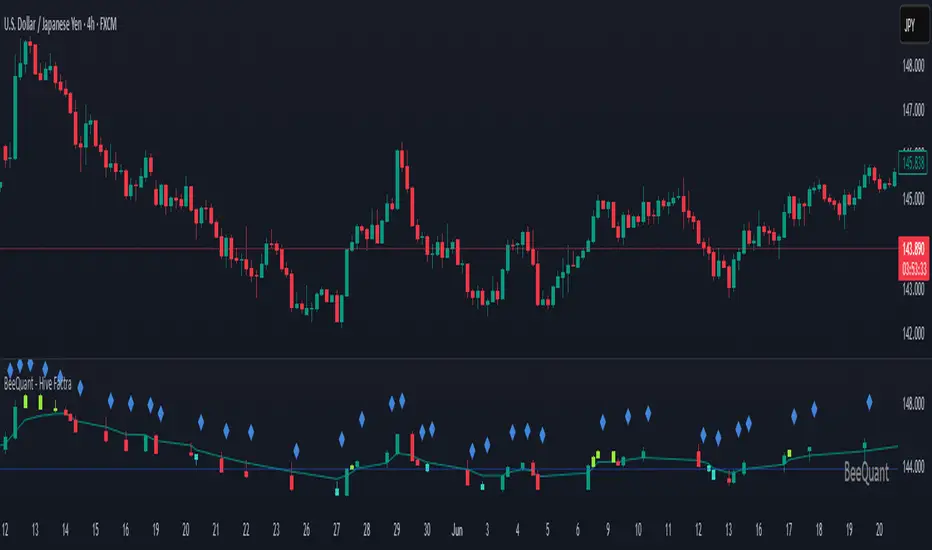
BeeQuant - Hive Factra🔶 OVERVIEW
The "Hive Factra" is a groundbreaking analytical instrument designed to unveil the true essence of market movement, transforming complex price action into powerfully consolidated insights. Imagine having a specialized lens that intelligently reconstructs market periods into unique "Hive Factra Bars," revealing underlying momentum and high-conviction signals often obscured in traditional charts. This indicator cuts through the noise, showing you precisely when significant shifts are occurring by coloring these reconstructed bars with an adaptive precision. It's built for traders who seek unfiltered perspective that helps see hidden patterns and make more decisive moves.
__________________________________________________________________________
🧠 CONCEPTS
Markets move in impulses and compressions. Most trend indicators rely on single-frame slope logic, which often flips during minor pullbacks. Hive Factra takes a different route. At its core, the "Hive Factra" operates on a sophisticated framework that reinterprets market data, presenting it through its proprietary "Hive Factra Bars", unique visualizations that capture the consolidated spirit of price action.
⬜ The "Hive Factra" Reconstruction: Unlike standard candles, "Hive Factra Bars" are intelligently re-engineered representations of market activity. They are derived through a proprietary process that captures the dominant price influence over specific periods, presenting a clearer, more focused view of underlying momentum. These unique bars visually consolidate information, making the core directional bias immediately apparent.
⬜ The Adaptive Baseline: An internal, dynamic analysis line constantly adjusts to market flow, serving as a crucial reference point for the "Hive Factra Bars." This adaptive baseline provides real-time context, helping the indicator precisely determine the significance of each reconstructed bar's movement.
⬜ High-Conviction Coloring & Signal Bars: The "Factra Bars" come to life with a discerning coloring system. While they reflect the primary market direction (Green for upward bias, Red for downward bias), the "Hive Factra" introduces specialized "Signal Hive Bars" with distinct colors. These unique bars appear when the consolidated price action exhibits a particularly strong, high-conviction interaction with the adaptive baseline, acting as powerful visual alerts for moments of heightened significance.
⬜ Session-Aligned Insights: For intraday traders, the "Daily New Start" option provides a unique advantage. When enabled, the indicator can reset its internal reconstruction process with each new trading session, offering fresh, unbiased perspectives tailored to the day's distinct market dynamics.
⬜ Dynamic Sensitivity: A configurable "Offset" allows you to fine-tune the indicator's responsiveness and the thresholds for initiating these "Hive Factra Bars" and "Signal Hive Bars." This ensures the indicator aligns perfectly with your individual trading style and the volatility of the asset you're analyzing.
__________________________________________________________________________
✨ FEATURES
The "Hive Factra" is equipped with a suite of cutting-edge features, all meticulously designed for unparalleled clarity, adaptive responsiveness, and augmented analytical depth:
🔹 Proprietary Hive Factra Bars
Experience a unique visual representation of price action that consolidates market data for enhanced trend and momentum clarity.
🔹 Customizable Internal Analysis Line
Control the underlying adaptive baseline's calculation for precise alignment with market flow, utilizing various price source options.
🔹 High-Conviction "Signal Hive Bars" (Distinct Colors)
Receive specialized visual alerts when Factra Bars exhibit strong, decisive movements relative to the adaptive baseline, indicating moments of heightened market conviction.
🔹 Overbought/Oversold Visuals
Signal Hive Bars highlight areas of potential exhaustion, providing intuitive insight into stretched conditions
🔹 Session-Based Reconstruction
Opt for the "Daily New Start" to reset the indicator's perspective with each new trading day, providing fresh, session-aligned insights.
🔹 Dynamic Offset Control
Adjust the "Offset" parameter to fine-tune the sensitivity of the Factra Bar reconstruction and signal generation thresholds, tailoring the indicator to specific market conditions.
🔹 Non-Repainting Logic for Historical Reliability
Each "Hive Factra Bar" is plotted only when its internal reconstruction conditions are fully met and confirmed. This ensures that the historical display of Factra Bars does not repaint, providing a high degree of reliability and trust in past signals and visualizations.
🔹 Cross-Market Versatility
This indicator is engineered to perform with precision across all major markets—whether you're trading forex, commodities, stocks, or indices. Its adaptive logic automatically aligns with the unique volatility and structure of each asset class, delivering consistently reliable insights no matter where you trade.
🔹 Custom Range Start Marker
A subtle diamond-shaped symbol is plotted to indicate the start of the Hive Factra logic cycle. This marks the bar from which the internal price range begins accumulating until a new Hive Factra Bar is confirmed and displayed. Helps visualize the dynamic evaluation period used in Factra’s structural detection.
🔹 Smart Alerts for Key Events
Get notified in real time when:
◦ A new Hive Factra Bar completes – signaling a fresh structural range reset
◦ A new Signal Hive Bar closes – identifying a potential overbought or oversold condition
Built-in alert conditions make it easy to stay ahead of shifts without watching every candle manually.
🔹 Universal Timeframe Compatibility: The "Hive Factra" is meticulously engineered to perform flawlessly across all timeframes, from rapid intraday charts to long-term weekly and monthly views. This universal compatibility ensures you receive consistent, high-quality insights regardless of your analytical horizon.
🔹 Unrivaled External Indicator Collaboration: A truly unique advantage of the "Hive Factra" is its capability to seamlessly integrate and enhance the performance of other external indicators. Its meticulously processed output, can serve as a highly purified and consolidated 'source' for indicators that accept such inputs (e.g., RSI, StochRSI, moving averages), which allows for more insightful data stream into your favorite indicators, potentially unlocking new levels of responsiveness and signal accuracy for your entire analytical setup.
__________________________________________________________________________
⚙️ USAGE
Integrating the "Hive Factra" into your daily analytical regimen is intuitive and will profoundly enhance your ability to discern crucial market dynamics and spot high-conviction opportunities:
💁 Effortless Application
Simply add the "Hive Factra" indicator to any chart within your TradingView platform. Note that it plots on a separate panel below your main price chart to provide its unique visual output without obscuring price.
📊 Tailored Calibration: Access the indicator's settings to unlock its full potential:
⚙ "Internal EMA Config"
Configure the internal adaptive baseline by choosing its source (e.g., Close, HL/2) and length. This shapes the core reference point for the Factra Bars.
⚙ "Hive Factra"
Decide if you want "Daily New Start" for session-based analysis and choose the "Source" type for how the Factra Bars are built.
🤖 "Offset"
Experiment with the "Offset" percentage to adjust the sensitivity of the Factra Bar's reconstruction. A smaller offset will make the Factra Bars appear more frequently, while a larger one will highlight only more significant movements.
🟩🟥 Green/Red Hive Factra Bars
These indicate the consolidated directional bias of the market over the reconstructed period. A sequence of Green bars suggests sustained bullish pressure, while Red bars point to dominant bearish control.
🚀 "Signal Hive Bars" (Unique Colors)
Pay close attention to these specially colored Hive Factra Bars. They signify moments where the reconstructed price action exhibits a high-conviction interaction with its adaptive baseline, often preceding or confirming significant market moves. These are your clearest signals for potential shifts.
✨ Appearance of Hive Factra Bars
Notice that these Bars do not necessarily appear for every single time unit. They intelligently reconstruct and consolidate price action, appearing only when conditions align to present a coherent, high-impact view of market phases.
🪢 Harnessing External Synergy
To unlock a new dimension of analysis, consider integrating "Hive Factra" as the data source for other indicators:
1. When adding indicators like RSI, StochRSI, or others that prompt for a 'source' input, you can select the "Hive Factra" as the input.
2. For oscillators (e.g., RSI, Stochastic), choose the close or similar output from "Hive Factra" as your source. This allows the oscillator to react to the purified, consolidated momentum of the Factra Bars rather than raw price.
For moving averages (e.g., EMA, SMA), use the close or other relevant Factra Bar output as your source. This provides an exceptionally smooth and responsive average that tracks the true underlying trend.
__________________________________________________________________________
⚠️ LIMITATIONS
While the "Hive Factra" is an incredibly powerful tool for dissecting market dynamics, it's vital to understand its design parameters for optimal use. It does not attempt to front-run reversals or predict market turns. Instead, it focuses on framing price behavior so traders can react with context.
👉 Visual Gaps in Plotting: Due to Tradingview platform limitations with custom candle plotting functionality, you may observe visual gaps between "Hive Factra Bars" on the chart. This occurs because the indicator only plots a Hive Factra Bar when its internal conditions for reconstruction are fully met, and there isn't an 'offset' parameter for custom candles to bridge these visual discontinuities. Importantly, this behavior ensures that each plotted Factra Bar is confirmed and does not repaint, providing reliable historical analysis.
👉 Reconstructed Data, Not Raw Price: It's crucial to remember that "Hive Factra Bars" are not traditional candles. They are a derived visualization that intelligently consolidates price data.
👉 Complementary Tool: This indicator excels at providing high-conviction directional insights and identifying significant market phases. However, it is designed as a sophisticated complement to a broader trading strategy, not a standalone system.
👉 Input Calibration Essential: The effectiveness of the "Hive Factra" is highly dependent on careful calibration of its input parameters, especially the "Offset" and internal EMA settings. Optimal results require user experimentation to find settings best suited for specific assets and timeframes.
👉 Exclusion of Auxiliary Data: The "Hive Factra" focuses solely on transforming price data. It does not incorporate other vital market information such as trading volume, market breadth, or fundamental news. Integrating these additional analytical layers remains essential for a comprehensive trading strategy.
█ ▒▒▒▒▒▒▒▒▒▒▒▒▒▒▒▒▒▒▒▒▒▒▒ 『•••• ✎ ••••』 ▒▒▒▒▒▒▒▒▒▒▒▒▒▒▒▒▒▒▒▒▒▒▒▒ █
🎯 CONCLUSION
The "Hive Factra" offers an unparalleled, intuitive, and highly adaptable framework for instantly grasping true price momentum and direction through its intelligent reconstruction of market data. By transforming chaotic raw data into strikingly clear, high-conviction "Factra Bars" and dynamic signals, it empowers you to cut through distractions and identify critical market currents with ease. Its revolutionary capability for seamless collaboration with external indicators (like RSI, EMA, etc., by using its purified output as their source) means you can elevate the performance of your entire analytical suite to new levels of precision and clarity. Seamlessly integrate this advanced visual tool within your analytical framework to gain a sharper, more confident perspective, and elevate your strategic decision-making in the markets. It's about seeing the unseen, with enhanced clarity and a deeper understanding of market forces, now with the power to supercharge all your other tools.
▣▣▣▣▣▣▣▣▣▣▣▣▣▣▣▣▣▣▣▣▣▣▣▣▣▣▣▣▣▣▣▣▣▣▣▣▣▣▣▣▣▣▣▣▣▣▣▣▣▣▣
🚨 RISK DISCLAIMER
Engagement in financial market speculation inherently carries a substantial degree of inherent risk, and the potential for capital diminution, potentially exceeding initial deposits, is a pervasive and non-trivial consideration. All content, algorithmic tools, scripts, articles, and educational materials disseminated by "Hive Factra" are exclusively purposed for informational and pedagogical objectives, strictly for reference. Historical performance data, whether explicitly demonstrated or implicitly suggested, offers no infallible assurance or guarantee of future outcomes. Users bear sole and ultimate accountability for their individual trading decisions and are emphatically urged to meticulously assess their financial disposition, risk tolerance parameters, and conduct independent due diligence prior to engaging in any speculative market activity.
True Range eXpansion🕯️ TRX — True Range eXpansion
Clean Candle Bodies · Volatility Bands · Adaptive Range Envelope System
Not your grandfather’s candles. Not your brokerage’s bands.
----------------------------------------------------
TRX begins with a simple concept: visualize the true range of every candle, without the noise of flickering wicks.
From there, it grows into a fully adaptive price visualization framework.
What started as a candle-only visualizer evolved into a modular, user-controlled price engine.
From wickless candle clarity to dynamic volatility envelopes, TRX adapts to you.
There are plenty of band and channel indicators out there — Bollinger, Keltner, Donchian, Envelope, the whole crew.
But none of them are built on the true candle range, adaptive ATR shaping, and full user control like TRX.
This isn’t just another indicator — it’s a new framework.
Most bands and channels are based on close price and statistical deviation — useful, but limited.
TRX uses the full true range of each candle as its foundation, then applies customizable smoothing and directional ATR scaling to form a dynamic, volatility-reactive envelope.
The result? Bands that breathe with the market — not lag behind it.
----------------------------------------------------
🔧 Core Features:
🕯️ True Range Candles — Each candle is plotted from low to high, body-only, colored by open/close.
📈 Adjustable High/Low Moving Averages — Select your smoothing style: SMA, EMA, WMA, RMA, or HMA.
🌬️ ATR-Based Expansion — Bands dynamically breathe based on market volatility.
🔀 Per-Band Multipliers — Fine-tune expansion individually for the upper and lower bands.
⚖️ Basis Line — Optional centerline between bands for structure tracking and equilibrium zones.
🎛️ Full Visual Control — Width, transparency, color, on/off toggles for each element.
----------------------------------------------------
🧠 Default Use Case:
With the included default settings, TRX behaves like an evolved Bollinger Band system — based on True Range candle structure, not just close price and standard deviation.
----------------------------------------------------
🔄 How to Zero Out the Bands (for Minimalist Use):
Want just candles? A clean MA? Single band? You got it.
➤ Use TRX like a clean moving average:
• Set ATR Multiplier to 0
• Set both Band ATR Adjustments to 0
• Leave the Basis Line ON or OFF — your call
➤ Show only candles (no bands at all):
• Turn off "Show High/Low MAs"
• Turn off Basis Line
➤ Single-line ceiling or floor tracking:
• Set one band’s Transparency to 100
• Use the remaining band as a price envelope or support/resistance guide
----------------------------------------------------
🧬 Notes:
TRX can be made:
• Spiky or silky (via smoothing & ATR)
• Wide or tight (via multipliers)
• Subtle or aggressive (via color/transparency)
• Clean as a compass or dirty as a chaos meter
Built by accident. Tuned with intention.
Released to the world as one of the most adaptable and expressive visual overlays ever made.
Created by Sherlock_MacGyver

The Ultimate Buy and Sell Indicator: Unholy Grail Edition"You see, Watson, the market is not random—it simply whispers in a code too complex for the average trader. Lucky for you, I am not average."
They searched for the Holy Grail of trading for decades—promises, false prophets, and overpriced PDFs.
But they were all looking in the wrong place.
This isn’t a relic buried in the desert.
This is the Unholy Grail — a machine-forged fusion of logic, engineering, and tactical overkill .
Built by Sherlock Macgyver , this is not a mystical object. It’s a surveillance system for trend detection, signal validation, and precision entries .
⚠️ Important: This script draws its own candles.
To see it properly, disable regular candles by turning off "Body", "Wick" and "Border" colors.
🔧 What You’re Looking At
This overlay plots confirmed Buy/Sell signals , momentum-based “watch” zones , adaptive candle coloring , SuperTrend bias detection , dual Bollinger Bands , and a moving average ribbon .
It’s not “minimalist” —it’s comprehensive .
📍 Configuring the Tool: Follow the Breadcrumbs
Every setting includes a tooltip — read them . They're not filler. They explain exactly how each feature functions so you can dial this thing in like you're tuning a surveillance rig in a Cold War bunker .
If you skip them, you're walking blind in a minefield .
🕰️ Timeframes: The Signal Sweet Spot
Each asset has a tempo . You need to find the one where signals align with clarity —not chaos .
Start with 4H or 1H —work up or down from there.
Too many fakeouts? → Higher timeframe
Too slow? → Drop to 15m or 5m —but expect more noise and adjust settings accordingly.
The signals scale with time, but you must find the rhythm that best fits your asset—and your trading lifestyle .
♻️ RSI Cycle = Signal Sensitivity
This is the heart of the system . It controls how reactive the RSI engine is.
Adjust based on noise level and how often you can actually monitor your charts.
Short cycle (14–24): More signals, more speed, more noise
Longer cycle (36–64): Smoother entries, better for swing traders
Tip: If your signals feel too jittery, increase the cycle. If they lag too much, reduce it.
📉 SuperTrend: Your Trend Bias Compass
This isn’t your average SuperTrend. It adapts with RSI overlay logic and detects market “silence” via EMA compression— turning white right before the chaos . That said, you still control its aggression.
ATR Length = how many bars to average
ATR Factor = how tight or loose it hugs price
Lower = more sensitive (more trades, more noise)
Higher = confirmation only (fewer, but stronger signals)
Tweak until it feels like a sniper rifle.
No, you won’t get it perfect on the first try.
Yes, it’s worth it.
🛠️ Modular Signals: Why Things Fire (or Don’t)
Buy/Sell entries require conditions to align. The logic is modular, and that’s on purpose.
RSI signals only fire if RSI crosses its smoothed MA outside the dead zone and a “Watch” condition is active.
SuperTrend signals can be enabled to act on crossovers, optionally ignoring the Watch filter .
Watch conditions (colored squares) act as early recon and hint at possible upcoming trades.
Background color changes are “pre-signal warnings” and will repaint . Use them as leading signals, not gospel.
Want more trades? Loosen your filters .
Want sniper entries? Lock them down .
🌈 Candles and MAs: Visual Market Structure
Candles adapt in real-time to MA structure:
Green = bullish (above both fast/slow MAs)
Yellow = indecision (between)
Red = bearish (below both)
Buy/Sell signals override candles with bright orange and fuchsia —because subtlety doesn’t win wars .
You can also enable up to 8 customizable moving averages —great for confluence , trend confirmation , or just looking like a wizard .
🧠 Pro Usage Tips (TL;DR for Smart People):
Use tooltips in the settings menu —every toggle and slider is explained
Test timeframes until signal frequency and reliability match your goals
Adjust RSI cycle to reduce noise or speed up signals based on how frequently you trade
Tweak SuperTrend factor and ATR to fit volatility on your asset
Start with visual confirmation :
• Are watch signals lining up with trend zones?
• Are backgrounds firing before price moves?
• Are candle colors agreeing with signal direction?
📣 Alerts & Integration
Alerts are available for:
Buy/Sell entries (confirmed or advanced background)
Watch signals
Full band agreement (both Bollinger bands bullish or bearish)
Use these with webhook systems , bots , or your own trade journals .
Created by Sherlock Macgyver
Because sometimes the best trade…
is knowing exactly when not to take one.

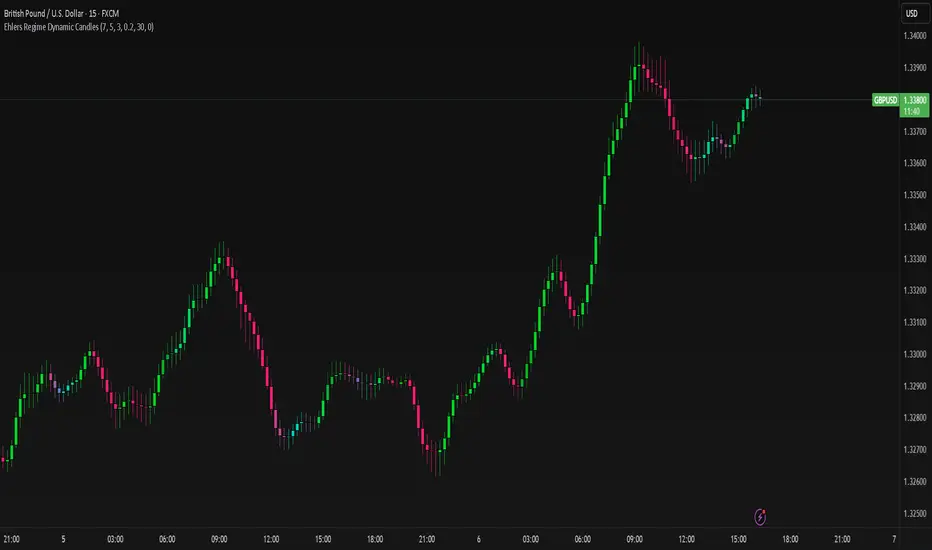
Ehlers Regime Dynamic CandlesCore Calculation Mechanism
The indicator uses advanced Ehlers signal processing techniques to identify market regimes and create dynamically colored candles that reflect market conditions.
Super Smoother Filter: Price data (open, high, low, close) is processed through an Ehlers Super Smoother Filter to reduce market noise while preserving important price movements. This creates a clearer signal for regime detection.
Autocorrelation Analysis: The core of regime detection uses autocorrelation functions at different lag periods:
Primary autocorrelation measures correlation between the current price and its previous value
Trending autocorrelation measures longer-term persistence in the data series
These values combined determine if the market is in a trending or choppy regime
(Image showing Ehlers custom candles vs default candlesticks)
Regime Strength Calculation:
-Raw signal from autocorrelation with user-defined threshold adjustment
-Adaptive scaling based on sensitivity parameter
-Optional volume validation that confirms signal strength using volume data
-Normalization to 0-1 range and smoothing for visual consistency
-Percentile ranking to provide contextually meaningful strength values
Fisher Transform: Applied to the smoothed price to identify statistical extremes, which helps adjust transparency levels during significant price movements.
Key Features & Components
Regime Detection: Identifies trending vs. choppy market conditions using Ehlers' autocorrelation techniques.
Dynamic Candle Coloring: Candles transition smoothly between three color states:
Bullish trending (typically green/teal)
Bearish trending (typically red/purple)
Choppy/neutral (typically blue/silver)
Volume Validation: Optional incorporation of volume data to confirm trend strength (stronger volume during trending periods increases confidence).
Adaptive Transparency: Candles become more opaque during statistically significant price movements based on Fisher Transform values.
Gradient Smoothing: Controls the visual transition between regime states for a more aesthetically pleasing appearance.
Customizable Colors and Style: Full control over all visual aspects including candle body/wick colors and transparency.
Configuration Options
Users can adjust the following parameters in the indicator settings:
Main Settings:
Cycle Length: Controls the lookback period for cycle detection. Lower values increase responsiveness but may introduce noise.
Gradient Smoothness: Determines how quickly colors transition when regime changes.
Trend Detection Threshold: Sets the autocorrelation strength required to classify a trend.
Trend Sensitivity: Scales regime strength calculation to produce a better distribution of values.
Use Volume: Toggles whether volume data is used to validate trend strength.
Color Settings:
Trending Regime Colors: Separate color options for bullish and bearish candle bodies and wicks.
Choppy Regime Colors: Color options for candle bodies and wicks during sideways/neutral markets.
Style Settings:
Candle Border Options: Toggle borders and adjust their color and transparency.
Adaptive Transparency: Enable/disable dynamic transparency based on statistical significance.
Base Transparency: Set the baseline transparency level for all candles.
Interpretation Notes
Color Transitions: As the market shifts between regimes, candle colors gradually transition, providing visual cues about market structure changes.
Regime Strength: The intensity of colors indicates the strength of the detected regime:
Strong trending regimes show vibrant trending colors
Weak or mixed regimes display colors closer to the choppy/neutral color
Transitions between regimes show gradient colors
Transparency Changes: More opaque candles indicate statistically significant price movements, while more transparent candles suggest routine or less significant price action.
Volume Interaction: When volume validation is enabled, trending colors become more pronounced during high volume trends and subdued during low volume periods.
Disclaimer: These are custom candles that are significantly different from normal candlesticks.
Unlike traditional candlesticks that display raw price data, these candles:
• Use Ehlers signal processing to filter and smooth price data
• Dynamically change color based on detected market regimes
• Show statistical significance through transparency
• May appear delayed compared to standard candles due to the filtering process
Traditional trading strategies dependent on candlestick patterns will not work with these.
Risk Disclaimer
Trading involves significant risk. This indicator is provided for analytical purposes only and does not constitute financial advice. Past performance is not indicative of future results. Use sound risk management practices and never trade with capital you cannot afford to lose. The Ehlers Regime Dynamic Candles indicator should be used as part of a comprehensive trading approach, not as a standalone trading system.
Machine Learning Adaptive Trend Toolkit [Velowave]The Machine Learning Adaptive Trend Toolkit is a technical analysis tool that combines adaptive algorithms with comprehensive market feature extraction to provide insights into changing market conditions. Unlike static indicators with fixed parameters, this system continuously analyzes and adapts to the evolving market environment.
Core Technology
At the heart of this system is a dynamic approach to market analysis:
• Feature Engineering Pipeline: Extracts and normalizes volatility, momentum, volume, and trend strength metrics
• Market Regime Classification: Identifies 10 distinct market environments including trending, ranging, breakout, and reversal conditions
• Parameter Optimization: Automatically adjusts sensitivity based on detected market conditions
• Dynamic Wave Technology: Creates adaptive support/resistance levels that respond to changing volatility
⚠️ Signal Interpretation
Important: The indicator's wave crosses should be interpreted as trend change signals rather than direct buy/sell recommendations. These signals represent potential trend changes based on adaptive parameters, but require confirmation from other analysis before making trading decisions.
(Image showing example color customizability)
Custom Candle Behavior
The custom candlesticks in this indicator are designed to enhance trend visualization but will behave differently than default candlesticks:
• They use linear regression smoothing to reduce noise
• Their coloring is based on position relative to the adaptive wave, not merely open/close relationships
• They may show different patterns than traditional candlesticks on the same chart
• Trading strategies developed using traditional candlestick patterns may not apply directly to these custom candles
This modified representation helps visualize trend conditions more clearly but should be understood as an analytical tool rather than a direct replacement for traditional price action analysis.
Practical Applications
• Trend Identification
The adaptive wave system provides clear visualization of trend direction and strength, with dynamic support and resistance levels that adjust to current volatility conditions.
• Volatility-Adjusted Analysis
Parameters automatically optimize during high and low volatility periods, preventing false signals during consolidation while remaining responsive during breakouts.
• Regime-Based Strategy Selection
Knowing the current market regime allows you to apply appropriate trading techniques for specific conditions rather than using a one-size-fits-all approach.
• Visual Price Action Analysis
Enhanced candlestick coloring instantly communicates price position relative to the adaptive trend, helping you process market information more efficiently.
(Image showing only the supertrend wave and dynamic moving average)
Technical Components
• Adaptive Wave Algorithm: Creates dynamic support/resistance bands based on volatility, volume, and detected regime
• Dynamic Moving Average: Period automatically adjusts based on market conditions - shorter in trending markets, longer in ranging conditions
• Market Regime Engine: Continuously analyzes feature patterns to classify current conditions
• Custom Candlestick Visualization: Provides instant visual feedback on trend position and momentum
Implementation Details
For full transparency, the core calculations include:
• Volatility normalization through comparative ATR analysis
• Momentum feature extraction using multi-timeframe momentum indicators
• Trend strength quantification through price structure analysis
• Regime detection through feature pattern recognition
• Adaptive parameter adjustment based on detected market conditions
The system uses only historical and current price data for its calculations and analyses. It does not use predictive methodologies that could lead to misleading results. The indicator will show different values on an open bar than it will after the bar closes, which is standard behavior for indicators that use closing prices in their calculations.
Risk Disclaimer:
Trading involves significant risk. This indicator is designed as an analytical tool to enhance decision-making, not as a standalone trading system. Past performance is not indicative of future results.

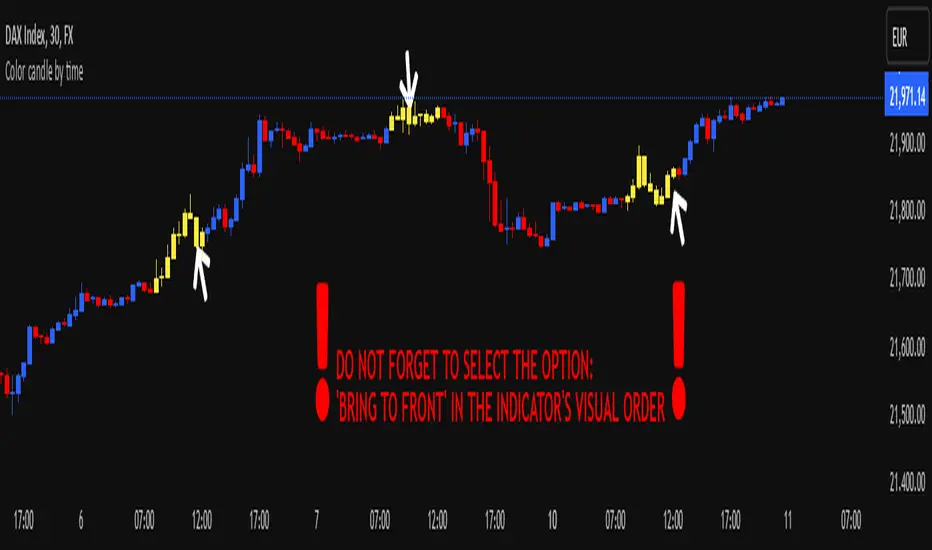
Color candle by time
This indicator, written in Pine Script v5, allows you to highlight candles (using a user-selected color) that fall within a user-defined time range. Candles outside this range maintain their original appearance.
How it Works and Key Benefits:
- Time Interval Customization: By specifying start and end hours/minutes, you can emphasize only the desired market session.
- Choice of Preferred Color: The body, wicks, and borders of the candles within the selected range are uniformly colored, based on the user’s chosen tone.
- Enhanced Focus on Price Action: By focusing on the most relevant trading hours, your analysis becomes more streamlined and intuitive, without altering the rest of the session’s candle appearance.
!! DO NOT FORGET TO SELECT THE OPTION: 'BRING TO FRONT' IN THE INDICATOR'S VISUAL ORDER !!
[FR]Custom Candles/FVG/nSideBarCustom Candles /FVG/ nSideBar
- I used this as a learning project for understanding plot()'s Better
- My goal was to see if I could use normal plots to cleanly plot FVGs on the chart using only plots with out and boxes/lines
The problem was if multiple FVGs were on back to back bars the plot fill would fill the line to the next FVG/Bar
I solved this by using 4 plots and alternating them if consecutive FVGs form
- 2 MODES
- Slim
- Normal
//////////////////////////////////////////////////////////////////////////////////////////////////////////////////////////////////////////////////////////////////////////////
-Slim
Uses 3 plotcandle() parts and divides the candle between body/wicks/open and close
by manipulating the ohlc inputs and the colors I was able to pretty make them full customizable
all components are customizable with up/down colors
-Normal
These are your normal candles but they are full customize able from components to individual up/down colors
--------------------------------------------------------------------------------------------------------------------------------------------------------------------------------------------------------------------------------------------------------
- FVGs
There are 2 FVG settings can be used with both MODES
- Big
These are the FVGs that use plots and since there isn't a 500 object limit on plots you don't need to manage them in the code and they are there how ever far you need to look back
- Slim
These use a Line and the width of the line can be adjusted for user preferences
--------------------------------------------------------------------------------------------------------------------------------------------------------------------------------------------------------------------------------------------------------
- INSIDE-BARS
These will change the color of the body of either SLIM or NORMAL Candles
--------------------------------------------------------------------------------------------------------------------------------------------------------------------------------------------------------------------------------------------------------
Drawing Snap Features Work Just Fine!
I suggest hiding your chart candles with the eye in the top left of the screen and moving the indicator to the top of your object tree
I understand that the candles in the chart pictures are impractical I was just demonstrating the functionality of the tool
Hope You Enjoy!!
FFriZz

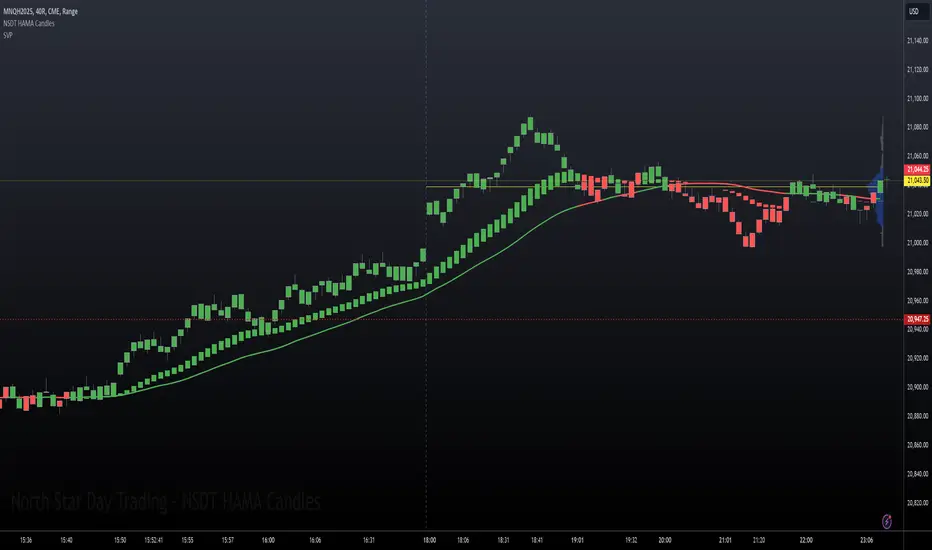
NSDT HAMA CandlesHAMA (Heiken-Ashi Moving Average) Candles are built using different moving average lengths for the open, high, low, and close. Those levels are then run through the Heiken-Ashi Candle formula to create a new hybrid candle on the chart. There is an additional Moving Average plotted as well for overall direction.
This may be used best for identifying trending markets. By referencing the HAMA Candle indicator, it may help guide you to stay in a trade a bit longer, or wait a bit longer before entering at the beginning of a potential trend.
We added a Gradient Color scheme option for a more colorful view of potential trend directional changes. The gradient code is taken from the Pinecoders Gradient Framework (Pro Advance/Decline Gradient example) at
There are three different Moving Average types to choose from. (EMA, SMA, WMA). All MA lengths can be modified. All colors can be modified. All options can be turned on or off.
This was previously an "invite-only" indicator, but we decided to publish it publicly and open source.
Harmonic Patterns - Custom CandlesHello Traders,
Here is an experimental indicator created to plot harmonic patterns on indicators. This can be used for confirmation of oversold and overbought regions. However please note that oscillator movements does not always correlate with price movements. Hence, there was no concrete way to log the trade statistics and measure performance.
⬜ Process
▶ Derive custom candles
There are two types of candles used in this script
Oscillator Candles - derived based on oscillators - cci, cmo, cog, mfi, roc and rsi.
Band Candles - Candles derived based on percentage range of Bands. Available options - Bollinger Bands, Keltner Channel and Donchian Channel
▶ Draw zigzag
Single zigzag is used in this indicator. However, multiple zigzags can also be used.
▶ Apply harmonic pattern calculations
Use the logical calculations to derive harmonic patterns.
More experiments need to be done on using the indicator along with regular harmonic patterns on chart.

NSDT Bearish-Bullish CandlesThis is another interesting take on candlesticks . These Bearish-Bullish Candles do not show the wicks. Instead, the upper wick is made into a Red body and the lower wick is made into a Green body. If you match the candle body color in the chart settings (or turn off the candles completely), you get a unique way of seeing how Bearish or how Bullish a candle is because the wick will now match the body size and color.
This indicator is very similar to our NSDT Special High-Low Candles.
