™TʀᴀᴅᴇCʜᴀʀᴛɪsᴛ Tʀᴇɴᴅsᴇᴛᴛᴇʀ™TradeChartist Trendsetter is an elegantly designed functional indicator that helps spot price trends based on user input and volatility to generate high probability BUY and SELL signals.
1. What does ™TradeChartist Trendsetter do?
Plots high probability BUY/SELL signals based on user input and price volatility.
Plots recommended Stop Loss and SOS signals.
Plots regular RSI divergences based on user input.
Plots Linear Regression trend lines based on user input.
Displays Trendsetter Dashboard with useful trade information.
Displays real time gains tracker.
Tracks another symbol on Dashboard based on user input.
Alerts when BUY and SELL signals are generated.
2. What markets can this indicator be used on?
Forex
Stocks - Signal prices calculated taking gaps into account.
Commodities
Cryptocurrencies
and almost any asset on Trading View.
Works really well when there is good volume, volatility or both in the asset traded/observed.
3. Do the indicator signals repaint?
No. Once the BUY and SELL signals are generated with entry price (open price of signal candle), there is no repainting.
This can be verified using Trading View Bar Replay to check if the signals stay in the same candle in real-time as the Bar Replay.
4. Does the indicator send alerts when a signal is generated?
Yes. Traders can get alerts by setting up Trading View alerts for BUY/SELL signals. For confirmed BUY/SELL alerts, 'Once Per Bar' must be used as there is no need to wait for the candle close.
Example Charts
GBP-USD 1hr chart with indicator plots description
GOLD 4hr chart using Daily HTF resolution from indicator settings.
SPX 15m chart using Daily HTF resolution with RSI divergences.
Note: Default settings work really well for most assets and time frames. Change HTF resolution (default 4hr) from indicator settings and make sure it is higher time frame than the chart resolution.
Divergence

OBV with DivergenceAll I did was combine the logic from LazyBear for his OBV Oscillator to regular RSI divergence logic (where I replaced the RSI input to use LazyBear's OBV).
I didn't use any original code! Neither OBV (written by LazyBear) nor DIvergence (author unknown) was written by me. I merely modified the sytax a little to combine them.
Very useful for spotting divergences with OBV oscillator.

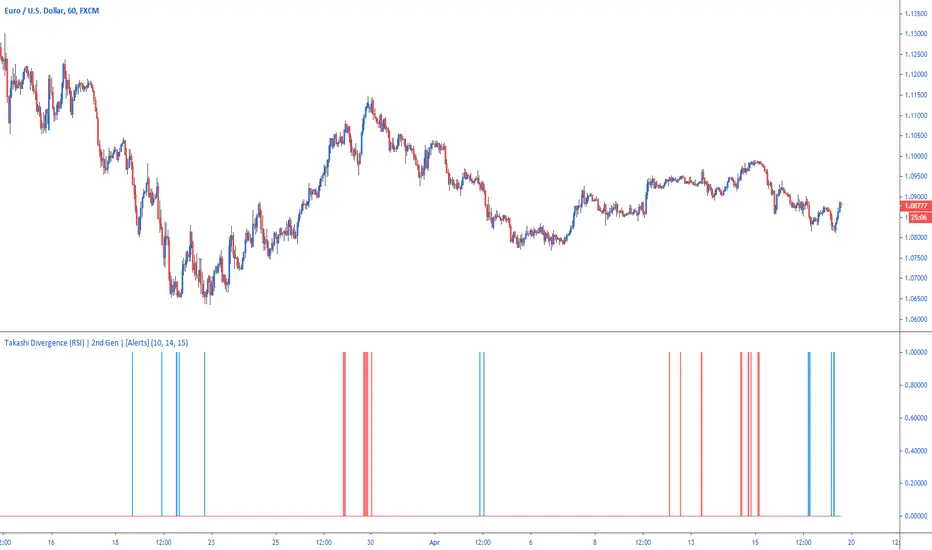
Takashi Divergence (RSI) | 2nd Gen | [Alerts]Easily highlight positive or negative divergence between price movement and RSI with Takashi-powered Divergence analysis.
Divergence strategy signals a potential reversal point because directional momentum does not confirm price. A bullish divergence occurs when the underlying market makes a lower low and RSI forms a higher low: RSI does not confirm the lower low and this shows strengthening momentum. A bearish divergence forms when the market records a higher high and RSI forms a lower high: RSI does not confirm the new high and this shows weakening momentum.
Inputs
Divergence Sensitivity
Float input. Sets a threshold after when the RSI divergence is triggered.
RSI Length
Integer input. The default setting used by most traders for the RSI is 14. That means that the indicator will go back 14 periods or time frames based on the chart being used (14 days on a Daily chart , 14 hours on an hourly chart and so forth) and make its calculation based on that.
Cross Distance
Integer input. Value from RSI that above or below 50 that classifies bullish or bearish levels. By default 15, that means the script will be checking for positive divergence when RSI is below 35 (50-15) and negative divergence when RSI is above 75 (50+15).
Use High & Low
Bool input. If true uses high and low values as RSI source.
To get access to this and other scripts check links below.
Accelerator Oscillator DivergencesDiscover divergences found by the Accelerator Oscillator indicator.

ScalpyScalpy is made up of a 2 main parts.
- The cloud comprising of a 10 period SMA and a 30 period SMA.
- When the cloud is green you should be looking for long entries.
- When the cloud is red you should be looking for short entries.
- Price is most bullish above a green cloud and most bearish below a red cloud.
- Being within the cloud indicates indecision.
The blue and white lines on the indicator show the relationship between price and momentum.
They can be used to spot reversals in two ways:
- The first is a divergence between price (blue line) and RSI (white line)
- If the price makes a lower low but the RSI makes a higher low this shows the trend is weakening and may be reversing soon (as can be seen by the two yellow lines on the chart).
The second is a simple crossover:
- When the white line crosses the blue line to the upside this signals a long entry.
- When the white line crosses the blue line to the downside this signals a short entry.

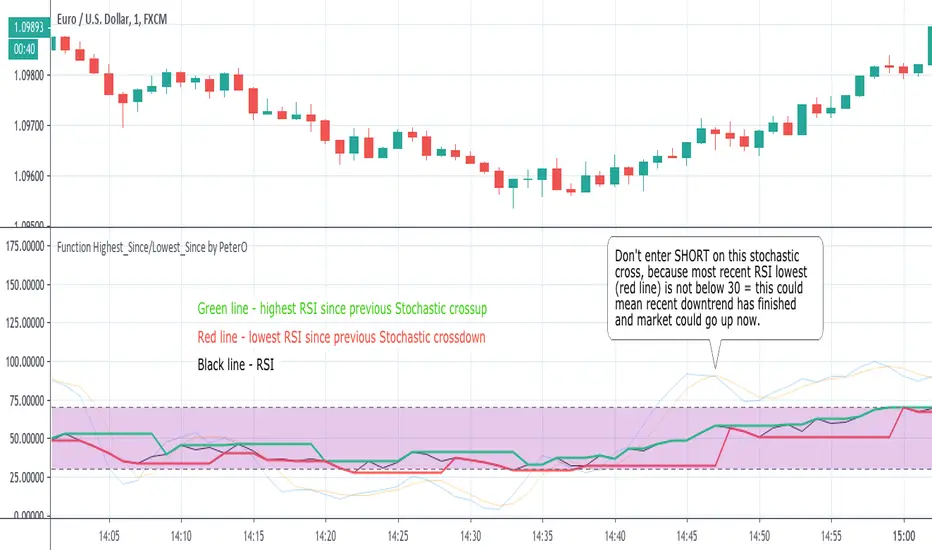
Function Highest/Lowest by PeterONo matter how much I like PineScript, there are still things missing in the language. One of the most annoying issues is that you cannot set dynamic length value for highest/lowest functions. This length must be fixed integer. But it doesn't make sense in a lot of cases, when you'd like to know what was the highest/lowest value of a series SINCE EVENT in the past, but you don't know WHEN this event exactly happened.
Us, coders would like to do this: `highest(series,barssince(...))`
But it is not working.
Numerous coders are using RicardoSantos' f_highest/f_lowest script (), probably the most often copy/pasted snippet of PineScript code out there. It is doing more-less what `highest(series,barssince(...))` would be doing, but with hardcoded max bars back.
Ricardo is my idol by the way, but that didn't stop me from creating my own version of Highest/Lowest functions. They are fast, simple, effective and very light for Pine engine.
Please treat this as an OPEN SOURCE snippet of code, which can be used in variety of ways.
I have implemented a simple use-case myself, to demonstrate what can be done. The example shows what was the highest/lowest value of RSI since the previous cross of Stochastic. So that you don't enter SHORT on Stochastic crossunder, if RSI didn't reach oversold (<30) since the previous Stochastic crossunder = aka maybe the downtrend has exhausted.
I'm sure you'll find plenty of use cases for it in your studies and strategies as well. If you create your own code using my Highest/Lowest functions, don't hesitate to put a link down here in comments.
P.S. This is not a strategy in any way, so don't ask me "does it backtest well?".
P.S.2 This code doesn't repaint as well ;)
Trend FollowerHello Traders!
While analysing the charts, one of the biggest problem is to see if there is trend or not, or is it in a congestion zone/area? While thinking about it, I found the idea to analyse moving averages in channel and their momentum according to channel width.
How it calculates and works?
On each bar it creates a channel by highest/lowest point of a MA. highest point is upper point and lowest point is lower point of the MA channel,
It gets highest and lowest point of last 300 bars, (say Price Channel )
If the width of MA channel is greater than certain rate of price channel then it decides there is trend
After it decided there is trend, it calculates the rate between channel and MA. Bigger result means stronger trend.
According to rate of MA channel and the price channel , bar color becomes lighter/darker. so when you look at the bar color you can see the trend strength.
Short explanation on the chart:
Also by changing channel or size other options (such MA length etc) you can see congestion zones/areas:
Another one, about trend direction and its strength:
Options:
You can choose following MA types as source: EMA, SMA , RMA, WMA , VWMA
"Period to Check Trend" is the period to create MA channel. Bigger period cause more sensitivity.
MA Period is the Length of the MA that will be checked
"Trend Channel Rate %" is rate of price channel . Price channel created by using highest/lowest of last 300 bars. I did this to make the script works on all time frames correctly.
"Use Linear Regression" is used to get rid of noise. it may cause 1-2 bars latency. (I use it)
The idea was created by LonesomeTheBlue.
Enjoy!

Stoch tripleThe script has combined the three Stochastic oscillators into one.
It analysed divergences of indicators depending on the flow of stock price, a circle mark or text mark displayed.
The maroon and red marks mean a fall, while the green and lime marks mean a rise.
Especially red and lime of mark are strong signs of decline or rise.
I hope you can make a successful investment by using three Stochastic oscillators properly.

Correlation Coefficient {Cybernetwork}Correlation Coefficient (CC): with CC momentum and acceleration oscillators, and momentum-divergence indicator.

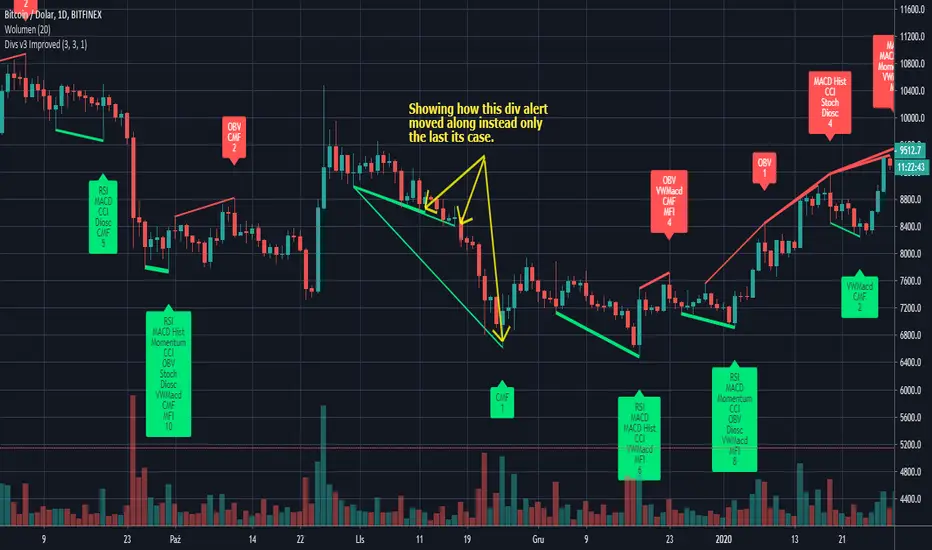
Divergence for many indicator v3 ImprovedThis is a modificated version of original script by @LonesomeTheBlue (Thank you for giving me rights to use your code with my modification in invite-only format):
I made few changes to lessen the amount of divergences generated on the chart and how they moved along (lines without cloud with text) instead only the last cases that may be missleading for some (especially when you would use that code to generate alerts).
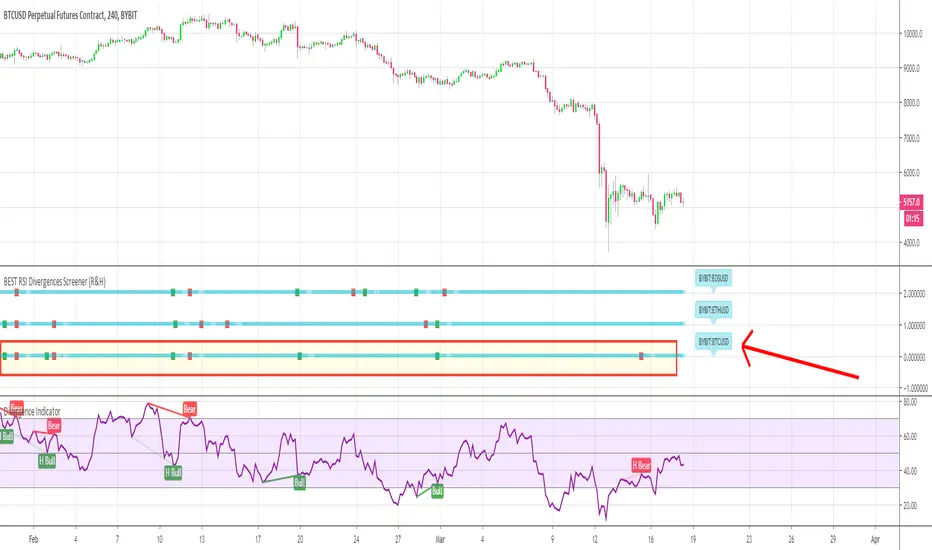
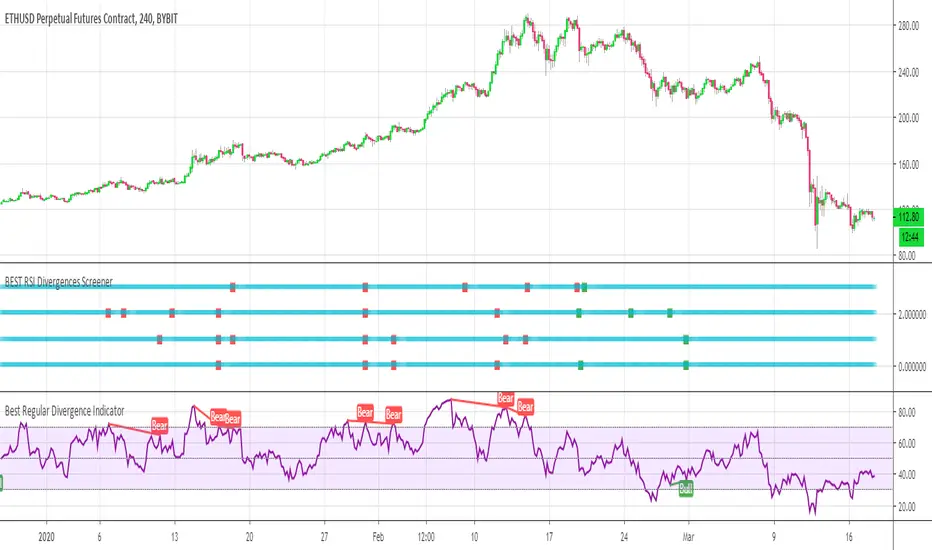
BEST RSI Divergences Screener (Regular and Hidden)Hello traders
My way to fight this situation is to stay productive.
Hope some of my scripts will help you out as most of us are locked-down at home, hence have more time for trading - and preparing ourselves when the sun will shine on us again
I - Concept
This is an upgrade of this script which captured only the regular divergences
This screener detects whether the regular RSI divergences based on the TradingView Divergence built-in indicator (made by the gentleman @everget I believe)
With this screener, you can see in 1 view which of your favorite cryptos/stocks/forex pairs/etc. showing strong regular and hidden divergences
The gentlemen (and demoiselles) traders can play with the lookback/ranges inputs to adjust the divergences based on what they think is best of their trading/timeframe/instrument/life
On that script screenshot, I'm showing the BYBIT:BTCUSD part of the screener matching with the divergences on the chart
II - How did I set the screener
The visual signals are as follow:
- square: whenever a regular or hidden divergence is detected
Then the colors are:
- green when there is bullish divergence
- red when there is bearish divergence
🔔🔔 I also added the alerts for capturing those bullish/bearish divergences
III - Does it repaint?
It should not :)
Best regards
Dave
BEST RSI Divergences ScreenerHello traders
I hope you're all hanging on at home with what's going on these days...
The good news is.... it gives us more time to trade ^^.... #positive #attitude
I - Concept
This screener detects whether the regular RSI divergences based on the TradingView Divergence built-in indicator (made by the gentleman @everget I believe)
With this screener, you can see in 1 view which of your favorite cryptos/stocks/forex pairs/etc. showing strong divergences
The gentlemen (and demoiselles) traders can play with the lookback/ranges inputs to adjust the divergences based on what they think is best of their trading/timeframe/instrument/life
On that script screenshot, I'm showing the BYBIT:BTCUSD part of the screener matching with the divergences on the chart
II - How did I set the screener
The visual signals are as follow:
- square: whenever a divergence is detected
Then the colors are:
- green when there is bullish regular divergence
- red when there is bearish regular divergence
Best regards
Dave
[JOHN] KNIFE CUThEY HELLO PEOPLE, THIS IS KNIFE CUT
This indicator work in sync with SUPER BOSS , check it.
KNIFE CUT
You can consider this as "BUY THE DIP" that is the best part of it. "BUY WHEN THE AREA IS BACK TO GREEN".
Is a special indicator with 2 metrics you can use for be a better trade and stop losing money entering useless positions.
This indicator can:
The Area in the center measure "Market cycles" check below, and "BUY PRESSURE", check the reaction with the price action, impressive? i know.
About the bars green or red, are trend bars, compare it to the price action and you can see that these bars catched all uptrends and downtrends.
(you can change also resolutions of background bars, current H4 resolution if you watch lower timeframes.)
*BUY PRESSURE / TREND BACKGROUND BARS
*MARKET CYCLES
This script work with every exchange and pairs, also forex.
See price history.
You not believe? i believe.

ZFelds Stoch Cubed³Three Stochastic Lengths combined into one unit based on the Stochastacult Strategy.
Thanks to Krown and The Caretaker for the inspiration for this indicator.
Pink = Fast Plot
Red/Orange = Medium Plot
Blue/Green = Slow Plot
Purple Zone = Bearish Control Zone
Blue Zone = Bullish Control Zone
The indicator is used in the following fashion for optimal scalping entries/exits especially.
Long Entries: Look for the fast (Pink) Plot to cross upwards through the Medium AND Slow Plots in the Bearish Control Zone (Purple Zone)
Short Entries: Look for the fast (Pink) Plot to cross DOWNWARDS through the Medium AND Slow Plots in the Bullish Control Zone (Blue Zone)
~~~~
Pink Crossing Red/Orange plots = earlier signal
Pink Crossing Blue/Green plots = later signal (often continuation signal)
~~~~
These postures can hold even more weight when aligned with divergence, horizontal levels, moving averages, Bollinger bands, etc.
~~~~

Rsx Divergence Candle OverlayRSX Divergences on candles instead of in an oscillator to save space.
Divergences do not repaint and have instant confirmation.
RSX source used: Lazybear's

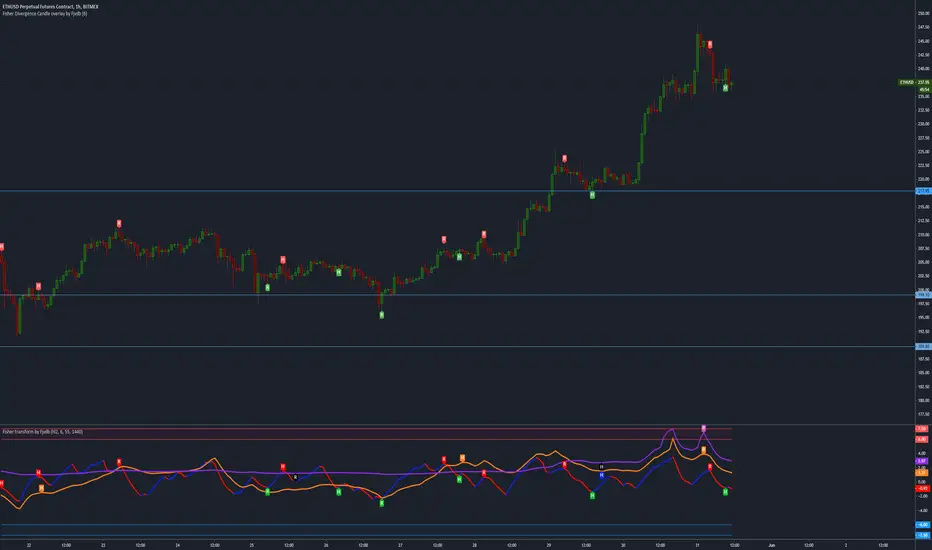
Fisher Divergence Candle OverlayOverlays Ehler's Fisher oscillator divergences on candles, handy for saving space on charts.
Haos Visual DivergencesThe Haos Visual is a trend indicator consisting of two WIlliams % indicators.
I have added divergences to spot trend reversals within assets, divergences have no repaint and require single candle confirmation.
www.prorealcode.com

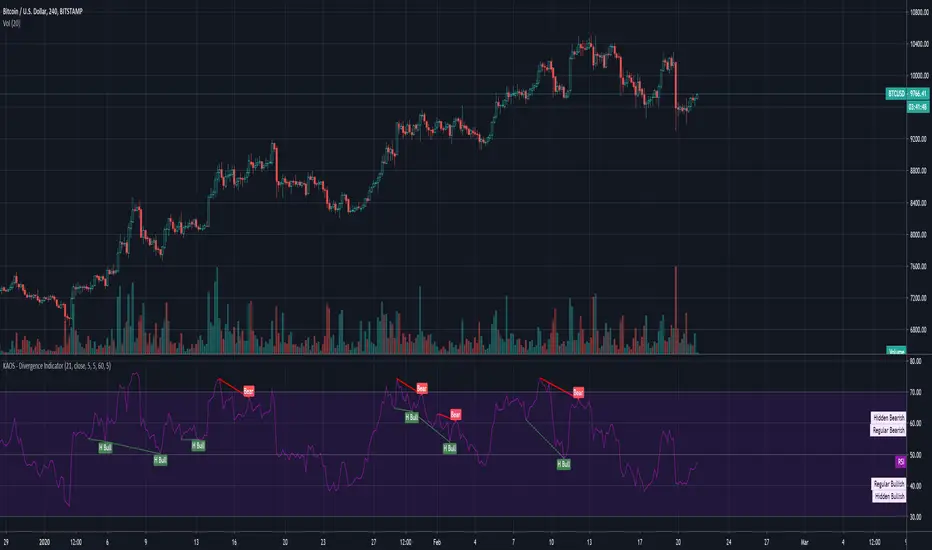
KAOS - Divergence IndicatorDivergence Indicator... Works pretty well, Use with caution as it does amend itself depending on market whale activity.
1hr, 4hr and Daily good for macro movements.
Should be used a supplemental indicator to your over all strategy NOT as a entry exit.
Have fun :)
Made by someone else, but has been tweaked with better settings
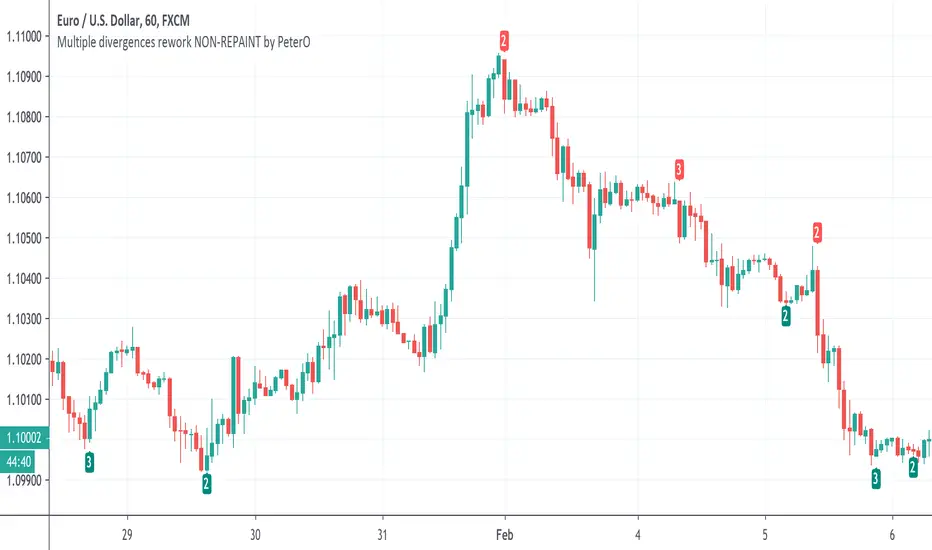
Multiple divergences NON-REPAINT by PeterODivergences are well-known tool for finding trend reversals. Powerful, yet... unreliable. Sometimes they show up, sometimes they don't. Sometimes they really mean trend end, sometimes the trend continues. I've witnessed countless discussions about which indicator to hunt for divergences on. All pointless.
Earlier today I found a very inspirational script by Lonesometheblue, combining multiple divergences together. Actually - summing them up and showing hunted divergences count in a label. Because if a divergence shows up on a single indicator like RSI, it can indeed mean trend reversal, but... yeah, check previous pargraph. But if this divergence shows up on 8 different indicators at the same time, then chances increase, don't they?
I decided to do my own version of Lonesome's indicator, because that one is using Label.New, which doesn't allow analysing entire script, only latest 50 occurences or so. I'm not going to hide it - I copy-pasted a lot from Lonesome's code. And from Everget's built-in divergences script, which you can find in PineScript/New. I didn't even bother to modify variable names or cover tracks in any other way, pretending it is my work from scratch. All with these two gentlemen consent and blessing. I added labels from myself, plus bit of rework and here it is:)
I hope you'll find it useful.
P.S. While analyzing divergences today, I discovered one thing. Hidden divergences are not useless, as many people think. But they should be used at trend dips to join the trend, not at trend ends, as reversals. Experiment yourself.
P.S.2 Still, never use only divergences. They need confirmation, they are not self-fulfilling prophecy.
unRekt - Dogs of WarThis indicator includes StochRSI, RSI and a double RSI-EMA. By combining StochRSI with the RSI , it becomes very powerful for directional moves. The double EMA-RSI powerful in itself, helps filter out typical noise by showing trend strength allowing for greater profits by holding the trade longer.

Market Waves Omega All-In-One IndicatorMarket Waves Omega Indicator consists of 5 separate indicators wrapped into one display area, which makes it easy to see all the information in one go.
Momentum waves
The main area of Market Waves Omega Indicator are the momentum waves, this shows bear and bull divergence as shown on the diagram below:
The idea here is that you are looking for a big momentum wave, followed by a smaller trigger wave. At that point, the price will move accordingly. Note the lighter blue peaks, when these light blue peaks cut in, it’s the end of that trend and the actual trigger point. The wave is not complete until the close of that candle.
The best way to use Market Waves Omega Indicator is to work on the higher time frames first, to get a bigger picture of where the market is moving. So on the daily, if it looks bullish, then you should be looking for bull triggers on the smaller time frames to trade.
VWAP
The next indicator that needs to be considered is the VWAP, shown on the diagram above in yellow. VWAP is volume-weighted average price and shows where the volume is on a positive or negative position. This is typically used by traders on the smaller time frames but gives the user an idea of where the main buyers or sellers are at that point.
RSI
Another indicator within Market Waves Omega Indicator is the RSI, which every trader uses to get an idea of whether the price is overbought or oversold:
Money Flow
The Money Flow Index (MFI) is a technical oscillator that uses price and volume for identifying overbought or oversold conditions in an asset. It can also be used to spot divergences which warn of a trend change in price:
Stoch RSI
Stochastic RSI oscillator was developed to take advantage of both momentum indicators in order to create a more sensitive indicator that is attuned to a specific security's historical performance rather than a generalized analysis of price change.
Green Dots
One of the biggest indicators use to trade off the Market Waves Omega Indicator are green dots :
The green dots are showing when the RSI is super low and therefore should spark some buying pressure due to market being oversold.
One great thing about Market Waves Omega Indicator is that all the data is in one place, and you can see a lot of information, making it easier to scroll through the different time frames at speed and understand the general market position.

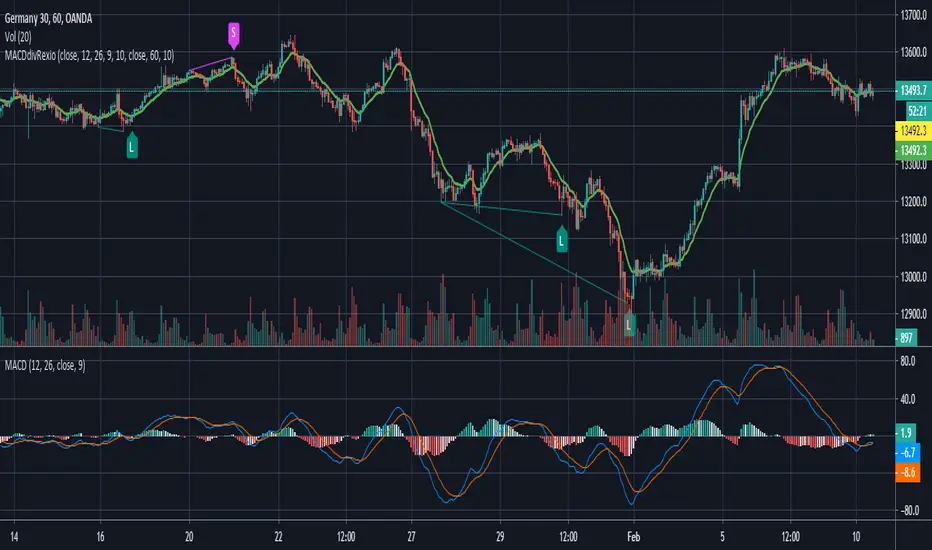
MACD divergence with line drawing by RexioAnother appoach to finding divergences at MACD. This time I think it is much smoother so I could check for divergences between two "peaks" at MACD.
I added my SL line which is last peak +- 1xATR. And the second line is peak between two points of divergence and most of the time it acts like an SR line.
If the higher timeframe trend backs up our divergence (for example: higher trend UP - divergence for L position) I can try to jump in after crossing EMA10.
This indicator is only sugestion for me. I always check price action, trend, SR line before I take any action.
Every people who will test this indicator need to know basics about divergences as THISE ARE NOT BUY/SELL SIGNALS.
If you want to help me and support my coding please contact me via private msg.
WhiteSRSI
This indicator, combines stochastic and rsi of different timeframes, is convenient when used on younger timeframes.
