Trendlines Oscillator [LuxAlgo]The Trendlines Oscillator helps traders identify trends and momentum based on the normalized distances between the current price and the most recently detected bullish and bearish trend lines.
The indicator features bullish and bearish momentum, a signal line with crossings, and multiple smoothing options.
🔶 USAGE
The indicator displays three lines: two for momentum and one for the signal. When one of the momentum lines (bullish or bearish) crosses the signal line, the tool displays a dot to indicate which momentum is gaining strength.
As a general rule, when the green bullish momentum line is above the red bearish momentum line, it indicates buyer strength. This means that the actual prices are farther from the support trend lines than the resistance trend lines. The opposite is true for seller strength.
To calculate bullish momentum, the tool first identifies bullish trend lines acting as support below the price. Then, it measures the delta between the price and those trend lines and normalizes the reading into the displayed momentum values.
The same process is used for bearish momentum, but with bearish trendlines acting as resistance above the price.
🔹 Length & Memory
Modifying the Length and Memory values will cause the tool to display different momentum values.
Traders can adjust the length to detect larger trendlines and adjust the memory to indicate how many trendlines the tool should consider.
As the chart above shows, smaller values make the tool more responsive, while larger values are useful for detecting larger trends.
🔹 Smoothing
By default, the data is not smoothed, and the signal uses a triangular moving average with a length of 10. Traders can smooth both the data and the signal line.
Traders can choose from up to ten different methods, or none. Some examples are shown on the chart above.
🔶 DETAILS
The steps for the calculations are as follows:
1. Gather the pivots, highs, and lows.
ph = fixnan(ta.pivothigh(lengthInput, lengthInput))
pl = fixnan(ta.pivotlow(lengthInput, lengthInput))
2. Calculate the slope and y-intercept for each trendline between contiguous lower highs (resistance) or higher lows (support).
if ph < ph
slope = (ph - ph )/(n-lengthInput - phx1)
res.unshift(l.new(ph - slope * phx1, slope))
if pl > pl
slope = (pl - pl )/(n-lengthInput - plx1)
sup.unshift(l.new(pl - slope * plx1, slope))
3. Calculate the value of each trendline on the current bar, then calculate the difference with the current price (delta). To calculate the relative sum of deltas, only consider trendlines below the price for support or above the price for resistance.
method get_point(l id, x)=>
id.slope * x + id.intercept
for element in sup
point = element.get_point(n)
if sourceInput > point
sup_sum += sourceInput - point
sup_den += math.abs(sourceInput - point)
for element in res
point = element.get_point(n)
if sourceInput < point
res_sum += point - sourceInput
res_den += math.abs(point - sourceInput)
4. Normalize the value from 0 to 100 by taking the sum of the relative values of the deltas divided by the sum of the absolute values of the deltas.
float supportLine = sup_sum / sup_den * 100
float resistanceLine = res_sum / res_den * 100
5. Smooth both values, then calculate the signal line as the difference between them.
float smoothSupport = smooth(supportLine,dataSmoothingInput,dataSmoothingLengthInput)
float smoothResistance = smooth(resistanceLine,dataSmoothingInput,dataSmoothingLengthInput)
float signal = math.abs(smoothSupport - smoothResistance)
float signalLine = smooth(signal,smoothingInput,smoothingLengthInput)
6. Calculate the crossing signals against the signal line, using only the first signal from each series of bullish or bearish crossings.
bullSignal = smoothSupport > signalLine and smoothSupport < signalLine
bearSignal = smoothResistance > signalLine and smoothResistance < signalLine
lastSignal := bullSignal and lastSignal == BEAR ? BULL : bearSignal and lastSignal == BULL ? BEAR : lastSignal
firstBull = ta.change(lastSignal) > 0
firstBear = ta.change(lastSignal) < 0
🔶 SETTINGS
Length: The size of the market structure used for trendline detection.
Memory: The number of trendlines used in calculations.
Source: The source for the calculations is closing prices by default.
🔹 Smoothing
Data Smoothing: Choose the smoothing method and length
Signal Smoothing: Choose the smoothing method and length
Divergence

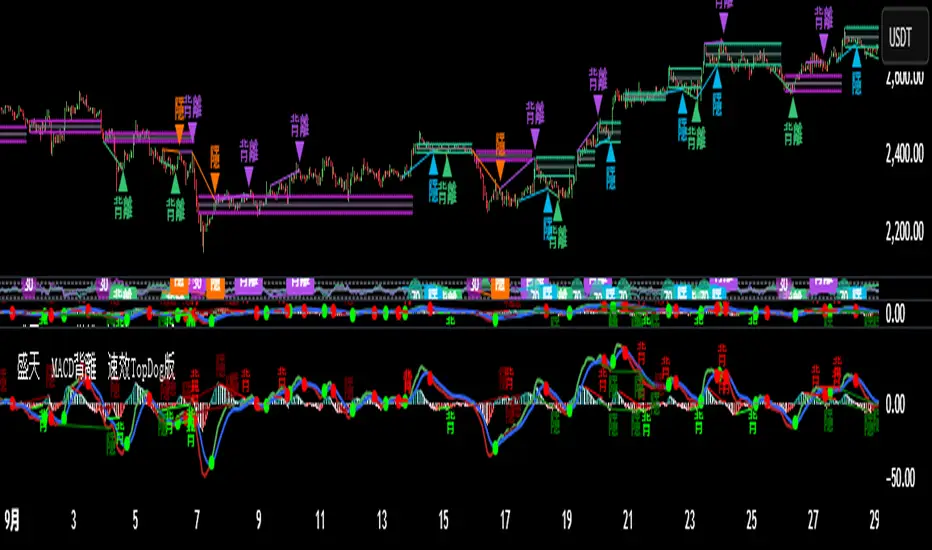
♨️盛天®MACD背離Ⓜ️速效TopDog版🕯📊功能概述
該指標整合了傳統 MACD(移動平均線收斂-發散指標)的核心功能,並新增了背離檢測、Top Dog Trading 的 MOM 和 DAD 模式、多時間框架支持以及靈活的視覺化和警報設置。
以下是其主要功能👇 :
1️⃣ MACD 核心計算MACD 線:由快速移動平均線(Fast MA)減去慢速移動平均線(Slow MA)計算得出,反映價格的短期與長期趨勢差異。
信號線:對 MACD 線進行平滑處理(通常使用 EMA 或 SMA),用於識別趨勢轉換點。
直方圖:MACD 線與信號線的差值,顯示動量的強弱和方向。
靈活性:用戶可選擇使用 EMA(指數移動平均線)或 SMA(簡單移動平均線)進行計算,並可設置快速均線、慢速均線和信號線的週期。
📊Feature Overview
This indicator integrates the core functionality of the traditional MACD (Moving Average Convergence-Divergence) indicator and adds divergence detection, Top Dog Trading's MOM and DAD modes, support for multiple time frames, and flexible visualization and alert settings.
Here are its key features:
1. MACD Core Calculation: The MACD Line is calculated by subtracting the Slow Moving Average (Slow MA) from the Fast Moving Average (Fast MA) and reflects the divergence between short-term and long-term price trends.
Signal Line: The MACD Line is smoothed (typically using an EMA or SMA) to identify trend reversals.
Histogram: The difference between the MACD Line and the Signal Line indicates the strength and direction of momentum.
Flexibility: Users can choose to use either EMA (Exponential Moving Average) or SMA (Simple Moving Average) for calculations, and can set the periods for the fast and slow moving averages, as well as the signal line.
2️⃣多時間框架支持通過 request.security 函數,允許用戶選擇不同的時間框架(例如 1 小時、日線等)來計算 MACD,適用於分析更高或更低時間框架的趨勢,無需改變圖表的當前時間框架。
2️⃣Multi-timeframe support is available through the request.security function, allowing users to select different timeframes (such as 1 hour, daily, etc.) to calculate the MACD. This is suitable for analyzing trends in higher or lower timeframes without changing the current timeframe of the chart.
3️⃣Top Dog Mode:
The Top Dog Mode is an advanced feature of the indicator that enhances the MACD's sensitivity to short-term momentum and its ability to identify long-term trends through specific moving average periods (5, 20, 30) and MOM/DAD visualization. It is particularly suitable for short-term traders, swing traders, and market participants who need fast momentum signals. Through crossover dots, MOM histograms, DAD direction alerts, and divergence detection, the Top Dog Mode provides traders with flexible signal generation tools suitable for various market environments.
The signal line period (30) is longer than the standard MACD's 9, which helps filter out short-term fluctuations and confirm long-term trends.
The Top Dog pattern is suitable for the following trading scenarios:
(🔵➤ Short-term trading scenario: In highly volatile markets (such as forex or cryptocurrencies), use the rapid crossover signals of the MOM and DAD to capture short-term price fluctuations.
Recommendation: Use this pattern on lower timeframes (such as the 5-minute or 15-minute timeframe) and set a stop-loss to control risk.
(🔵➤ Trend confirmation scenario: Use the direction of the DAD to confirm the long-term trend and combine it with the MOM histogram to determine entry points.
Recommendation: Use this pattern on higher timeframes (such as the 1-hour or 4-hour timeframe) and combine it with trendlines or moving averages.
(🔵➤ Reversal trading scenario: Combine the Top Dog pattern's divergence signals (labeled "divergence" or "hidden") to identify potential trend reversals.
Recommendation: Confirm divergence signals near key support/resistance levels to reduce the risk of false positives.
(🔵➤ Trend Continuation Scenarios: Using Hidden Divergences (labeled "Hidden") to Identify Trend Continuation Opportunities 👇
4. Divergence Detection: Regular Divergences (labeled "Divergence"): Bullish Divergence: When the price makes lower lows, but the MACD histogram or MACD line makes higher lows, it indicates weakening bearish momentum and may signal a reversal.
Bearish Divergence: When the price makes higher highs, but the MACD histogram or MACD line makes lower highs, it indicates weakening bullish momentum and may signal a reversal. 👇
Hidden Divergences (labeled "Hidden"): Hidden Bullish Divergence: When the price makes higher lows, but the MACD histogram or MACD line makes lower lows, it may signal the possibility of trend continuation.
Hidden Bearish Divergence: When the price makes lower highs, but the MACD histogram or MACD line makes lower highs, it may signal a reversal. The line has made a higher high, indicating the possibility of trend continuation👇
3️⃣Top Dog 模式:
Top Dog 模式是該指標的一個進階功能,通過特定的均線週期(5、20、30)和 MOM/DAD 的視覺化方式,增強了 MACD 對短期動量的敏感性和長期趨勢的確認能力。它特別適合短線交易者、波段交易者和需要快速動量信號的市場參與者。通過交叉圓點、MOM 直方圖、DAD 方向警報和背離檢測,Top Dog 模式為交易者提供了靈活的信號生成工具,適用於多種市場環境。
信號線週期(30)比標準 MACD 的 9 更長,有助於過濾短期波動,確認長期趨勢。
Top Dog 模式適用於以下交易場景:
(🔵➤短線交易場景:在高波動市場(如外匯或加密貨幣)中,利用 MOM 和 DAD 的快速交叉信號捕捉短期價格波動。
建議:在低時間框架(如 5 分鐘或 15 分鐘)使用,並設置止損以控制風險。
(🔵➤ 趨勢確認場景:利用 DAD 的方向確認長期趨勢,結合 MOM 直方圖判斷進場時機。
建議:在較高時間框架(如 1 小時或 4 小時)使用,結合趨勢線或移動平均線。
(🔵➤反轉交易場景:結合 Top Dog 模式的背離信號(標籤“背”或“隱”),識別潛在的趨勢反轉。
建議:在關鍵支撐/阻力位附近確認背離信號,降低假信號風險。
(🔵➤ 趨勢延續場景:利用隱藏背離(標籤“隱”)捕捉趨勢延續機會👇
4. Divergence Detection: Regular Divergence (labeled "Divergence"): Bullish Divergence: When prices make lower lows, but the MACD histogram or MACD line makes higher lows, it indicates weakening downside momentum and may signal a reversal.
Bearish Divergence: When prices make higher highs, but the MACD histogram or MACD line makes lower highs, it indicates weakening upside momentum and may signal a reversal.
4️⃣背離檢測常規背離(標籤為“背”):看漲背離:當價格創出更低低點,但 MACD 直方圖或 MACD 線創出更高低點,表明下跌動量減弱,可能預示反轉。
看跌背離:當價格創出更高高點,但 MACD 直方圖或 MACD 線創出更低高點,表明上漲動量減弱,可能預示反轉👇。
隱藏背離(標籤為“隱”):隱藏看漲背離:當價格創出更高低點,但 MACD 直方圖或 MACD 線創出更低低點,表明趨勢延續的可能。
隱藏看跌背離:當價格創出更低高點,但 MACD 直方圖或 MACD 線創出更高高點,表明趨勢延續的可能👇
5️⃣ Trend Coloring MACD Line: Based on the position of the MACD line relative to the signal line (crossing above for an uptrend, crossing below for a downtrend), you can choose whether to display the trend color (default green for uptrend, red for downtrend)👇.
5️⃣ 趨勢著色MACD 線:根據 MACD 線相對於信號線的位置(上穿為上升趨勢,下穿為下降趨勢),可選擇是否顯示趨勢顏色(默認綠色為上升,紅色為下降)👇 。
6️⃣ Crossover Dots:
When the MACD line crosses the signal line, a dot appears: Upward crossover (MACD line crosses above the signal line): a green dot.
Downward crossover (MACD line crosses below the signal line): a red dot. You can set whether to display the dot and its width.
6️⃣ 交叉圓點:
當 MACD 線與信號線交叉時,顯示圓點:上穿(MACD 線上穿信號線):綠色圓點。
下穿(MACD 線下穿信號線):紅色圓點。可設置是否顯示以及寬度👇 。
7️⃣ Display Flexibility: Users can choose whether to display the MACD line, signal line, histogram, histogram outline, MOM histogram (Top Dog pattern), crossover dots, and divergence labels.
Line widths (MACD line, signal line, histogram, dots) and color settings are adjustable.
7️⃣顯示靈活性用戶可選擇是否顯示 MACD 線、信號線、直方圖、直方圖外框、MOM 直方圖(Top Dog 模式)、交叉圓點和背離標籤。
可調整線條寬度(MACD 線、信號線、直方圖、圓點)和顏色設置👇 。
8️⃣警報功能:
MACD交叉警報:
🚨MACD 線上穿信號線(看漲信號)。
🚨MACD 線下穿信號線(看跌信號)。
🚨MACD > 0 且上穿(強看漲信號)。
🚨MACD < 0 且下穿(強看跌信號)。
背離警報:
🚨MACD 直方圖/MOM 的常規和隱藏看漲/看跌背離。
🚨MACD 線/DAD 的常規和隱藏看漲/看跌背離。
DAD 方向警報:
🚨DAD(信號線)方向改變(交叉前一根 K 線的信號線值)。
🚨DAD 向上(信號線上升)。
🚨DAD 向下(信號線下降)。
所有警報默認啟用,可通過 TradingView 的警報設置面板配置通知方式。
8️⃣Alert Features:
MACD Crossover Alerts:
🚨MACD Line crosses above Signal Line (bullish signal).
🚨MACD Line crosses below Signal Line (bearish signal).
🚨MACD > 0 and crosses upward (strong bullish signal).
🚨MACD < 0 and crosses downward (strong bearish signal).
Divergence Alerts:
🚨Regular and hidden bullish/bearish divergences of the MACD Histogram/MOM.
🚨Regular and hidden bullish/bearish divergences of the MACD Line/DAD.
DAD Direction Alerts:
🚨DAD (Signal Line) direction changes (crosses over the previous candlestick's Signal Line value).
🚨DAD up (Signal Line rising).
🚨DAD down (Signal Line falling).
All alerts are enabled by default, and notification methods can be configured through the TradingView Alerts panel.
QFisher-R™ [ParadoxAlgo]QFISHER-R™ (Regime-Aware Fisher Transform)
A research/education tool that helps visualize potential momentum exhaustion and probable inflection zones using a quantitative, non-repainting Fisher framework with regime filters and multi-timeframe (MTF) confirmation.
What it does
Converts normalized price movement into a stabilized Fisher domain to highlight potential turning points.
Uses adaptive smoothing, robust (MAD/quantile) thresholds, and optional MTF alignment to contextualize extremes.
Provides a Reversal Probability Score (0–100) to summarize signal confluence (extreme, slope, cross, divergence, regime, and MTF checks).
Key features
Non-repainting logic (bar-close confirmation; security() with no lookahead).
Dynamic exhaustion bands (data-driven thresholds vs fixed ±2).
Adaptive smoothing (efficiency-ratio based).
Optional divergence tags on structurally valid pivots.
MTF confirmation (same logic computed on a higher timeframe).
Compact visuals with subtle plotting to reduce chart clutter.
Inputs (high level)
Source (e.g., HLC3 / Close / HA).
Core lookback, fast/slow range blend, and ER length.
Band sensitivity (robust thresholding).
MTF timeframe(s) and agreement requirement.
Toggle divergence & intrabar previews (default off).
Signals & Alerts
Turn Candidate (Up/Down) when multiple conditions align.
Trade-Grade Turn when score ≥ threshold and MTF agrees.
Divergence Confirmed when structural criteria are met.
Alerts are generated on confirmed bar close by default. Optional “preview” mode is available for experimentation.
How to use
Start on your preferred timeframe; optionally enable an HTF (e.g., 4×) for confirmation.
Look for RPS clusters near the exhaustion bands, slope inflections, and (optionally) divergences.
Combine with your own risk management, liquidity, and trend context.
Paper test first and calibrate thresholds to your instrument and timeframe.
Notes & limitations
This is not a buy/sell signal generator and does not predict future returns.
Readings can remain extreme during strong trends; use HTF context and your own filters.
Parameters are intentionally conservative by default; adjust carefully.
Compliance / Disclaimer
Educational & research tool only. Not financial advice. No recommendation to buy/sell any security or derivative.
Past performance, backtests, or examples (if any) are not indicative of future results.
Trading involves risk; you are responsible for your own decisions and risk management.
Built upon the Fisher Transform concept (Ehlers); all modifications, smoothing, regime logic, scoring, and visualization are original work by Paradox Algo.

Cvd Divergence Signals with filter.
CVD Divergence + Candles - False Signal Filter
Hey traders,
I want to share my custom indicator with you. Through testing, I've found that CVD (Composite Volume Delta) captures divergences much more accurately than traditional tools like RSI. But this isn't just another divergence indicator - I've added strict candlestick pattern confirmation to filter out false signals. I'll keep improving this tool over time, and I welcome all your suggestions in the comments.
How it works step-by-step:
1. First, it detects CVD divergences (the delta between buy/sell volumes)
2. Then confirms each signal with reversal candlestick patterns:
- Hammer/Hanging Man
- Engulfing
- Pin Bar
- Inside Bar
Why mine beats standard CVD indicators:
• No raw divergences - only shows signals confirmed by BOTH volume AND price action
• Eliminates 80% of junk signals from basic versions
• Adaptable to any asset and timeframe
Simple usage guide:
Green arrows = Buy when:
- CVD shows bullish divergence
- AND a hammer/pin bar appears
Red arrows = Sell when:
- CVD shows bearish divergence
- Confirmed by hanging man/engulfing pattern
Pro tip:
For best results, combine with:
• Volume profile analysis
• Smart Money concepts (order blocks, FVGs )
Important notes:
This isn't a holy grail - I personally use it with support/resistance levels. Works best on 5M charts for scalping.
**PS** Got questions? Drop them in comments!

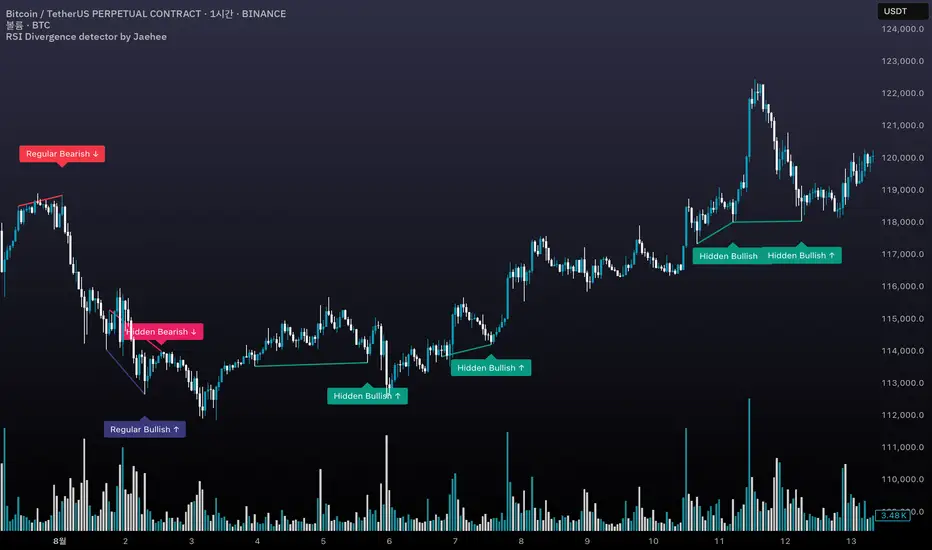
RSI Divergence detector by Jaehee📌 RSI DIVERGENCE DETECTOR — Instant Detection of Regular & Hidden Divergences with Color-Coded Labels
🔍 WHAT IT IS
• Detects regular and hidden divergences between price and RSI instantly, without the delay common in other divergence indicators
• Displays divergences directly on the chart with color-coded labels and connecting lines for instant visual recognition
• Uses different label colors for each divergence type so traders can identify setups at a glance
⚙️ HOW IT WORKS
• RSI Calculation — RSI is computed from a chosen price source with adjustable length
• Immediate Pivot Detection — Identifies pivots just one bar after formation for minimal delay
• RSI Delta Filter — Requires a minimum RSI difference to reduce noise and false signals
• Divergence Logic
Regular Bullish: Price lower low • RSI higher low
Regular Bearish: Price higher high • RSI lower high
Hidden Bullish: Price higher low • RSI lower low
Hidden Bearish: Price lower high • RSI higher high
• Visual Output — Connects pivot points with lines and adds labels above/below bars in colors you set
💡 WHY THIS COMBINATION
• Instant feedback — Acts faster than typical divergence tools that wait for multiple bar confirmations
• All-in-one detection — Regular and hidden divergences in the same tool
• Visual clarity — Distinct label colors make type recognition immediate
• Customizable — Adjust RSI length, pivot sensitivity, color scheme, and filtering to your style
🆚 HOW IT DIFFERS FROM COMMON DIVERGENCE INDICATORS
• Displays divergence the moment a pivot forms
• Detects both regular and hidden divergences in real time
• Applies RSI difference filtering for better quality
• Offers full color customization for each divergence type
📖 HOW TO READ IT (CONTEXT, NOT SIGNALS)
• Regular Bullish ↑ — Possible upward reversal or trend continuation after pullback
• Regular Bearish ↓ — Possible downward reversal or continuation after rally
• Hidden Bullish ↑ — Often a trend continuation signal in uptrends
• Hidden Bearish ↓ — Often a trend continuation signal in downtrends
• Always confirm with trend, momentum, or volume tools before trading
🛠 INPUTS
• RSI source and length
• Pivot lookback bars (left/right)
• Minimum RSI difference
• Custom colors for each divergence type
🎨 DESIGN NOTES
• Overlay on price chart for context
• Lines connect relevant pivots for clarity
• Labels placed near pivot highs/lows for easy spotting
• Customizable colors for personal visual preferences
⚠️ LIMITATIONS AND GOOD PRACTICE
• Divergence is not a guaranteed reversal signal
• Strong trends may override divergence setups
• False signals can occur in low volume or choppy markets
• Best used with a complete trading system and risk management
📂 DEFAULTS AND SCOPE
• Works on all OHLCV instruments and timeframes
• No repainting after pivot confirmation
💬 AUTHOR’S NOTE FOR REVIEW
This script is not a repackaging of existing tools. It integrates immediate divergence detection, hidden divergence analysis, and visual type separation into a single, customizable package. All features interact to deliver faster, clearer market context without generating trade signals or making performance claims.
SMT Oscillator: Smarter Money Divergence Detector [PhenLabs]📊Phenlabs - SMT Oscillator: Smarter Money Divergence Detector
Version: PineScript™v6
📌Description
The SMT Oscillator is a sophisticated tool designed to identify smart money divergence between two correlated assets. By analyzing the momentum and volume-weighted price action of a primary and secondary symbol, traders can spot subtle shifts in market dynamics that often precede significant price movements. This indicator is built to provide a clearer, more filtered view of inter-market relationships, solving the common problem of false signals and market noise. Its primary purpose is to equip traders with a quantifiable edge in detecting potential reversals or continuations that are not obvious on a standard price chart.
🚀Points of Innovation
Dual-Symbol Divergence Core: Directly compares momentum (RSI or MACD) between two user-selected symbols to pinpoint true SMT divergence.
Volume-Weighted Analysis: Integrates volume delta into the divergence calculation, giving more weight to moves backed by significant market participation.
Entropy Filter for Noise Reduction: Employs an entropy calculation to filter out low-quality signals during choppy or consolidating market conditions.
Predictive Forecast Line: Utilizes a linear regression model to project the oscillator’s future trajectory, offering a forward-looking glimpse of potential momentum shifts.
Customizable Signal Sensitivity: Allows fine-tuning of overbought and oversold levels to adapt to different market volatilities and trading styles.
Integrated Signal Alerts: Provides built-in alerts for bullish/bearish zero crosses and overbought/oversold conditions.
🔧Core Components
Momentum Engine: The user can select either RSI or MACD as the underlying engine for the divergence calculation, allowing for flexibility in analysis.
Normalization Function: Price data from both symbols is normalized using percentage change to ensure a true “apples-to-apples” comparison, regardless of their nominal price differences.
Divergence Calculator: The core algorithm that subtracts the secondary symbol’s momentum from the primary’s and normalizes the result using the combined standard deviation.
Smoothing Mechanism: An Exponential Moving Average (EMA) is applied to the raw oscillator output to reduce choppiness and provide a clearer signal line.
🔥Key Features
Multi-Asset Comparison: Go beyond single-asset analysis by comparing correlated pairs like ES/NQ or BTC/ETH to uncover hidden trading opportunities.
Heatmap Visualization: An optional heatmap mode provides an intuitive visual representation of divergence strength, making it easier to gauge market sentiment at a glance.
Configurable Lookback and Timeframe: Adjust the lookback period and analysis timeframe to suit your specific strategy, from short-term scalping to long-term trend analysis.
Signal Markers: Visual markers are plotted directly on the chart for bullish and bearish zero-line crossovers, providing clear entry and exit signals.
🎨Visualization
SMT Oscillator Line: The primary visual element, colored blue for bullish (positive) divergence and orange for bearish (negative) divergence.
Zero Line: A solid horizontal line at the zero level, indicating the equilibrium point between the two assets. Crossovers of this line signal a shift in relative strength.
Overbought/Oversold Zones: Dotted lines at the +80 and -80 levels (customizable) that highlight extreme divergence readings, often indicating potential exhaustion points.
Forecast Line: A predictive line that plots the anticipated path of the oscillator, giving traders an advanced warning of potential changes in momentum.
📖Usage Guidelines
Setting Categories
Primary Symbol
Default: (Chart Symbol)
Description: The main asset you are analyzing. Leave blank to use the symbol currently on your chart.
Secondary Symbol
Default: CME_MINI:ES1! (used with NASDAQ futures due to inherent heavy correlation
Description: The asset to compare against the primary symbol.
Lookback Period
Default: 14
Range: 8-100
Description: Controls the calculation window for momentum (RSI/MACD). Higher values result in a smoother, less sensitive oscillator.
Divergence Type
Default: RSI
Options: RSI, MACD
Description: Choose the momentum indicator to use for the divergence calculation.
Enable Volume Weighting
Default: true
Description: When enabled, gives more weight to divergence signals that are accompanied by significant volume.
✅Best Use Cases
Identifying high-probability reversal points by spotting divergence in overbought or oversold territory.
Confirming the strength of a trend by observing sustained positive or negative divergence.
Pairs trading by taking a long position on the outperforming asset and a short position on the underperforming one during a divergence.
Risk management by recognizing when a current trend is losing its underlying momentum.
⚠️Limitations
Requires Correlated Assets: The indicator’s effectiveness is highly dependent on the selection of two assets with a known correlation (e.g., ES and NQ).
Not a Standalone System: Divergence signals should be used in conjunction with other forms of analysis (price action, market structure) and not as a complete trading system.
Lagging by Nature: As it is based on moving averages and past price data, the oscillator is inherently lagging and may not capture all rapid price changes.
💡What Makes This Unique
Combined Momentum & Volume: Unlike standard oscillators, it fuses momentum with volume delta for a more robust “Smart Money” perspective.
Noise-Filtering Mechanism: The proprietary entropy filter is a unique feature designed to weed out insignificant market chatter and focus on high-conviction signals.
🔬How It Works
Data Normalization:
The script first normalizes the price data of the two selected symbols into percentage changes. This ensures that the comparison is fair, regardless of the difference in their price scales.
Momentum Calculation:
It then calculates the chosen momentum value (either RSI or MACD histogram) for each of the normalized price series.
Divergence Computation:
The core of the indicator lies in subtracting the momentum of the secondary symbol from the primary one. This raw divergence is then optionally weighted by volume and filtered for market noise (entropy) to produce the final oscillator value.
💡Note:
For best results, use this indicator on adequate timeframes to filter out market noise. Always confirm signals with price action analysis before entering a trade.

RSI Momentum Divergence Zones [ChartPrime]⯁ OVERVIEW
RSI Momentum Divergence Zones is a hybrid oscillator and chart overlay tool that detects RSI-based momentum divergences and projects them as key zones on the chart. By combining RSI divergence logic with horizontal level plotting, this indicator reveals high-probability support and resistance areas where price has historically reacted to hidden or classic divergences.
⯁ KEY FEATURES
Momentum-Based RSI Source:
Instead of the classic RSI input, this tool uses the momentum of price as the RSI source:
rsiSrc = ta.mom(close, 10)
This emphasizes acceleration and deceleration of price moves, sharpening divergence signals and making them more responsive to early shifts in momentum.
Automatic Divergence Detection (Optional):
When enabled, the indicator continuously scans for:
— Bullish Divergence : Price makes a Lower Low while RSI forms a Higher Low
— Bearish Divergence : Price makes a Higher High while RSI forms a Lower High
It ensures divergence is valid by checking the spacing between pivots (min 5, max 50 bars).
Divergence Labels & Markers (RSI Pane + Chart):
When a valid divergence is detected:
— On RSI pane:
Labels appear at HL/LH points (“Bull” / “Bear”)
Colored lines show pivot structures
— On price chart:
Labels (“▲ Bull” / “Bear ▼”) mark price pivot that triggered the divergence
Lines highlight the exact price level at the divergence origin
Divergence Zones / Levels (Toggleable):
The indicator projects horizontal zones across the chart based on confirmed divergence points.
These levels dynamically extend as long as price respects them, and auto-expire once broken.
They act as S/R levels created by market imbalance caused by divergence reactions.
Dynamic Zone Extension Logic:
Once plotted, divergence levels will extend to the right:
— If price respects the level, the zone keeps growing
— If broken in the opposite direction, the level stops extending and turns dashed (visually showing break)
Zone Layering and Limit Control:
You can limit the number of simultaneous zones shown on the chart (e.g., 10 most recent).
Old zones automatically expire and are removed to keep the chart clean and focused.
Color Customization and Intensity:
Different colors for bullish and bearish zones let you easily distinguish trend direction.
Background fill, line width, and transparency are all adjustable.
Clean Zone Management with Arrays:
Behind the scenes, the script uses custom divLevel type arrays to manage plotted levels, ensuring they stay up-to-date, extend correctly, and delete once invalidated.
⯁ USAGE
Use bullish divergence zones as potential demand areas and bearish ones as supply zones.
Combine RSI pane labels with price-level zones to confirm strength of reversal.
Watch for price approaching a divergence level to anticipate reactions or breakouts.
Use divergence levels as trade triggers, stop-loss guides, or take-profit markers.
Limit signal count using the “Qty Divergence Zones” setting to reduce chart clutter.
Enable divergence detection only when you want to focus on key structural zones — ideal for swing or positional setups.
⯁ CONCLUSION
RSI Momentum Divergence Zones blends oscillator divergence logic with price action structure to uncover hidden strength or weakness in the market. With flexible zone plotting and clean visual signals, this tool empowers traders to identify where momentum turns into structure — turning hidden signals into tradable edges.

Smart Money Proxy IndexOverview
The Smart Money Proxy Index (SMPI) is an educational tool that attempts to identify potential institutional-style behavior patterns using publicly available market data. This comprehensive tool combines multiple institutional analysis techniques into a single, easy-to-read 0-100 oscillator.
Important Disclaimer
This is an educational proxy indicator that analyzes volume and price patterns. It cannot identify actual institutional trading activity and should not be interpreted as tracking real "smart money." Use for educational purposes and combine with other analysis methods.
Inspiration & Methodology
This indicator is inspired by MAPsignals' Big Money Index (BMI) methodology but uses publicly available price and volume data with original calculations. This is an independent educational interpretation designed to teach smart money concepts to retail traders.
What It Analyzes
SMPI tracks potential "smart money" activity by combining:
Block Trading Detection - Identifies unusual volume surges with significant price impact
Money Flow Analysis - Volume-weighted price pressure using Money Flow Index
Accumulation/Distribution Patterns - Modified On-Balance Volume signals
Institutional Control Proxy - End-of-day positioning and control analysis
Key Features
– Multi-Component Analysis - Combines 4 different institutional detection methods
– BMI-Style 0-100 Scale - Familiar oscillator range with clear extreme levels
– Professional Visualization - Dynamic colors, gradient fills, and clean data table
– Comprehensive Alerts - Buy/sell signals plus divergence detection
– Fully Customizable - Adjust all parameters, colors, and display options
– Non-Repainting Signals - All alerts use confirmed data for reliability
– Educational Focus - Designed to teach institutional flow concepts
How to Interpret
Above 80: Potential smart money distribution phase (bearish pressure)
Below 20: Potential smart money accumulation phase (bullish opportunity)
Signal Generation: Buy signals when crossing above 20, sell signals when crossing below 80
Divergences: Price vs SMPI divergences can signal potential trend changes
Volume Confirmation: Higher volume ratios strengthen signal reliability
Best Practices
Timeframes: Works best on higher timeframes for institutional behavior analysis
Confirmation: Combine with other technical analysis tools and market context
Volume: Pay attention to volume confirmation in the data table
Context: Consider overall market conditions and fundamental factors
Risk Management: Not recommended as standalone trading system
Customizable Parameters
Block Volume Threshold: Sensitivity for unusual volume detection (default: 2.5x average)
SMPI Smoothing Period: Index calculation smoothing (default: 25 bars)
Extreme Levels: Overbought/oversold thresholds (default: 80/20)
Money Flow Length: MFI calculation period (default: 14)
Visual Options: Colors, signals, and display preferences
Available Alerts
Buy Signal: SMPI crosses above oversold level (20)
Sell Signal: SMPI crosses below overbought level (80)
Extreme Levels: Alerts when reaching overbought/oversold zones
Divergence Detection: Bullish and bearish price vs SMPI divergences
Educational Purpose & Limitations
This indicator is designed as an educational proxy for understanding institutional flow concepts. It analyzes publicly available price and volume data to identify potential smart money behavior patterns.
Cannot access actual institutional transaction data
Signals may be slower than day-trading indicators (intentionally designed for institutional timeframes)
Should be used in conjunction with other analysis methods
Past performance does not guarantee future results
What Makes This Different
Unlike simple volume or momentum indicators, SMPI combines multiple institutional analysis techniques into one comprehensive tool. The multi-component approach provides a more robust view of potential smart money activity.

Fundur - Market Sentiment BIndicator Overview
The Market Sentiment B indicator is a sophisticated multi-timeframe momentum oscillator that provides comprehensive market analysis through advanced wave theory and sentiment measurement. Unlike traditional single-timeframe indicators, Market Sentiment B analyzes 11 different timeframes simultaneously to create a unified view of market momentum and sentiment.
What Makes Market Sentiment B Unique
Multi-Timeframe Convergence : The indicator combines data from 11 different periods (8, 13, 21, 34, 55, 89, 144, 233, 377, 610, 987) based on mathematical sequences that naturally occur in market cycles.
Advanced Wave Analysis : The histogram component tracks momentum waves with precise peak and trough identification, allowing traders to spot both major moves and smaller precursor waves.
Sentiment Extremes Detection : When all 11 timeframes reach extreme levels simultaneously, the indicator highlights these rare conditions with background coloring, signaling potential major reversals.
Dynamic Zone Analysis : The indicator divides market conditions into Premium (80+), Discount (20-), and Liquidity zones (40-60), providing clear context for trade entries and exits.
Core Components
1. Market Sentiment B Line (Main Signal)
The primary oscillator line that represents the averaged sentiment across all timeframes. This line uses advanced mathematical filtering to smooth out noise while preserving important trend changes.
Key Features:
Oscillates between 0-100
Color-coded: Green when rising, Red when falling
Shows divergences with colored dots
Premium zone: 80+, Discount zone: 20-
2. Momentum Waves (Secondary Signal)
A smoothed version of the Market Sentiment B line that acts as a trend-following component. This line helps identify the underlying momentum direction.
Key Features:
Blue coloring during bullish expansion (above 50 and rising)
Orange coloring during bearish expansion (below 50 and falling)
Filled areas show expansion and contraction phases
Critical 50-line crossovers signal momentum shifts
3. Histogram (Wave Analysis)
The difference between Market Sentiment B and Momentum Waves, displayed as a histogram that reveals the relationship between current sentiment and underlying momentum.
Key Features:
Green bars: Positive momentum (Market Sentiment above Momentum Waves)
Red bars: Negative momentum (Market Sentiment below Momentum Waves)
Wave height labels show the strength of each wave
Divergence patterns identify potential reversals
4. Divergence System
Advanced divergence detection that identifies both regular and hidden divergences, with special "Golden Divergences" for the strongest signals.
Types:
Regular Divergences : Price makes new highs/lows while indicator doesn't
Hidden Divergences : Continuation patterns in trending markets
Golden Divergences : High-probability reversal signals (orange dots)
5. Zone Analysis
The indicator divides market conditions into distinct zones:
Premium Zone (80-100) : Potential selling area
Liquidity Zone (40-60) : Neutral/consolidation area (highlighted in orange)
Discount Zone (0-20) : Potential buying area
Extreme Conditions : Background coloring when all timeframes align
Setup Guide
Initial Installation
Open TradingView and navigate to your desired chart
Click the "Indicators" button or press "/" key
Search for "Fundur - Market Sentiment B"
Click on the indicator to add it to your chart
The indicator will appear in a separate pane below your chart
Essential Settings Configuration
Main Settings
Show Histogram Wave Values : Enable to see wave strength numbers
Wave Value Text Size : Choose from tiny, small, normal, or large
Wave Label Offset : Adjust label positioning (default: 2)
Market Sentiment Thresholds
Only Show Indicators at Market Sentiment Extremes : Filter signals to extreme zones only
Extreme levels are automatically set at 80 (high) and 20 (low)
Small Wave Strategy
Enable Small Wave Swing Strategy : Focus on smaller, early-warning waves
Small Wave Label Color : Customize the color for small wave labels
Divergence Analysis
Show Regular Divergences : Enable standard divergence detection
Show Gold Divergence Dots : Enable high-probability golden signals
Show Divergence Dots : Show all divergence markers
Histogram Settings
Enable Histogram : Toggle the histogram display
Divergence Types : Choose which types to display (Bullish/Bearish Reversals and Continuations)
Recommended Initial Setup
Enable all main components (Histogram, Divergences, Momentum Waves)
Set wave value text size to "small" for clarity
Enable golden divergence dots for premium signals
Start with all alert categories enabled, then customize based on your trading style
Basic Trading Guide
Understanding the Zones
Premium Zone Trading (80-100)
When to Consider Selling:
Market Sentiment B enters 80+ zone
Bearish divergences appear
Histogram shows weakening momentum (smaller green waves)
Background turns red (extreme conditions)
What to Look For:
Bearish pivot signals (orange triangles pointing down)
Golden divergence dots at tops
Momentum Waves turning bearish
Discount Zone Trading (0-20)
When to Consider Buying:
Market Sentiment B enters 0-20 zone
Bullish divergences appear
Histogram shows strengthening momentum (smaller red waves)
Background turns green (extreme conditions)
What to Look For:
Bullish pivot signals (blue triangles pointing up)
Golden divergence dots at bottoms
Momentum Waves turning bullish
Liquidity Zone Trading (40-60)
Consolidation and Breakout Zone:
Orange-filled area indicates neutral sentiment
Wait for clear breaks above 60 or below 40
Use for range-bound trading strategies
Look for momentum wave direction changes
Key Signal Types
1. Zone Crossovers
Above 60 : Bullish momentum building
Below 40 : Bearish momentum building
50-line crosses : Primary trend changes
2. Divergence Signals
Golden dots : Strongest reversal signals that align accross different timeframes
Colored dots : Standard divergence warnings
Hidden divergences : Trend continuation signals
3. Histogram Patterns
Increasing green bars : Building bullish momentum
Increasing red bars : Building bearish momentum
Smaller waves : Early warning signals of deteriorating interest
Basic Entry Rules
Long Entries
Market Sentiment B in discount zone (0-20) OR
Bullish divergence confirmed OR
Break above 40 from oversold conditions OR
Golden divergence dot at bottom
Short Entries
Market Sentiment B in premium zone (80-100) OR
Bearish divergence confirmed OR
Break below 60 from overbought conditions OR
Golden divergence dot at top
Exit Rules
Exit longs when entering premium zone
Exit shorts when entering discount zone
Close positions on opposite divergence signals
Use histogram wave tops/bottoms for fine-tuning exits
Advanced Analysis Setups
Setup 1: Scalping Configuration
Purpose : Quick intraday trades focusing on small moves
Settings :
Enable Small Wave Strategy
Show indicators only at extremes: OFF
Combine multiple alerts: ON
Focus on 1-5 minute timeframes
Signals to Watch :
Small wave histogram peaks/troughs
Quick zone crossovers (40/60 line breaks)
Momentum wave direction changes
Short-term divergences
Setup 2: Swing Trading Configuration
Purpose : Medium-term trend following and reversal trading
Settings :
Show indicators only at extremes: ON
Enable all divergence types
Focus on 15-minute to 4-hour timeframes
Golden divergence alerts: HIGH priority
Signals to Watch :
Premium/discount zone entries
Golden divergence signals
Extreme condition backgrounds
Major histogram wave formations
Setup 3: Position Trading Configuration
Purpose : Long-term trend identification and major reversal spots
Settings :
Only alert in extremes: ON
Focus on golden divergences only
Use daily and weekly timeframes
Minimize noise with extreme filtering
Signals to Watch :
Extreme condition backgrounds (red/green)
Major golden divergence signals
Long-term momentum wave trends
Weekly/monthly zone transitions
Setup 4: Reversal Hunting Configuration
Purpose : Catching major market turns at key levels
Settings :
Enable all divergence types
Show golden divergence dots: ON
Extreme filtering: ON
Small wave strategy: OFF
Signals to Watch :
Multiple divergence confirmations
Golden divergence + extreme zones
All-timeframe extreme conditions
Major histogram wave exhaustion
Setup 5: Trend Following Configuration
Purpose : Riding momentum in established trends
Settings :
Momentum waves: HIGH priority
Hidden divergences: ON
Continuation patterns focus
Zone crossover alerts
Signals to Watch :
Momentum wave expansion phases
Hidden divergence continuations
Liquidity zone breakouts
Sustained momentum patterns
Alert System
The Market Sentiment B indicator features a comprehensive alert system with over 30 different alert types organized into logical categories.
Alert Categories
Market Sentiment B Line Alerts
Golden Divergences : Highest priority reversal signals
Standard Divergences : Regular divergence patterns
Bearish/Bullish Pivots : Momentum pivot points
Premium/Discount Zone : Zone entry/exit alerts
Extreme Conditions : Rare all-timeframe extremes
Liquidity Zone : 40-60 zone movement alerts
Momentum Waves Alerts
Premium/Discount Zones : 80+/20- level alerts
Liquidity Zone Movement : 40-60 zone alerts
Expansion Phases : Bullish/bearish expansion alerts
Direction Changes : 50-line crossover alerts
Cross Alerts : MSB vs Momentum crossovers
Histogram Alerts
State Changes : Bullish/bearish turns
Peak/Trough Detection : Wave top/bottom alerts
Divergence Alerts : Histogram-specific divergences
Hidden Divergences : Continuation pattern alerts
Smaller Wave Alerts : Early warning signals
Alert Configuration Tips
For Day Trading
Enable quick state change alerts
Focus on histogram and small wave alerts
Use combined alerts to reduce noise
Disable extreme-only filtering
For Swing Trading
Enable zone crossover alerts
Focus on divergence and pivot alerts
Use extreme-only filtering
Prioritize golden divergence alerts
For Position Trading
Enable only golden divergences and extreme conditions
Use extreme-only filtering
Focus on major zone transitions
Disable minor wave alerts
Trading Strategies
Strategy 1: Premium/Discount Zone Reversal
Setup : Wait for Market Sentiment B to reach extreme zones
Entry :
Long: Enter discount zone (0-20) with bullish divergence
Short: Enter premium zone (80-100) with bearish divergence
Exit : Opposite zone reached or momentum wave reversal
Risk Management : Stop loss at recent swing high/low
Strategy 2: Golden Divergence Power Plays
Setup : Wait for golden divergence dots to appear
Entry : Enter in direction opposite to divergence (reversal play)
Confirmation : Wait for momentum wave to confirm direction
Exit : When sentiment reaches opposite zone
Risk Management : Tight stops below/above divergent pivot
Strategy 3: Momentum Wave Trend Following
Setup : Identify strong momentum wave expansion phases
Entry : Enter on pullbacks to 50-line during expansion
Continuation : Hold while expansion phase continues
Exit : When expansion phase ends or opposite expansion begins
Risk Management : Trail stops using wave peaks/troughs
Strategy 4: Small Wave Early Entry
Setup : Enable Small Wave Strategy for early signals
Entry : Enter on small wave formations before major moves
Confirmation : Wait for main sentiment line to follow
Exit : When major wave forms or opposite signal appears
Risk Management : Quick exits if main indicator doesn't confirm
Strategy 5: Extreme Condition Contrarian
Setup : Wait for background color changes (extreme conditions)
Entry : Counter-trend when ALL timeframes are extreme
Confirmation : Look for early divergence signs
Exit : When background color disappears
Risk Management : Position size smaller due to counter-trend nature
FAQ & Troubleshooting
Frequently Asked Questions
Q: Why don't I see any signals on my chart?
A: Check if "Only Show Indicators at Market Sentiment Extremes" is enabled. If so, signals only appear when the indicator is above 80 or below 20.
Q: What's the difference between golden and standard divergences?
A: Golden divergences (orange dots) are higher-probability signals that meet additional criteria for strength and momentum alignment. Standard divergences are regular price/indicator disagreements.
Q: How do I reduce alert noise?
A: Enable "Only Alert In Extremes" in the alert settings, or use "Combine Multiple Alerts" to consolidate multiple signals into single messages.
Q: What timeframe works best with this indicator?
A: The indicator works on all timeframes. For day trading, use 1-15 minutes. For swing trading, use 1-4 hours. For position trading, use daily or weekly.
Q: Why are the histogram wave values important?
A: Wave values show the strength of momentum. Declining wave values (smaller peaks) often precede trend changes, while increasing values confirm trend strength.
Troubleshooting Common Issues
Issue: Indicator not loading
Solution: Ensure you're using TradingView Pro or higher
Check that max_bars_back is set appropriately
Refresh the chart and re-add the indicator
Issue: Too many alerts firing
Solution: Enable extreme-only filtering
Disable less important alert categories
Use combined alerts feature
Issue: Missing divergence signals
Solution: Check that divergence detection is enabled
Ensure you're looking in the correct zones
Verify that extreme filtering isn't hiding signals
Issue: Histogram not displaying
Solution: Check that "Enable Histogram" is turned ON
Verify histogram divergence types are enabled
Ensure the chart has sufficient historical data
Best Practices
Start Simple : Begin with basic zone trading before using advanced features
Paper Trade First : Test strategies with paper trading before risking capital
Combine with Price Action : Use the indicator alongside support/resistance levels
Respect Risk Management : Never risk more than you can afford to lose
Keep Learning : Market conditions change; adapt your usage accordingly
Performance Optimization
Use appropriate timeframes for your trading style
Enable only necessary alert types
Consider using extreme filtering during high-volatility periods
Regularly review and adjust settings based on market conditions
Conclusion
The Market Sentiment B indicator represents a sophisticated approach to market analysis, combining multiple timeframes, advanced wave theory, and comprehensive divergence detection into a single powerful tool. Whether you're a scalper looking for quick opportunities or a position trader seeking major reversals, this indicator provides the insights needed to make informed trading decisions.
Remember that no indicator is perfect, and the Market Sentiment B should be used as part of a comprehensive trading plan that includes proper risk management, fundamental analysis awareness, and sound money management principles.
Happy Trading!
Disclaimer: Trading involves substantial risk and is not suitable for all investors. Past performance is not indicative of future results. Always practice proper risk management and never trade with money you cannot afford to lose.

Fibonacci-Based Volume Flow (VFI)Fibonacci-based Volume Flow is an advanced next-generation evolution of LazyBear’s original VFI script that calculates and averages up to 21 Fibonacci-based VFI pairings to create a smoothed composite volume flow signal. This unique and powerful approach reduces noise, adapts to volatility, and provides a clearer view of trend strength and market structure across all timeframes. It also includes dynamic fibonacci guide levels, adaptive lookbacks, EMA crossovers, and structure-aware pivot labeling to help traders identify high-quality reversals, confirm directional bias, and detect divergences with greater precision. It's ideal for traders looking to enhance momentum analysis through volume-based confirmation.
🧠 Key Features🧠
🔹 Multi-VFI Fibonacci Fusion🔹
Blends up to 21 VFI signals (5, 13, 21, 34… up to 610) into smartly paired averages (e.g., 13/34, 55/144) — forming a smoothed composite VFI that’s more adaptive, less noisy, and highly responsive across market conditions.
🔸🔸 Dynamic Lookbacks🔸 🔸
Automatically adjusts histogram high/low tracking based on your chart’s timeframe — no more static tuning. Perfect for scalping fast charts or confirming long-term trends.
🟥🟩 Color-Coded Histogram🟥🟩
Visualizes VFI momentum with gradient coloring.
🧩🧩 Signal Crossovers 🧩🧩
Color-coded crossover lines persistently show bullish or bearish dominance.
Includes three powerful crossover systems:
➖5/13 VFI: Fast, early reversal detection
➖8/21 VFI: Swing-trading sweet spot
➖55/144 VFI: Trend confirmation across long cycles
🏷️ 🏷️Pivot Structure Labels🏷️🏷️
Labels oscillator swings with full structural logic:
➖HH, HL, LH, LL, EQ
➖Displays percent change, price at pivot, oscillator reading
➖Smart coloring detects divergence & trend continuation
📈 📈Dynamic Histogram Guides📈📈
Optional zero and ±50% bands anchor histogram levels based on real histogram extremes, not static thresholds — visually frame momentum shifts with context.
📍 📍Persistent High/Low Pivot Lines📍📍
Track the most significant histogram pivots (not price) across time, with smart labels:
➖Volume flow structure zones
➖Label shows price at pivot, oscillator level, and bars since event
➖Ideal for spotting divergence zones, momentum failures, and trend exhaustion.
🔍 🔍Volatility Table (ATR%)🔍🔍
💡Shows real-time volatility compression or expansion
💡Uses multiple ATR periods (e.g., 14 & 55) for short- and medium-term comparison
💡Helps traders understand whether momentum is likely to continue or stall
🔩🔩Volume-weighted VFI baselines🔩🔩
🟢A daily session-based VWAP of the VFI, which resets each day and highlights intraday volume flow context.
🟠A rolling VWA of VFI, which acts like a VWMA over a fixed window (e.g., 55 bars), smoothing short-term fluctuations and supporting trend/momentum confirmation.
These VWAP-style overlays help traders identify strength vs. weakness relative to volume-weighted baselines — useful for divergence spotting, mean reversion setups, or breakout confirmation.
🧰 🧰Under the Hood: How It Works🧰🧰
🔧 Core VFI Logic
Based on LazyBear’s foundational VFI:
➖Uses log returns of price (HLC3)
➖Filters insignificant moves using volatility-weighted thresholds
➖Normalizes volume via adaptive capping (e.g., 2.5× average)
🌀 Composite Blend System
Each VFI instance is smoothed and then fused via user-selectable pairs. This creates a customizable average VFI representing short, mid, and long-term pressure — one value, many time horizons.
📊 EMA Signal Layer
Crosses trigger persistent color shifts in signal lines, making trend strength clear at a glance.
VFI blend feeds into EMA crossovers. You can toggle visibility for:
➖Fast (5/13)
➖Medium (8/21)
➖Slow (55/144)
🧭 Pivot Framework
Structure logic only compares pivots on same-side polarity:
➖Highs compare to highs above zero
➖Lows compare to lows below zero
This avoids nonsensical comparisons and preserves logical sequences (HH → LH → HL).
🧱 Dynamic Labels
All pivots and persistent levels display:
➖Oscillator value
➖Price value
➖Structure tag (e.g., LH, HL)
➖% change from prior pivot
➖Lookback info
➖Bar age
Unlike traditional VFI:
✅ It blends timeframes with Fibonacci precision
✅ Uses dynamic, volatility-aware logic
✅ Embeds visual structure & divergence intelligence
✅ Enhances entry confidence and exit timing
🔧 This isn’t just an indicator — it’s a volume-informed decision engine.
Ideal For:
🔶Trend-followers wanting cleaner volume-based confirmation
🔶Reversal traders spotting structure + divergence
🔶Scalpers or investors needing adaptable signals
🔶Those who loved LazyBear's VFI
📌 Final Note:
As powerful as Fibonacci Blended Volume Flow is, no single indicator should be used in isolation. For best results, combine it with price action analysis, higher-timeframe context, and complementary tools like trendlines, moving averages, or support/resistance levels. Use it as part of a well-rounded trading approach to confirm setups — not to define them alone.

ZenAlgo - DeltaThis indicator visualizes cumulative delta volume across multiple exchanges and trading pairs, with optional moving averages, divergence detection, and contextual labeling. It aggregates buy and sell volume from both spot and perpetual markets, applying normalization and visual encoding to highlight volume flow dynamics over time.
Volume Aggregation Logic
The script starts by collecting volume data from up to nine exchanges. It distinguishes between spot (e.g., USDT, USD) and perpetual markets (e.g., USDT.P, USD.P) using dynamically constructed tickers based on the asset's base currency. For each enabled exchange, it fetches volume using request.security , filtering out invalid or zero-volume responses.
Each set of volume data (spot1, spot2, perp1, perp2) is then processed through a reducer function that combines the values using a selected method—sum, average, median, or variance. These processed volumes are further categorized and summed into total spot and perp volume streams, forming the basis for downstream delta computations.
Delta Calculation
For each bar, the script decomposes the candlestick into wick and body proportions, calculating how much of the total volume might be attributed to upward or downward pressure. This estimation weights the volume by the visual structure of the candle—larger bodies and upper wicks in bullish candles suggest buying pressure; inverse logic applies for bearish candles.
These estimated buy and sell volumes are then subtracted to derive per-bar delta. A cumulative delta series is computed by summing this bar-by-bar delta across a user-defined window length.
Divergences on Delta
Fractal logic is applied to detect local highs and lows in the cumulative delta series. These points serve as anchors for divergence comparisons:
Regular divergences identify price making higher highs (or lower lows) while delta makes lower highs (or higher lows).
Hidden divergences look for the opposite (price pullback vs delta continuation).
The same logic is applied independently to:
Raw cumulative delta
A primary delta moving average
A secondary, slower moving average
Each can be configured with different lookback lengths and moving average types (SMA, EMA, WMA, HMA, RMA).
The divergence logic gains additional value when used in tandem with the delta moving averages and contextual temperature state. For example, a divergence detected on the slower delta average while the temperature band is in an “Extreme Hot” or “Cold” zone may indicate a more meaningful exhaustion event. This layered approach allows users to filter weaker divergences and focus on those that align with broader delta context.
Gradient and Temperature Context
A third moving average (e.g., WMA(50)) is used to provide a contextual "temperature" state of the delta environment. Based on deviations from its own mean and standard deviation, this third MA is classified into zones:
"Extreme Hot", "Hot", "Warm"
"Neutral"
"Cool", "Cold", "Extreme Cold"
These zones are encoded using color and transparency gradients in the chart’s background. This helps identify periods where delta conditions are statistically stretched or compressed relative to recent history.
EMA Cross Conditions
The script tracks crossover events between the short and long EMAs of delta, especially when these align with a directional shift in cumulative delta (e.g., zero-line cross). If confirmed by volume skew (more buy than sell or vice versa), specific visual markers are plotted.
Labels and Informational Lines
Dynamic labels are rendered on the latest bar showing:
Cumulative delta and last divergence
EMA values and associated divergence
"Slow MA" value and its temperature state
These labels float next to the latest values, using thematic or neutral colors based on user preference.
Buy/Sell Pressure Tables
Two optional tables display breakdowns of:
Buy vs Sell volume
Their percentage contribution
Net delta value
Market condition label (e.g., "Full Bull", "Bearish")
These are calculated over the selected lookback period and color-coded accordingly.
An experimental table compares raw and aggregated spot/perpetual volume contributions and their percentage skew.
Background Highlight Logic
Background colors are conditionally rendered based on buy/sell volume dominance. Several thresholds exist:
2x or 3x buy volume dominance → greenish tones
2x or 3x sell volume dominance → reddish tones
Combined with temperature overlays, this highlights areas of potentially high conviction from either side.
Cross Conditions
The script detects situations where cumulative delta crosses under buy/sell volume thresholds. Visual dots mark:
Negative delta intersecting rising sell volume
Positive delta intersecting rising buy volume
This provides additional cues when short-term volume shifts might contradict recent cumulative flow.
How to Interpret Values
Cumulative Delta (AggDelta): Tracks net buy vs sell pressure over time. A rising delta suggests persistent buying pressure, and vice versa.
Temperature State: Places delta flow into historical context. “Extreme Hot” implies sustained positive flow, possibly overextended; “Cold” signals inverse.
EMA Lines: Short- and long-term smoothing of delta for trend and divergence detection.
Cross Events: Represent moments when short EMA crosses over delta or long EMA, often signaling a directional momentum change.
Tables and Labels: Quantify volume dominance and flow state, helping assess if flow aligns with price structure.
How to Best Use
For context: Observe overall slope and temperature of the third MA. High deviations often precede cooling or reversal.
For confluence: Look for alignment between price structure (e.g., higher highs) and delta divergence to identify exhaustion or continuation.
For short-term timing: Watch EMA crosses and volume conditions (e.g., buy volume increasing while delta crosses above zero).
Added Value Compared to Other Free Indicators
Multi-exchange Aggregation: Includes spot and perp data across major exchanges with flexible inclusion settings.
Granular Delta Estimation: Uses candle body/wick proportions rather than simple up/down tick assumptions.
Context-Aware Visualization: Integrates volume gradient, statistical deviation zones, and divergence overlays in one compact view.
Highly Customizable: Users can fine-tune divergence, moving average, color scheme, and table display independently.
Integrated View with Synergistic Logic: Unlike using several isolated scripts, this indicator unifies delta flow, divergence, volume dominance, and statistical context into one coherent framework. This synergy reduces the need to reconcile signals from different sources and allows for clearer judgment when multiple conditions align.
Limitations and Disclaimers
Delta Approximation: Calculated using heuristic candle shape assumptions; not a tick-level order book delta.
Exchange Coverage: Relies on availability of correct tickers and historical volume data via TradingView’s request.security .
Visual Lag: Cumulative delta and divergence patterns may develop over several bars and are not predictive on their own.
No Entry Signals: This indicator does not provide trading signals, nor does it evaluate risk or price targets.
Additional Limitations
This indicator estimates delta from candle shape and volume distribution heuristics. In low-liquidity markets or on lower timeframes, this estimation may misrepresent actual flow dynamics, especially during volatile spikes or news-driven moves. Divergence patterns may appear with delay or persist without price reaction, particularly in ranging or algorithmically driven markets. Users should combine these tools with broader context and price action awareness rather than relying on isolated delta events.

Momentum DivergenceOverview
The Momentum Divergence Oscillator is a valuable tool designed for traders who are familiar with basic charting but want to deepen their market insights. This indicator combines a momentum calculation with divergence detection, presenting the data in an intuitive way with a blue momentum line and colored divergence signals ("Bull" and "Bear"). It’s perfect for refining entry and exit points across various timeframes, especially for scalping or swing trading strategies.
Understanding the Concepts
What is Momentum?
Momentum measures the speed and strength of a price movement by comparing the current closing price to a previous close over a set period. In this indicator, it’s calculated as the difference between the current close and the close from a user-defined number of bars ago (default: 10). A rising momentum line indicates accelerating upward momentum, while a falling line suggests slowing momentum or a potential reversal. This helps you gauge whether a trend is gaining power or losing steam, making it a key indicator for spotting overbought or oversold conditions.
What is a Divergence?
A divergence occurs when the price action and the momentum indicator move in opposite directions, often signaling a potential trend reversal. The Momentum Divergence Oscillator highlights two types:
Bullish Divergence: When the price forms a lower low (indicating weakness), but the momentum shows a higher low (suggesting underlying strength). This can foreshadow an upward reversal.
Bearish Divergence: When the price reaches a higher high (showing strength), but the momentum records a lower high (indicating fading momentum). This may hint at an impending downward turn.
How the Indicator Works
The indicator plots a momentum line in a separate pane below your chart, giving you a clear view of price momentum over time. It also scans for divergences using adjustable lookback periods (default: 5 bars left and right) and a range window (default: 5-60 bars) to ensure relevance. When a divergence is detected, it’s visually highlighted, and you can customize the sensitivity through input settings like the momentum length and pivot lookback. Alerts are included to notify you of new divergence signals in real-time, saving you from constant monitoring.
How to Apply It
Identifying Opportunities: Use bullish divergences ("Bull") as a cue to consider long positions, especially when confirmed by support levels or a moving average crossover. Bearish divergences ("Bear") can signal short opportunities, particularly near resistance zones.
Combining with Other Tools: Pair this oscillator with indicators like the Relative Strength Index (RSI) or volume analysis to filter out false signals and increase confidence in your trades. For example, a bullish divergence with rising volume can be a stronger buy signal.
Timeframe Flexibility: Test it on shorter timeframes (e.g., 5-minute charts) for quick scalping trades or longer ones (e.g., 1-hour or 4-hour charts) for swing trading, adjusting the momentum length to suit the market’s pace.
Alert Setup: Enable the built-in alerts to get notified when a divergence forms, allowing you to react promptly without staring at the screen all day.
Strategy Example
Spot a bullish divergence on a 15-minute chart where the price hits a lower low, but the momentum rises.
Confirm with a break above a 20-period EMA and increasing volume.
Enter a long position with a stop-loss below the recent low and a take-profit near the next resistance level.
Customization Tips
Adjust the "Momentum Length" (default: 10) to make the oscillator more or less sensitive—shorter lengths react faster, while longer ones smooth out noise.
Tweak the "Pivot Lookback" settings to widen or narrow the divergence detection range based on your trading style.
Use the "Range Upper/Lower" inputs to focus on divergences within a specific timeframe that matches your strategy.
Important Considerations
b]This indicator is a technical analysis tool, not a guaranteed trading system. Always pair it with a solid strategy and strict risk management, such as setting stop-losses.
In strong trending markets, divergences can sometimes produce false signals. Consider adding a trend filter (e.g., ADX below 25) to avoid whipsaws.
Experiment with the settings on a demo account or backtest to find what works best for your preferred markets and timeframes.

ALNADAMomentum indicator try to discover market turning points early, using trend, divergence, and momentum.

Fibonacci Sequence Moving Average [BackQuant]Fibonacci Sequence Moving Average with Adaptive Oscillator
1. Overview
The Fibonacci Sequence Moving Average indicator is a two‑part trading framework that combines a custom moving average built from the famous Fibonacci number set with a fully featured oscillator, normalisation engine and divergence suite. The moving average half delivers an adaptive trend line that respects natural market rhythms, while the oscillator half translates that trend information into a bounded momentum stream that is easy to read, easy to compare across assets and rich in confluence signals. Everything from weighting logic to colour palettes can be customised, so the tool comfortably fits scalpers zooming into one‑minute candles as well as position traders running multi‑month trend following campaigns.
2. Core Calculation
Fibonacci periods – The default length array is 5, 8, 13, 21, 34. A single multiplier input lets you scale the whole family up or down without breaking the golden‑ratio spacing. For example a multiplier of 3 yields 15, 24, 39, 63, 102.
Component averages – Each period is passed through Simple Moving Average logic to produce five baseline curves (ma1 through ma5).
Weighting methods – You decide how those five values are blended:
• Equal weighting treats every curve the same.
• Linear weighting applies factors 1‑to‑5 so the slowest curve counts five times as much as the fastest.
• Exponential weighting doubles each step for a fast‑reacting yet still smooth line.
• Fibonacci weighting multiplies each curve by its own period value, honouring the spirit of ratio mathematics.
Smoothing engine – The blended average is then smoothed a second time with your choice of SMA, EMA, DEMA, TEMA, RMA, WMA or HMA. A short smoothing length keeps the result lively, while longer lengths create institution‑grade glide paths that act like dynamic support and resistance.
3. Oscillator Construction
Once the smoothed Fib MA is in place, the script generates a raw oscillator value in one of three flavours:
• Distance – Percentage distance between price and the average. Great for mean‑reversion.
• Momentum – Percentage change of the average itself. Ideal for trend acceleration studies.
• Relative – Distance divided by Average True Range for volatility‑aware scaling.
That raw series is pushed through a look‑back normaliser that rescales every reading into a fixed −100 to +100 window. The normalisation window defaults to 100 bars but can be tightened for fast markets or expanded to capture long regimes.
4. Visual Layer
The oscillator line is gradient‑coloured from deep red through sky blue into bright green, so you can spot subtle momentum shifts with peripheral vision alone. There are four horizontal guide lines: Extreme Bear at −50, Bear Threshold at −20, Bull Threshold at +20 and Extreme Bull at +50. Soft fills above and below the thresholds reinforce the zones without cluttering the chart.
The smoothed Fib MA can be plotted directly on price for immediate trend context, and each of the five component averages can be revealed for educational or research purposes. Optional bar‑painting mirrors oscillator polarity, tinting candles green when momentum is bullish and red when momentum is bearish.
5. Divergence Detection
The script automatically looks for four classes of divergences between price pivots and oscillator pivots:
Regular Bullish, signalling a possible bottom when price prints a lower low but the oscillator prints a higher low.
Hidden Bullish, often a trend‑continuation cue when price makes a higher low while the oscillator slips to a lower low.
Regular Bearish, marking potential tops when price carves a higher high yet the oscillator steps down.
Hidden Bearish, hinting at ongoing downside when price posts a lower high while the oscillator pushes to a higher high.
Each event is tagged with an ℝ or ℍ label at the oscillator pivot, colour‑coded for clarity. Look‑back distances for left and right pivots are fully adjustable so you can fine‑tune sensitivity.
6. Alerts
Five ready‑to‑use alert conditions are included:
• Bullish when the oscillator crosses above +20.
• Bearish when it crosses below −20.
• Extreme Bullish when it pops above +50.
• Extreme Bearish when it dives below −50.
• Zero Cross for momentum inflection.
Attach any of these to TradingView notifications and stay updated without staring at charts.
7. Practical Applications
Swing trading trend filter – Plot the smoothed Fib MA on daily candles and only trade in its direction. Enter on oscillator retracements to the 0 line.
Intraday reversal scouting – On short‑term charts let Distance mode highlight overshoots beyond ±40, then fade those moves back to mean.
Volatility breakout timing – Use Relative mode during earnings season or crypto news cycles to spot momentum surges that adjust for changing ATR.
Divergence confirmation – Layer the oscillator beneath price structure to validate double bottoms, double tops and head‑and‑shoulders patterns.
8. Input Summary
• Source, Fibonacci multiplier, weighting method, smoothing length and type
• Oscillator calculation mode and normalisation look‑back
• Divergence look‑back settings and signal length
• Show or hide options for every visual element
• Full colour and line width customisation
9. Best Practices
Avoid using tiny multipliers on illiquid assets where the shortest Fibonacci window may drop under three bars. In strong trends reduce divergence sensitivity or you may see false counter‑trend flags. For portfolio scanning set oscillator to Momentum mode, hide thresholds and colour bars only, which turns the indicator into a heat‑map that quickly highlights leaders and laggards.
10. Final Notes
The Fibonacci Sequence Moving Average indicator seeks to fuse the mathematical elegance of the golden ratio with modern signal‑processing techniques. It is not a standalone trading system, rather a multi‑purpose information layer that shines when combined with market structure, volume analysis and disciplined risk management. Always test parameters on historical data, be mindful of slippage and remember that past performance is never a guarantee of future results. Trade wisely and enjoy the harmony of Fibonacci mathematics in your technical toolkit.

52SIGNAL RECIPE Smart Money Detector : CME + Exchanges=================52SIGNAL RECIPE CME-Exchange Smart Money Detector=================
◆ Overview
The 52SIGNAL RECIPE CME-Exchange Smart Money Detector is an advanced technical indicator designed to identify institutional and smart money movements by analyzing and comparing futures markets across both CME and cryptocurrency exchanges. This powerful tool detects coordinated buying and selling patterns that often precede significant price movements, giving traders an edge in anticipating market direction.
What makes this indicator unique is its cross-market verification approach. By requiring confirmation from both CME Bitcoin futures (dominated by institutional players) and crypto exchange futures (with broader market participation), it significantly reduces false signals and identifies high-probability smart money footprints that typically lead market movements.
─────────────────────────────────────
◆ Key Features
• Dual Market Confirmation: Simultaneously analyzes both CME Bitcoin futures and exchange futures charts to identify synchronized smart money activity
• Smart Volume Analysis: Uses advanced algorithms to separate buying and selling volume based on candle structure and price action
• Energy Wave Visualization: Displays smart money signals as intuitive energy waves with varying sizes reflecting signal strength
• Strength Rating System: Quantifies signal strength on a 0-100% scale, with multiple visualization levels (10%+, 40%+, 60%+, 80%+)
• Candlestick Pattern Integration: Incorporates bullish/bearish candle formations to enhance signal reliability
• Volume Spike Detection: Identifies abnormal volume increases that often accompany smart money positioning
• Trend Context Analysis: Evaluates signals in relation to current market trend for higher probability setups
• Dynamic Strength Calculation: Uses a multi-factor model considering volume ratio, buying/selling imbalance, candle structure, and trend alignment
• Transparent Signal Labeling: Displays precise strength percentage values with each signal for clear decision-making
• Real-time Institutional Flow Monitor: Tracks the footprints of large players across both regulated (CME) and crypto exchange markets
─────────────────────────────────────
◆ Understanding Signal Types
■ Buy Signal Energy Waves (Green)
• Definition: Detected when significant buying pressure appears simultaneously on both CME and exchange futures, typically on bearish candles
• Visual Appearance: Green circular waves below price bars, with size/opacity increasing with signal strength
• Market Interpretation: Indicates institutional buying interest even as price is declining, often preceding bullish reversals
• Signal Strength Factors:
▶ Higher buying volume relative to selling volume
▶ Above-average total volume
▶ Lower wicks on bearish candles
▶ Appearance at key support levels
▶ Coinciding with oversold conditions
■ Sell Signal Energy Waves (Red)
• Definition: Detected when significant selling pressure appears simultaneously on both CME and exchange futures, typically on bullish candles
• Visual Appearance: Red circular waves above price bars, with size/opacity increasing with signal strength
• Market Interpretation: Indicates institutional selling interest even as price is rising, often preceding bearish reversals
• Signal Strength Factors:
▶ Higher selling volume relative to buying volume
▶ Above-average total volume
▶ Upper wicks on bullish candles
▶ Appearance at key resistance levels
▶ Coinciding with overbought conditions
─────────────────────────────────────
◆ Signal Strength Understanding
■ The Four Strength Levels
• Level 1 (10-39%): Initial Detection
▶ Visual: Smallest energy wave
▶ Meaning: Early smart money positioning detected
▶ Usage: Early warning, prepare for possible setup
• Level 2 (40-59%): Moderate Strength
▶ Visual: Medium-small energy wave
▶ Meaning: Clearer institutional positioning
▶ Usage: Begin position planning, watch for confirmation
• Level 3 (60-79%): Strong Signal
▶ Visual: Medium-large energy wave
▶ Meaning: Significant smart money footprint
▶ Usage: High-probability setup forming, consider entry
• Level 4 (80-100%): Exceptional Strength
▶ Visual: Largest energy wave
▶ Meaning: Powerful institutional movement confirmed
▶ Usage: Highest probability setup, strong conviction entry point
■ Understanding Signal Strength Calculation
• Volume Component (0-50 points):
▶ Measures how current volume compares to recent average
▶ Maximum points when volume is 2x or higher than average
• Buy/Sell Ratio Component (0-50 points):
▶ Measures imbalance between buying and selling pressure
▶ Maximum points when ratio exceeds predefined multiplier threshold
• Advanced Weighting Factors:
▶ Candle Structure: Body size, wick length, and orientation
▶ Trend Alignment: Signal relationship to current trend
▶ Volume Spike: Abnormal volume increase detection
▶ Cross-Market Confirmation: Strength of signal alignment between CME and exchange
─────────────────────────────────────
◆ Practical Trading Applications
■ Reversal Trading Strategy
• Buy Signal Application:
▶ Setup: Strong buy energy wave (60%+) on a bearish candle
▶ Entry: After confirmation candle following the signal
▶ Stop Loss: Below recent low or 1 ATR below entry
▶ Take Profit: Previous resistance or 1:2 risk-reward minimum
▶ Enhancers: Signal occurring at support zone, oversold conditions, or trend line tests
• Sell Signal Application:
▶ Setup: Strong sell energy wave (60%+) on a bullish candle
▶ Entry: After confirmation candle following the signal
▶ Stop Loss: Above recent high or 1 ATR above entry
▶ Take Profit: Previous support or 1:2 risk-reward minimum
▶ Enhancers: Signal occurring at resistance zone, overbought conditions, or trend line tests
■ Trend Continuation Strategy
• During Uptrends:
▶ Focus on buy signals that appear during pullbacks
▶ Higher probability when signals occur at key moving averages or support levels
▶ Enter on strength when price shows signs of resuming the uptrend
• During Downtrends:
▶ Focus on sell signals that appear during relief rallies
▶ Higher probability when signals occur at key moving averages or resistance levels
▶ Enter on strength when price shows signs of resuming the downtrend
■ Multiple Timeframe Approach
• Signal Confirmation Across Timeframes:
▶ Major signals on higher timeframes (4H, daily) provide strategic direction
▶ Signals on lower timeframes (15m, 1H) offer tactical entry points
▶ Highest probability setups occur when signals align across multiple timeframes
• Signal Clustering:
▶ Multiple signals in the same price area significantly increase probability
▶ Look for areas where both buy and sell signals have appeared, indicating battleground zones
▶ The most recent signal direction often wins these battles
─────────────────────────────────────
◆ Technical Foundation
■ Why Cross-Market Confirmation Matters
• Institutional Participation:
▶ CME Bitcoin futures are dominated by regulated institutional investors
▶ Crypto exchange futures include both retail and institutional players
▶ When both markets show the same smart money pattern, the signal reliability increases dramatically
• Market Inefficiency Exploitation:
▶ Large players often position across multiple venues to minimize market impact
▶ This coordinated activity creates detectable footprints when analyzed correctly
▶ Cross-market confirmation helps filter out market noise and isolate true smart money movements
■ Smart Volume Calculation Methodology
• Price-Volume Relationship Analysis:
▶ Uses candle structure to estimate buying vs. selling volume
▶ Buying volume = Total volume × (Close - Low) / (High - Low)
▶ Selling volume = Total volume × (High - Close) / (High - Low)
• Signal Triggering Logic:
▶ Buy signal: When buying volume exceeds selling volume by multiplier factor
▶ Sell signal: When selling volume exceeds buying volume by multiplier factor
▶ Both conditions must be met simultaneously on CME and exchange futures
• Advanced Pattern Recognition:
▶ Evaluates candle body-to-range ratio for signal quality
▶ Analyzes wick length and position for additional confirmation
▶ Considers recent highs/lows to detect potential turning points
─────────────────────────────────────
◆ Indicator Settings Guide
■ Main Settings
• CME Bitcoin Futures Symbol:
▶ Default: CME:BTC1!
▶ Purpose: Sets the CME futures contract to analyze alongside current chart
• Buy/Sell Volume Multiplier:
▶ Default: 3.0
▶ Range: 1.0-10.0
▶ Purpose: Determines how much buying volume must exceed selling volume (or vice versa) to trigger a signal
▶ Higher values = fewer but stronger signals
▶ Lower values = more signals but potentially lower reliability
■ Volume Filter Settings
• Enable Volume Filter:
▶ Default: Enabled
▶ Purpose: When enabled, only considers candles with above-threshold volume
• Volume Average Period:
▶ Default: 20 candles
▶ Range: 5-200 candles
▶ Purpose: Sets the lookback period for calculating average volume
• Volume Threshold:
▶ Default: 150%
▶ Range: 10%-500%
▶ Purpose: Minimum volume percentage (of average) required for signal consideration
▶ Higher values focus on only the most significant volume spikes
■ Signal Visualization
• Show Signal Strength Value:
▶ Default: Enabled
▶ Purpose: Displays the exact percentage strength value with each signal
• Energy Wave Colors:
▶ Buy Energy Wave: Green (#00ff80)
▶ Sell Energy Wave: Red (#ff4040)
▶ Purpose: Customize the appearance of energy waves for visual preference
■ Advanced Settings
• Use Advanced Strength Calculation:
▶ Default: Enabled
▶ Purpose: When enabled, uses the full multi-factor model for signal strength
▶ When disabled, uses only basic volume and ratio factors
─────────────────────────────────────
◆ Synergy with Other Indicators
• Support/Resistance Levels:
▶ Smart money signals occurring at key support/resistance significantly increase reliability
▶ Particularly powerful when signals appear at tested price levels
• Moving Averages:
▶ Signals near key moving averages (50MA, 200MA) often indicate institutional interest
▶ Moving average crosses combined with smart money signals create high-probability setups
• RSI/Momentum Indicators:
▶ Buy signals in oversold conditions increase probability of successful reversal
▶ Sell signals in overbought conditions increase probability of successful reversal
• Volume Profile:
▶ Signals occurring at high volume nodes often indicate significant turning points
▶ Low volume nodes between high volume areas can act as acceleration zones after signal triggers
• Market Structure:
▶ Smart money signals that break key market structure levels (higher highs/lows or lower highs/lows) are particularly significant
▶ Can signal the early stages of trend changes when aligned with structure breaks
─────────────────────────────────────
◆ Conclusion
The 52SIGNAL RECIPE CME-Exchange Smart Money Detector provides traders with a powerful edge by revealing institutional positioning across both regulated futures and crypto exchange markets. By requiring synchronized signals from both venues, it cuts through market noise to identify the most reliable smart money footprints.
What sets this indicator apart is its sophisticated cross-market verification system. Rather than relying on signals from a single market, it only triggers when both CME and exchange futures display the same smart money pattern simultaneously. This approach dramatically reduces false signals and highlights truly significant institutional activity.
The intuitive energy wave visualization system makes it easy to spot signals of varying strength, while the transparent percentage rating allows for objective assessment of each opportunity. By focusing on these dual-confirmed smart money movements, traders can position themselves alongside institutional players rather than against them.
Remember that the most powerful signals typically appear at key market junctures, often before significant price movements. By incorporating this indicator into your trading approach, you gain insight into institutional positioning that can help anticipate market direction with greater confidence.
─────────────────────────────────────
※ Disclaimer: Like all trading tools, the CME-Exchange Smart Money Detector should be used as a supplementary indicator and not relied upon exclusively for trading decisions. Past patterns of institutional behavior may not guarantee future market movements. Always employ appropriate risk management strategies in your trading.
================52SIGNAL RECIPE CME-Exchange Smart Money Detector==================
◆ 개요
52SIGNAL RECIPE CME-Exchange Smart Money Detector는 CME와 암호화폐 거래소의 선물 시장을 동시에 분석하여 기관 및 스마트 머니의 움직임을 포착하는 고급 기술적 지표입니다. 이 강력한 도구는 주요 가격 움직임에 선행하는 조직적인 매수 및 매도 패턴을 감지하여 트레이더들에게 시장 방향 예측에 유리한 정보를 제공합니다.
이 지표의 독보적인 특징은 교차 시장 검증 접근법에 있습니다. CME 비트코인 선물(기관 투자자 중심)과 암호화폐 거래소 선물(광범위한 시장 참여자) 모두에서 확인을 요구함으로써, 허위 신호를 크게 줄이고 일반적으로 시장 움직임을 선도하는 고확률 스마트 머니 흔적을 식별합니다.
─────────────────────────────────────
◆ 주요 특징
• 듀얼 마켓 확인: CME 비트코인 선물과 거래소 선물 차트를 동시에 분석하여 동기화된 스마트 머니 활동 식별
• 스마트 볼륨 분석: 캔들 구조와 가격 행동을 기반으로 매수 및 매도 볼륨을 분리하는 고급 알고리즘 사용
• 에너지 파동 시각화: 스마트 머니 신호를 신호 강도를 반영하는 다양한 크기의 직관적인 에너지 파동으로 표시
• 강도 평가 시스템: 신호 강도를 0-100% 척도로 수치화하고 여러 시각화 레벨(10%+, 40%+, 60%+, 80%+) 제공
• 캔들스틱 패턴 통합: 신호 신뢰성을 높이기 위해 상승/하락 캔들 형성을 분석에 통합
• 볼륨 스파이크 감지: 스마트 머니 포지셔닝을 동반하는 비정상적인 볼륨 증가 식별
• 추세 맥락 분석: 현재 시장 추세와 관련하여 신호를 평가하여 높은 확률의 설정 제공
• 동적 강도 계산: 볼륨 비율, 매수/매도 불균형, 캔들 구조 및 추세 일치도를 고려하는 다중 요소 모델 사용
• 투명한 신호 라벨링: 명확한 의사 결정을 위해 각 신호와 함께 정확한 강도 백분율 값 표시
• 실시간 기관 자금 흐름 모니터: 규제된(CME) 시장과 암호화폐 거래소 시장 모두에서 대형 플레이어의 흔적 추적
─────────────────────────────────────
◆ 신호 유형 이해하기
■ 매수 신호 에너지 파동 (녹색)
• 정의: 일반적으로 하락 캔들에서 CME와 거래소 선물 모두에서 동시에 상당한 매수 압력이 감지될 때 발생
• 시각적 모습: 가격 바 아래에 녹색 원형 파동으로 표시되며, 신호 강도에 따라 크기/불투명도 증가
• 시장 해석: 가격이 하락하는 동안에도 기관의 매수 관심이 있음을 나타내며, 종종 상승 반전에 선행
• 신호 강도 요소:
▶ 매도 볼륨 대비 높은 매수 볼륨
▶ 평균 이상의 총 거래량
▶ 하락 캔들의 아래 꼬리
▶ 주요 지지 수준에서의 출현
▶ 과매도 조건과 일치
■ 매도 신호 에너지 파동 (적색)
• 정의: 일반적으로 상승 캔들에서 CME와 거래소 선물 모두에서 동시에 상당한 매도 압력이 감지될 때 발생
• 시각적 모습: 가격 바 위에 적색 원형 파동으로 표시되며, 신호 강도에 따라 크기/불투명도 증가
• 시장 해석: 가격이 상승하는 동안에도 기관의 매도 관심이 있음을 나타내며, 종종 하락 반전에 선행
• 신호 강도 요소:
▶ 매수 볼륨 대비 높은 매도 볼륨
▶ 평균 이상의 총 거래량
▶ 상승 캔들의 위 꼬리
▶ 주요 저항 수준에서의 출현
▶ 과매수 조건과 일치
─────────────────────────────────────
◆ 신호 강도 이해하기
■ 네 가지 강도 레벨
• 레벨 1 (10-39%): 초기 감지
▶ 시각적: 가장 작은 에너지 파동
▶ 의미: 초기 스마트 머니 포지셔닝 감지
▶ 활용: 초기 경고, 가능한 설정 준비
• 레벨 2 (40-59%): 중간 강도
▶ 시각적: 중간-작은 에너지 파동
▶ 의미: 더 명확한 기관 포지셔닝
▶ 활용: 포지션 계획 시작, 확인 대기
• 레벨 3 (60-79%): 강한 신호
▶ 시각적: 중간-큰 에너지 파동
▶ 의미: 중요한 스마트 머니 흔적
▶ 활용: 고확률 설정 형성, 진입 고려
• 레벨 4 (80-100%): 예외적 강도
▶ 시각적: 가장 큰 에너지 파동
▶ 의미: 강력한 기관 움직임 확인
▶ 활용: 최고 확률 설정, 강한 확신의 진입 지점
■ 신호 강도 계산 이해하기
• 볼륨 구성 요소 (0-50 포인트):
▶ 현재 볼륨이 최근 평균과 비교하여 얼마나 높은지 측정
▶ 볼륨이 평균보다 2배 이상 높을 때 최대 포인트 부여
• 매수/매도 비율 구성 요소 (0-50 포인트):
▶ 매수와 매도 압력 간의 불균형 측정
▶ 비율이 미리 정의된 배율 임계값을 초과할 때 최대 포인트 부여
• 고급 가중치 요소:
▶ 캔들 구조: 몸통 크기, 꼬리 길이 및 방향
▶ 추세 일치: 현재 추세와의 신호 관계
▶ 볼륨 스파이크: 비정상적인 볼륨 증가 감지
▶ 교차 시장 확인: CME와 거래소 간 신호 일치 강도
─────────────────────────────────────
◆ 실전 트레이딩 응용
■ 반전 트레이딩 전략
• 매수 신호 응용:
▶ 설정: 하락 캔들에서 강한 매수 에너지 파동(60%+)
▶ 진입: 신호 이후 확인 캔들 이후
▶ 손절: 최근 저점 아래 또는 진입점 아래 1 ATR
▶ 이익실현: 이전 저항 또는 최소 1:2 리스크-리워드
▶ 강화 요소: 지지 구역, 과매도 조건 또는 추세선 테스트에서 발생하는 신호
• 매도 신호 응용:
▶ 설정: 상승 캔들에서 강한 매도 에너지 파동(60%+)
▶ 진입: 신호 이후 확인 캔들 이후
▶ 손절: 최근 고점 위 또는 진입점 위 1 ATR
▶ 이익실현: 이전 지지 또는 최소 1:2 리스크-리워드
▶ 강화 요소: 저항 구역, 과매수 조건 또는 추세선 테스트에서 발생하는 신호
■ 추세 지속 전략
• 상승 추세 중:
▶ 조정 중에 나타나는 매수 신호에 집중
▶ 주요 이동평균선이나 지지 수준에서 신호가 발생할 때 확률이 높음
▶ 가격이 상승 추세를 재개할 징후를 보일 때 강도에 맞춰 진입
• 하락 추세 중:
▶ 일시적 반등 중에 나타나는 매도 신호에 집중
▶ 주요 이동평균선이나 저항 수준에서 신호가 발생할 때 확률이 높음
▶ 가격이 하락 추세를 재개할 징후를 보일 때 강도에 맞춰 진입
■ 다중 시간프레임 접근법
• 다양한 시간프레임에서의 신호 확인:
▶ 상위 시간프레임(4시간, 일봉)의 주요 신호는 전략적 방향 제공
▶ 하위 시간프레임(15분, 1시간)의 신호는 전술적 진입 지점 제공
▶ 여러 시간프레임에서 신호가 일치할 때 가장 높은 확률의 설정 발생
• 신호 클러스터링:
▶ 동일한 가격 영역에서 여러 신호가 발생하면 확률이 크게 증가
▶ 매수와 매도 신호가 모두 나타난 영역을 찾아 전투 구역 식별
▶ 이러한 전투에서는 대개 가장 최근의 신호 방향이 우세
─────────────────────────────────────
◆ 기술적 기반
■ 교차 시장 확인이 중요한 이유
• 기관 참여:
▶ CME 비트코인 선물은 규제된 기관 투자자가 주도
▶ 암호화폐 거래소 선물은 소매 및 기관 플레이어 모두 포함
▶ 두 시장이 동일한 스마트 머니 패턴을 보일 때 신호 신뢰성이 크게 증가
• 시장 비효율성 활용:
▶ 대형 플레이어들은 시장 영향을 최소화하기 위해 여러 거래소에 걸쳐 포지션을 취하는 경우가 많음
▶ 이러한 조직적인 활동은 올바르게 분석할 때 감지 가능한 흔적을 남김
▶ 교차 시장 확인은 시장 노이즈를 필터링하고 진정한 스마트 머니 움직임을 분리하는 데 도움
■ 스마트 볼륨 계산 방법론
• 가격-볼륨 관계 분석:
▶ 캔들 구조를 사용하여 매수 대 매도 볼륨 추정
▶ 매수 볼륨 = 총 볼륨 × (종가 - 저가) / (고가 - 저가)
▶ 매도 볼륨 = 총 볼륨 × (고가 - 종가) / (고가 - 저가)
• 신호 트리거 로직:
▶ 매수 신호: 매수 볼륨이 매도 볼륨을 배율 요소만큼 초과할 때
▶ 매도 신호: 매도 볼륨이 매수 볼륨을 배율 요소만큼 초과할 때
▶ 두 조건 모두 CME와 거래소 선물에서 동시에 충족되어야 함
• 고급 패턴 인식:
▶ 신호 품질을 위한 캔들 몸통-범위 비율 평가
▶ 추가 확인을 위한 꼬리 길이 및 위치 분석
▶ 잠재적 전환점을 감지하기 위해 최근 고점/저점 고려
─────────────────────────────────────
◆ 지표 설정 가이드
■ 주요 설정
• CME 비트코인 선물 심볼:
▶ 기본값: CME:BTC1!
▶ 목적: 현재 차트와 함께 분석할 CME 선물 계약 설정
• 매수/매도 볼륨 배율:
▶ 기본값: 3.0
▶ 범위: 1.0-10.0
▶ 목적: 신호를 트리거하기 위해 매수 볼륨이 매도 볼륨을 얼마나 초과해야 하는지(또는 그 반대) 결정
▶ 높은 값 = 적지만 더 강한 신호
▶ 낮은 값 = 더 많은 신호지만 잠재적으로 낮은 신뢰성
■ 볼륨 필터 설정
• 볼륨 필터 활성화:
▶ 기본값: 활성화됨
▶ 목적: 활성화되면 임계값 이상의 볼륨을 가진 캔들만 고려
• 볼륨 평균 기간:
▶ 기본값: 20 캔들
▶ 범위: 5-200 캔들
▶ 목적: 평균 볼륨 계산을 위한 룩백 기간 설정
• 볼륨 임계값:
▶ 기본값: 150%
▶ 범위: 10%-500%
▶ 목적: 신호 고려에 필요한 최소 볼륨 백분율(평균 대비)
▶ 높은 값은 가장 중요한 볼륨 스파이크에만 집중
■ 신호 시각화
• 신호 강도 값 표시:
▶ 기본값: 활성화됨
▶ 목적: 각 신호와 함께 정확한 백분율 강도 값 표시
• 에너지 파동 색상:
▶ 매수 에너지 파동: 녹색(#00ff80)
▶ 매도 에너지 파동: 적색(#ff4040)
▶ 목적: 시각적 선호도에 맞게 에너지 파동의 모양 사용자 정의
■ 고급 설정
• 고급 강도 계산 사용:
▶ 기본값: 활성화됨
▶ 목적: 활성화되면 신호 강도에 전체 다중 요소 모델 사용
▶ 비활성화되면 기본 볼륨 및 비율 요소만 사용
─────────────────────────────────────
◆ 다른 지표와의 시너지
• 지지/저항 레벨:
▶ 주요 지지/저항에서 발생하는 스마트 머니 신호는 신뢰성을 크게 높임
▶ 특히 테스트된 가격 레벨에서 신호가 나타날 때 강력함
• 이동평균선:
▶ 주요 이동평균선(50MA, 200MA) 근처의 신호는 종종 기관의 관심을 나타냄
▶ 이동평균선 교차와 스마트 머니 신호의 조합은 고확률 설정 생성
• RSI/모멘텀 지표:
▶ 과매도 조건에서의 매수 신호는 성공적인 반전 확률 증가
▶ 과매수 조건에서의 매도 신호는 성공적인 반전 확률 증가
• 볼륨 프로파일:
▶ 높은 볼륨 노드에서 발생하는 신호는 종종 중요한 전환점을 나타냄
▶ 높은 볼륨 영역 사이의 낮은 볼륨 노드는 신호 트리거 후 가속 구간으로 작용할 수 있음
• 시장 구조:
▶ 주요 시장 구조 레벨(높은 고점/저점 또는 낮은 고점/저점)을 깨는 스마트 머니 신호는 특히 중요
▶ 구조 깨짐과 일치할 때 추세 변화의 초기 단계를 알릴 수 있음
─────────────────────────────────────
◆ 결론
52SIGNAL RECIPE CME-Exchange Smart Money Detector는 규제된 선물 시장과 암호화폐 거래소 시장 모두에서 기관의 포지셔닝을 드러냄으로써 트레이더에게 강력한 우위를 제공합니다. 두 거래소에서 동기화된 신호를 요구함으로써, 시장 노이즈를 제거하고 가장 신뢰할 수 있는 스마트 머니 흔적을 식별합니다.
이 지표를 차별화하는 것은 정교한 교차 시장 검증 시스템입니다. 단일 시장의 신호에 의존하는 대신, CME와 거래소 선물 모두가 동시에 동일한 스마트 머니 패턴을 표시할 때만 트리거됩니다. 이 접근 방식은 허위 신호를 크게 줄이고 진정으로 중요한 기관 활동을 강조합니다.
직관적인 에너지 파동 시각화 시스템을 통해 다양한 강도의 신호를 쉽게 발견할 수 있으며, 투명한 백분율 평가를 통해 각 기회를 객관적으로 평가할 수 있습니다. 이러한 이중 확인된 스마트 머니 움직임에 집중함으로써, 트레이더는 기관 참가자들에 대항하기보다는 그들과 함께 포지션을 취할 수 있습니다.
가장 강력한 신호는 일반적으로 주요 시장 변곡점에서, 종종 중요한 가격 움직임 이전에 나타난다는 점을 기억하세요. 이 지표를 트레이딩 접근법에 통합함으로써, 시장 방향을 더 높은 확신으로 예측하는 데 도움이 되는 기관 포지셔닝에 대한 통찰력을 얻을 수 있습니다.
─────────────────────────────────────
※ 면책 조항: 모든 트레이딩 도구와 마찬가지로, CME-Exchange Smart Money Detector는 보조 지표로 사용되어야 하며 트레이딩 결정을 전적으로 의존해서는 안 됩니다. 과거의 기관 행동 패턴이 미래 시장 움직임을 보장하지는 않습니다. 항상 적절한 리스크 관리 전략을 트레이딩에 사용하세요.

Apex Edge - RSI Trend LinesThe Apex Edge - RSI Trend Lines indicator is a precision tool that automatically draws real-time trendlines on the RSI oscillator using confirmed pivot highs and lows. These dynamic trendlines track RSI structure in motion, helping you anticipate breakout zones, reversals, and hidden divergences.
Every time a new pivot forms, the indicator automatically re-draws the RSI trendline between the two most recent pivots — giving you an always-current view of momentum structure. You’ll instantly see when RSI begins compressing or expanding, long before price reacts.
Key Features: • Dynamic RSI trendlines drawn from the last 2 pivots
• Auto re-draws in real-time as new pivots form
• Optional "Full Extend" or "Pivot Only" modes
• Slope color-coded: green = support, red = resistance
• Built-in dotted RSI levels (30/70 default)
• Alert conditions for RSI trendline breakout signals
• Ideal for spotting divergence, compression, and early SMC confluence
This is not your average RSI — it’s a fully reactive momentum edge overlay designed to give you clarity, structure, and timing from within the oscillator itself. Perfect for traders using Smart Money Concepts, divergence setups, or algorithmic trend tracking.
⚔️ Built for precision. Built for edge. Built for Apex.

Diamond Peaks [EdgeTerminal]The Diamond Peaks indicator is a comprehensive technical analysis tool that uses a few mathematical models to identify high-probability trading opportunities. This indicator goes beyond traditional support and resistance identification by incorporating volume analysis, momentum divergences, advanced price action patterns, and market sentiment indicators to generate premium-quality buy and sell signals.
Dynamic Support/Resistance Calculation
The indicator employs an adaptive algorithm that calculates support and resistance levels using a volatility-adjusted lookback period. The base calculation uses ta.highest(length) and ta.lowest(length) functions, where the length parameter is dynamically adjusted using the formula: adjusted_length = base_length * (1 + (volatility_ratio - 1) * volatility_factor). The volatility ratio is computed as current_ATR / average_ATR over a 50-period window, ensuring the lookback period expands during volatile conditions and contracts during calm periods. This mathematical approach prevents the indicator from using fixed periods that may become irrelevant during different market regimes.
Momentum Divergence Detection Algorithm
The divergence detection system uses a mathematical comparison between price series and oscillator values over a specified lookback period. For bullish divergences, the algorithm identifies when recent_low < previous_low while simultaneously indicator_at_recent_low > indicator_at_previous_low. The inverse logic applies to bearish divergences. The system tracks both RSI (calculated using Pine Script's standard ta.rsi() function with Wilder's smoothing) and MACD (using ta.macd() with exponential moving averages). The mathematical rigor ensures that divergences are only flagged when there's a clear mathematical relationship between price momentum and the underlying oscillator momentum, eliminating false signals from minor price fluctuations.
Volume Analysis Mathematical Framework
The volume analysis component uses multiple mathematical transformations to assess market participation. The Cumulative Volume Delta (CVD) is calculated as ∑(buying_volume - selling_volume) where buying_volume occurs when close > open and selling_volume when close < open. The relative volume calculation uses current_volume / ta.sma(volume, period) to normalize current activity against historical averages. Volume Rate of Change employs ta.roc(volume, period) = (current_volume - volume ) / volume * 100 to measure volume acceleration. Large trade detection uses a threshold multiplier against the volume moving average, mathematically identifying institutional activity when relative_volume > threshold_multiplier.
Advanced Price Action Mathematics
The Wyckoff analysis component uses mathematical volume climax detection by comparing current volume against ta.highest(volume, 50) * 0.8, while price compression is measured using (high - low) < ta.atr(20) * 0.5. Liquidity sweep detection employs percentage-based calculations: bullish sweeps occur when low < recent_low * (1 - threshold_percentage/100) followed by close > recent_low. Supply and demand zones are mathematically validated by tracking subsequent price action over a defined period, with zone strength calculated as the count of bars where price respects the zone boundaries. Fair value gaps are identified using ATR-based thresholds: gap_size > ta.atr(14) * 0.5.
Sentiment and Market Regime Mathematics
The sentiment analysis employs a multi-factor mathematical model. The fear/greed index uses volatility normalization: 100 - min(100, stdev(price_changes, period) * scaling_factor). Market regime classification uses EMA crossover mathematics with additional ADX-based trend strength validation. The trend strength calculation implements a modified ADX algorithm: DX = |+DI - -DI| / (+DI + -DI) * 100, then ADX = RMA(DX, period). Bull regime requires short_EMA > long_EMA AND ADX > 25 AND +DI > -DI. The mathematical framework ensures objective regime classification without subjective interpretation.
Confluence Scoring Mathematical Model
The confluence scoring system uses a weighted linear combination: Score = (divergence_component * 0.25) + (volume_component * 0.25) + (price_action_component * 0.25) + (sentiment_component * 0.25) + contextual_bonuses. Each component is normalized to a 0-100 scale using percentile rankings and threshold comparisons. The mathematical model ensures that no single component can dominate the score, while contextual bonuses (regime alignment, volume confirmation, etc.) provide additional mathematical weight when multiple factors align. The final score is bounded using math.min(100, math.max(0, calculated_score)) to maintain mathematical consistency.
Vitality Field Mathematical Implementation
The vitality field uses a multi-factor scoring algorithm that combines trend direction (EMA crossover: trend_score = fast_EMA > slow_EMA ? 1 : -1), momentum (RSI-based: momentum_score = RSI > 50 ? 1 : -1), MACD position (macd_score = MACD_line > 0 ? 1 : -1), and volume confirmation. The final vitality score uses weighted mathematics: vitality_score = (trend * 0.4) + (momentum * 0.3) + (macd * 0.2) + (volume * 0.1). The field boundaries are calculated using ATR-based dynamic ranges: upper_boundary = price_center + (ATR * user_defined_multiplier), with EMA smoothing applied to prevent erratic boundary movements. The gradient effect uses mathematical transparency interpolation across multiple zones.
Signal Generation Mathematical Logic
The signal generation employs boolean algebra with multiple mathematical conditions that must simultaneously evaluate to true. Buy signals require: (confluence_score ≥ threshold) AND (divergence_detected = true) AND (relative_volume > 1.5) AND (volume_ROC > 25%) AND (RSI < 35) AND (trend_strength > minimum_ADX) AND (regime = bullish) AND (cooldown_expired = true) AND (last_signal ≠ buy). The mathematical precision ensures that signals only generate when all quantitative conditions are met, eliminating subjective interpretation. The cooldown mechanism uses bar counting mathematics: bars_since_last_signal = current_bar_index - last_signal_bar_index ≥ cooldown_period. This mathematical framework provides objective, repeatable signal generation that can be backtested and validated statistically.
This mathematical foundation ensures the indicator operates on objective, quantifiable principles rather than subjective interpretation, making it suitable for algorithmic trading and systematic analysis while maintaining transparency in its computational methodology.
* for now, we're planning to keep the source code private as we try to improve the models used here and allow a small group to test them. My goal is to eventually use the multiple models in this indicator as their own free and open source indicators. If you'd like to use this indicator, please send me a message to get access.
Advanced Confluence Scoring System
Each support and resistance level receives a comprehensive confluence score (0-100) based on four weighted components:
Momentum Divergences (25% weight)
RSI and MACD divergence detection
Identifies momentum shifts before price reversals
Bullish/bearish divergence confirmation
Volume Analysis (25% weight)
Cumulative Volume Delta (CVD) analysis
Volume Rate of Change monitoring
Large trade detection (institutional activity)
Volume profile strength assessment
Advanced Price Action (25% weight)
Supply and demand zone identification
Liquidity sweep detection (stop hunts)
Wyckoff accumulation/distribution patterns
Fair value gap analysis
Market Sentiment (25% weight)
Fear/Greed index calculation
Market regime classification (Bull/Bear/Sideways)
Trend strength measurement (ADX-like)
Momentum regime alignment
Dynamic Support and Resistance Detection
The indicator uses an adaptive algorithm to identify significant support and resistance levels based on recent market highs and lows. Unlike static levels, these zones adjust dynamically to market volatility using the Average True Range (ATR), ensuring the levels remain relevant across different market conditions.
Vitality Field Background
The indicator features a unique vitality field that provides instant visual feedback about market sentiment:
Green zones: Bullish market conditions with strong momentum
Red zones: Bearish market conditions with weak momentum
Gray zones: Neutral/sideways market conditions
The vitality field uses a sophisticated gradient system that fades from the center outward, creating a clean, professional appearance that doesn't overwhelm the chart while providing valuable context.
Buy Signals (🚀 BUY)
Buy signals are generated when ALL of the following conditions are met:
Valid support level with confluence score ≥ 80
Bullish momentum divergence detected (RSI or MACD)
Volume confirmation (1.5x average volume + 25% volume ROC)
Bull market regime environment
RSI below 35 (oversold conditions)
Price action confirmation (Wyckoff accumulation, liquidity sweep, or large buying volume)
Minimum trend strength (ADX > 25)
Signal alternation check (prevents consecutive buy signals)
Cooldown period expired (default 10 bars)
Sell Signals (🔻 SELL)
Sell signals are generated when ALL of the following conditions are met:
Valid resistance level with confluence score ≥ 80
Bearish momentum divergence detected (RSI or MACD)
Volume confirmation (1.5x average volume + 25% volume ROC)
Bear market regime environment
RSI above 65 (overbought conditions)
Price action confirmation (Wyckoff distribution, liquidity sweep, or large selling volume)
Minimum trend strength (ADX > 25)
Signal alternation check (prevents consecutive sell signals)
Cooldown period expired (default 10 bars)
How to Use the Indicator
1. Signal Quality Assessment
Monitor the confluence scores in the information table:
Score 90-100: Exceptional quality levels (A+ grade)
Score 80-89: High quality levels (A grade)
Score 70-79: Good quality levels (B grade)
Score below 70: Weak levels (filtered out by default)
2. Market Context Analysis
Use the vitality field and market regime information to understand the broader market context:
Trade buy signals in green vitality zones during bull regimes
Trade sell signals in red vitality zones during bear regimes
Exercise caution in gray zones (sideways markets)
3. Entry and Exit Strategy
For Buy Signals:
Enter long positions when premium buy signals appear
Place stop loss below the support confluence zone
Target the next resistance level or use a risk/reward ratio of 2:1 or higher
For Sell Signals:
Enter short positions when premium sell signals appear
Place stop loss above the resistance confluence zone
Target the next support level or use a risk/reward ratio of 2:1 or higher
4. Risk Management
Only trade signals with confluence scores above 80
Respect the signal alternation system (no overtrading)
Use appropriate position sizing based on signal quality
Consider the overall market regime before taking trades
Customizable Settings
Signal Generation Controls
Signal Filtering: Enable/disable advanced filtering
Confluence Threshold: Adjust minimum score requirement (70-95)
Cooldown Period: Set bars between signals (5-50)
Volume/Momentum Requirements: Toggle confirmation requirements
Trend Strength: Minimum ADX requirement (15-40)
Vitality Field Options
Enable/Disable: Control background field display
Transparency Settings: Adjust opacity for center and edges
Field Size: Control the field boundaries (3.0-20.0)
Color Customization: Set custom colors for bullish/bearish/neutral states
Weight Adjustments
Divergence Weight: Adjust momentum component influence (10-40%)
Volume Weight: Adjust volume component influence (10-40%)
Price Action Weight: Adjust price action component influence (10-40%)
Sentiment Weight: Adjust sentiment component influence (10-40%)
Best Practices
Always wait for complete signal confirmation before entering trades
Use higher timeframes for signal validation and context
Combine with proper risk management and position sizing
Monitor the information table for real-time market analysis
Pay attention to volume confirmation for higher probability trades
Respect market regime alignment for optimal results
Basic Settings
Base Length (Default: 25)
Controls the lookback period for identifying support and resistance levels
Range: 5-100 bars
Lower values = More responsive, shorter-term levels
Higher values = More stable, longer-term levels
Recommendation: 25 for intraday, 50 for swing trading
Enable Adaptive Length (Default: True)
Automatically adjusts the base length based on market volatility
When enabled, length increases in volatile markets and decreases in calm markets
Helps maintain relevant levels across different market conditions
Volatility Factor (Default: 1.5)
Controls how much the adaptive length responds to volatility changes
Range: 0.5-3.0
Higher values = More aggressive length adjustments
Lower values = More conservative length adjustments
Volume Profile Settings
VWAP Length (Default: 200)
Sets the calculation period for the Volume Weighted Average Price
Range: 50-500 bars
Shorter periods = More responsive to recent price action
Longer periods = More stable reference line
Used for volume profile analysis and confluence scoring
Volume MA Length (Default: 50)
Period for calculating the volume moving average baseline
Range: 10-200 bars
Used to determine relative volume (current volume vs. average)
Shorter periods = More sensitive to volume changes
Longer periods = More stable volume baseline
High Volume Node Threshold (Default: 1.5)
Multiplier for identifying significant volume spikes
Range: 1.0-3.0
Values above this threshold mark high-volume nodes with diamond shapes
Lower values = More frequent high-volume signals
Higher values = Only extreme volume events marked
Momentum Divergence Settings
Enable Divergence Detection (Default: True)
Master switch for momentum divergence analysis
When disabled, removes divergence from confluence scoring
Significantly impacts signal generation quality
RSI Length (Default: 14)
Period for RSI calculation used in divergence detection
Range: 5-50
Standard RSI settings apply (14 is most common)
Shorter periods = More sensitive, more signals
Longer periods = Smoother, fewer but more reliable signals
MACD Settings
Fast (Default: 12): Fast EMA period for MACD calculation (5-50)
Slow (Default: 26): Slow EMA period for MACD calculation (10-100)
Signal (Default: 9): Signal line EMA period (3-20)
Standard MACD settings for divergence detection
Divergence Lookback (Default: 5)
Number of bars to look back when detecting divergences
Range: 3-20
Shorter periods = More frequent divergence signals
Longer periods = More significant divergence signals
Volume Analysis Enhancement Settings
Enable Advanced Volume Analysis (Default: True)
Master control for sophisticated volume calculations
Includes CVD, volume ROC, and large trade detection
Critical for signal accuracy
Cumulative Volume Delta Length (Default: 20)
Period for CVD smoothing calculation
Range: 10-100
Tracks buying vs. selling pressure over time
Shorter periods = More reactive to recent flows
Longer periods = Broader trend perspective
Volume ROC Length (Default: 10)
Period for Volume Rate of Change calculation
Range: 5-50
Measures volume acceleration/deceleration
Key component in volume confirmation requirements
Large Trade Volume Threshold (Default: 2.0)
Multiplier for identifying institutional-size trades
Range: 1.5-5.0
Trades above this threshold marked as large trades
Lower values = More frequent large trade signals
Higher values = Only extreme institutional activity
Advanced Price Action Settings
Enable Wyckoff Analysis (Default: True)
Activates simplified Wyckoff accumulation/distribution detection
Identifies potential smart money positioning
Important for high-quality signal generation
Enable Supply/Demand Zones (Default: True)
Identifies fresh supply and demand zones
Tracks zone strength based on subsequent price action
Enhances confluence scoring accuracy
Enable Liquidity Analysis (Default: True)
Detects liquidity sweeps and stop hunts
Identifies fake breakouts vs. genuine moves
Critical for avoiding false signals
Zone Strength Period (Default: 20)
Bars used to assess supply/demand zone strength
Range: 10-50
Longer periods = More thorough zone validation
Shorter periods = Faster zone assessment
Liquidity Sweep Threshold (Default: 0.5%)
Percentage move required to confirm liquidity sweep
Range: 0.1-2.0%
Lower values = More sensitive sweep detection
Higher values = Only significant sweeps detected
Sentiment and Flow Settings
Enable Sentiment Analysis (Default: True)
Master control for market sentiment calculations
Includes fear/greed index and regime classification
Important for market context assessment
Fear/Greed Period (Default: 20)
Calculation period for market sentiment indicator
Range: 10-50
Based on price volatility and momentum
Shorter periods = More reactive sentiment readings
Momentum Regime Length (Default: 50)
Period for determining overall market regime
Range: 20-100
Classifies market as Bull/Bear/Sideways
Longer periods = More stable regime classification
Trend Strength Length (Default: 30)
Period for ADX-like trend strength calculation
Range: 10-100
Measures directional momentum intensity
Used in signal filtering requirements
Advanced Signal Generation Settings
Enable Signal Filtering (Default: True)
Master control for premium signal generation system
When disabled, uses basic signal conditions
Highly recommended to keep enabled
Minimum Signal Confluence Score (Default: 80)
Required confluence score for signal generation
Range: 70-95
Higher values = Fewer but higher quality signals
Lower values = More frequent but potentially lower quality signals
Signal Cooldown (Default: 10 bars)
Minimum bars between signals of same type
Range: 5-50
Prevents signal spam and overtrading
Higher values = More conservative signal spacing
Require Volume Confirmation (Default: True)
Mandates volume requirements for signal generation
Requires 1.5x average volume + 25% volume ROC
Critical for signal quality
Require Momentum Confirmation (Default: True)
Mandates divergence detection for signals
Ensures momentum backing for directional moves
Essential for high-probability setups
Minimum Trend Strength (Default: 25)
Required ADX level for signal generation
Range: 15-40
Ensures signals occur in trending markets
Higher values = Only strong trending conditions
Confluence Scoring Settings
Minimum Confluence Score (Default: 70)
Threshold for displaying support/resistance levels
Range: 50-90
Levels below this score are filtered out
Higher values = Only strongest levels shown
Component Weights (Default: 25% each)
Divergence Weight: Momentum component influence (10-40%)
Volume Weight: Volume analysis influence (10-40%)
Price Action Weight: Price patterns influence (10-40%)
Sentiment Weight: Market sentiment influence (10-40%)
Must total 100% for balanced scoring
Vitality Field Settings
Enable Vitality Field (Default: True)
Controls the background gradient field display
Provides instant visual market sentiment feedback
Enhances chart readability and context
Vitality Center Transparency (Default: 85%)
Opacity at the center of the vitality field
Range: 70-95%
Lower values = More opaque center
Higher values = More transparent center
Vitality Edge Transparency (Default: 98%)
Opacity at the edges of the vitality field
Range: 95-99%
Creates smooth fade effect from center to edges
Higher values = More subtle edge appearance
Vitality Field Size (Default: 8.0)
Controls the overall size of the vitality field
Range: 3.0-20.0
Based on ATR multiples for dynamic sizing
Lower values = Tighter field around price
Higher values = Broader field coverage
Recommended Settings by Trading Style
Scalping (1-5 minutes)
Base Length: 15
Volume MA Length: 20
Signal Cooldown: 5 bars
Vitality Field Size: 5.0
Higher sensitivity for quick moves
Day Trading (15-60 minutes)
Base Length: 25 (default)
Volume MA Length: 50 (default)
Signal Cooldown: 10 bars (default)
Vitality Field Size: 8.0 (default)
Balanced settings for intraday moves
Swing Trading (4H-Daily)
Base Length: 50
Volume MA Length: 100
Signal Cooldown: 20 bars
Vitality Field Size: 12.0
Longer-term perspective for multi-day moves
Conservative Trading
Minimum Signal Confluence: 85
Minimum Confluence Score: 80
Require all confirmations: True
Higher thresholds for maximum quality
Aggressive Trading
Minimum Signal Confluence: 75
Minimum Confluence Score: 65
Signal Cooldown: 5 bars
Lower thresholds for more opportunities

Price Volume Trend [sgbpulse]1. Introduction: What is Price Volume Trend (PVT)?
The Price Volume Trend (PVT) indicator is a powerful technical analysis tool designed to measure buying and selling pressure in the market based on price changes relative to trading volume. Unlike other indicators that focus solely on volume or price, PVT combines both components to provide a more comprehensive picture of trend strength.
How is it Calculated?
The PVT is calculated by adding or subtracting a proportional part of the daily volume from a cumulative total.
When the closing price rises, a proportional part of the daily volume (based on the percentage price change) is added to the previous PVT value.
When the closing price falls, a proportional part of the daily volume is subtracted from the previous PVT value.
If there is no change in price, the PVT value remains unchanged.
The result of this calculation is a cumulative line that rises when buying pressure is strong and falls when selling pressure dominates.
2. Why PVT? Comparison to Similar Indicators
While other indicators measure volume-price pressure, PVT offers a unique advantage:
PVT vs. On-Balance Volume (OBV):
OBV simply adds or subtracts the entire day's volume based on the closing direction (up/down), regardless of the magnitude of the price change. This means a 0.1% price change is treated the same as a 10% change.
PVT, on the other hand, gives proportional weight to volume based on the percentage price change. A trading day with a large price increase and high volume will impact the PVT significantly more than a small price increase with the same volume. This makes PVT more sensitive to trend strength and changes within it.
PVT vs. Accumulation/Distribution Line (A/D Line):
The A/D Line focuses on the relationship between the closing price and the bar's trading range (Close Location Value) and multiplies it by volume. It indicates whether the pressure is buying or selling within a single bar.
PVT focuses on the change between closing prices of consecutive bars, multiplying this by volume. It better reflects the flow of money into or out of an asset over time.
By combining volume with percentage price change, PVT provides deeper insights into trend confirmation, identifying divergences between price and volume, and spotting signs of weakness or strength in the current trend.
3. Indicator Settings (Inputs)
The "Price Volume Trend " indicator offers great flexibility for customization to your specific needs through the following settings:
Moving Average Type: Allows you to select the type of moving average used for the central line on the PVT. Your choice here will affect the line's responsiveness to PVT movements.
- "None" : No moving average will be displayed on the PVT.
- "SMA" (Simple Moving Average): A simple average, smoother, ideal for identifying longer-term trends in PVT.
- "SMA + Bollinger Bands": This unique option not only displays a Simple Moving Average but also activates the Bollinger Bands around the PVT. This is the recommended option for analyzing volatility and ranges using Bollinger Bands.
- "EMA" (Exponential Moving Average): An exponential average, giving more weight to recent data, responding faster to changes in PVT.
- "SMMA (RMA)" (Smoothed Moving Average): A smoothed average, providing extra smoothing, less sensitive to noise.
- "WMA" (Weighted Moving Average): A weighted average, giving progressively more weight to recent data, responding very quickly to changes in PVT.
Moving Average Length: Defines the number of bars used to calculate the moving average (and, if applicable, the standard deviation for the Bollinger Bands). A lower value will make the line more responsive, while a higher value will smooth it out.
PVT BB StdDev (Bollinger Bands Standard Deviation): Determines the width of the Bollinger Bands. A higher value will result in wider bands, making it less likely for the PVT to cross them. The standard value is 2.0.
4. Visual Aid: Current PVT Level Line
This indicator includes a unique and highly useful visual feature: a dynamic horizontal line displayed on the PVT graph.
Purpose: This line marks the exact level of the PVT on the most recent trading bar. It extends across the entire chart, allowing for a quick and intuitive comparison of the current level to past levels.
Why is it Important?
- Identifying Divergences: Often, an asset's price may be lower or higher than past levels, but the PVT level might be different. This auxiliary line makes it easy to spot situations where PVT is at a higher level when the price is lower, or vice-versa, which can signal potential trend changes (e.g., higher PVT than in the past while price is low could indicate strong accumulation).
- Quick Direction Indication: The line's color changes dynamically: it will be green if the PVT value on the last bar has increased (or remained the same) relative to the previous bar (indicating positive buying pressure), and red if the PVT value has decreased relative to the previous bar (indicating selling pressure). This provides an immediate visual cue about the direction of the cumulative momentum.
5. Important Note: Trading Risk
This indicator is intended for educational and informational purposes only and does not constitute investment advice or a recommendation for trading in any form whatsoever.
Trading in financial markets involves significant risk of capital loss. It is important to remember that past performance is not indicative of future results. All trading decisions are your sole responsibility. Never trade with money you cannot afford to lose.

RSI Mansfield +RSI Mansfield+ – Adaptive Relative Strength Indicator with Divergences
Overview
RSI Mansfield+ is an advanced relative strength indicator that compares your instrument’s performance against a configurable benchmark index or asset (e.g., Bitcoin Dominance, S&P 500). It combines Mansfield normalization, adaptive smoothing techniques, and automatic detection of bullish and bearish divergences (regular and hidden), delivering a comprehensive tool for assessing relative strength across any market and timeframe.
Originality and Motivation
Unlike traditional relative strength scripts, this indicator introduces several distinctive improvements:
Mansfield Normalization: Scales the ratio between the asset and the benchmark relative to its moving average, transforming it into a normalized oscillator that fluctuates around zero, making it easier to spot outperformance or underperformance.
Adaptive Smoothing: Automatically selects whether to use EMA or SMA based on the market type (crypto or stocks) and timeframe (intraday, daily, weekly, monthly), avoiding manual configuration and providing more robust results under varying volatility conditions.
Divergence Detection: Identifies four types of divergences in the Mansfield oscillator to help anticipate potential reversal points or trend confirmations.
Multi-Market Support: Offers benchmark selection among major crypto and global stock indices from a single input.
These enhancements make RSI Mansfield+ more practical and powerful than conventional relative strength scripts with static benchmarks or without divergence capabilities.
Core Concepts
Relative Strength (RS): Compares price evolution between your asset and the selected benchmark.
Mansfield Normalization: Measures how much the RS deviates from its historical moving average, expressed as a scaled oscillator.
Divergences: Detects regular and hidden bullish or bearish divergences within the Mansfield oscillator.
Timeframe Adaptation: Dynamically adjusts moving average lengths based on timeframe and market type.
How It Works
Benchmark Selection
Choose among over 10 indices or market domains (BTC Dominance, ETH Dominance, S&P 500, European indices, etc.).
Ratio Calculation
Computes the price-to-benchmark ratio and smooths it with the adaptive moving average.
Normalization and Scaling
Transforms deviations into a Mansfield oscillator centered around zero.
Dynamic Coloring
Green indicates relative outperformance, red signals underperformance.
Divergence Detection
Automatically identifies bullish and bearish (regular and hidden) divergences by comparing oscillator pivots against price pivots.
Baseline Reference
A clear zero line helps interpret relative strength trends.
Usage Guidelines
Benchmark Comparison
Ideal for traders analyzing whether an asset is outperforming or lagging its sector or market.
Divergence Analysis
Helps detect potential reversal or continuation signals in relative strength.
Multi-Timeframe Compatibility
Can be applied to intraday, daily, weekly, or monthly charts.
Interpretation
Oscillator >0 and green: outperforming the benchmark.
Oscillator <0 and red: underperforming.
Bullish divergences: potential relative strength reversal to the upside.
Bearish divergences: possible loss of momentum or reversal to the downside.
Credits
The concept of Mansfield Relative Strength is based on Stan Weinstein’s original work on relative performance analysis. This script was built entirely from scratch in TradingView Pine Script v6, incorporating original logic for adaptive smoothing, normalized scaling, and divergence detection, without reusing any external open-source code.

Kase Convergence Divergence [BackQuant]Kase Convergence Divergence
The Kase Convergence Divergence is a sophisticated oscillator designed to measure directional market strength through the lens of volatility-adjusted log return structures. Inspired by Cynthia Kase’s work on statistical momentum and price projection ranges, this unique indicator offers a hybrid framework that merges signal processing, multi-length sweep logic, and adaptive smoothing techniques.
Unlike traditional momentum oscillators like MACD or RSI, which rely on static moving average differences, KCD introduces a dual-process system combining:
Kase-style statistical range projection (via log returns and volatility),
A sweeping loop of lookback lengths for robustness,
First and second derivative modes to capture both velocity and acceleration of price movement.
Core Logic & Computation
The KCD calculation is centered on two volatility-normalized transforms:
KSDI Up: Measures how far the current high has moved relative to a past low, normalized by return volatility.
KSDI Down: Measures how far the current low has moved relative to a past high, also normalized.
For every length in a user-defined sweep range (e.g., 25–35), both KSDI_up and KSDI_dn are computed, and their maximum values across the loop are retained. The difference between these two max values produces the raw signal:
KPO (Kase Projection Oscillator): Measures directional skew.
KCD (Kase Convergence Divergence): Defined as KPO – MA(KPO) — similar in spirit to MACD but structurally different.
Users can choose to visualize either the first derivative (KPO) , or the second derivative (KCD) , depending on market conditions or strategy style.
Key Features
✅ Multi-Length Sweep Logic: Improves signal reliability by aggregating statistical range projections across a set of lookbacks.
✅ Advanced Smoothing Modes: Supports DEMA, HMA, TEMA, LINREG, WMA and more for dynamic adaptation.
✅ Dual Derivative Modes: Choose between speed (first derivative) or smoothness (second derivative) to fit your trading regime.
✅ Color-Encoded Signal Bands: Heatmap-style oscillator coloring enhances visual feedback on trend strength.
✅ Candlestick Painting: Optional bar coloring makes it easy to spot trend shifts on the main chart.
✅ Adaptive Fill Zones: Green and red fills between the oscillator and zero line help distinguish bullish and bearish regimes at a glance.
Practical Applications
📈 Trend Confirmation: Use KCD as a secondary confirmation layer after breakout or pullback entries.
📉 Momentum Shifts: Crossover and crossunder of the zero line highlight potential regime changes.
📊 Strategy Filters: Incorporate into algos to avoid trendless or mean-reverting environments.
🧪 Derivative Switching: Flip between KPO and KCD modes depending on whether you want to measure acceleration or deceleration of price flow.
Alerts & Signals
Two built-in alerts help you catch regime shifts in real time:
Long Signal: Triggered when the selected oscillator crosses above zero.
Short Signal: Triggered when it crosses below zero.
These events can be used to generate entries, exits, or trend validation cues in multi-layer systems.
Conclusion
The Kase Convergence Divergence goes beyond traditional oscillators by offering a volatility-normalized, derivative-aware signal engine with enhanced visual dynamics. Its sweeping architecture and dynamic fill logic make it especially powerful for identifying trending environments, filtering chop, and adding statistical rigor to your trading toolkit.
Whether you’re a discretionary trader seeking precision, or a quant looking to model more robust return structures, KCD offers a creative yet analytically grounded solution.
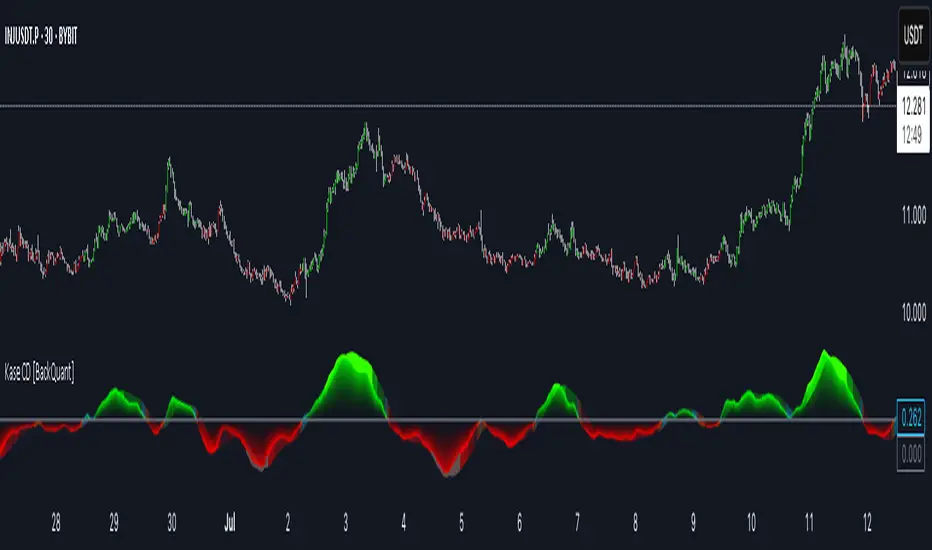
Divergence Strategy [Trendoscope®]🎲 Overview
The Divergence Strategy is a sophisticated TradingView strategy that enhances the Divergence Screener by adding automated trade signal generation, risk management, and trade visualization. It leverages the screener’s robust divergence detection to identify bullish, bearish, regular, and hidden divergences, then executes trades with precise entry, stop-loss, and take-profit levels. Designed for traders seeking automated trading solutions, this strategy offers customizable trade parameters and visual feedback to optimize performance across various markets and timeframes.
For core divergence detection features, including oscillator options, trend detection methods, zigzag pivot analysis, and visualization, refer to the Divergence Screener documentation. This description focuses on the strategy-specific enhancements for automated trading and risk management.
🎲 Strategy Features
🎯Automated Trade Signal Generation
Trade Direction Control : Restrict trades to long-only or short-only to align with market bias or strategy goals, preventing conflicting orders.
Divergence Type Selection : Choose to trade regular divergences (bullish/bearish), hidden divergences, or both, targeting reversals or trend continuations.
Entry Type Options :
Cautious : Enters conservatively at pivot points and exits quickly to minimize risk exposure.
Confident : Enters aggressively at the latest price and holds longer to capture larger moves.
Mixed : Combines conservative entries with delayed exits for a balanced approach.
Market vs. Stop Orders: Opt for market orders for instant execution or stop orders for precise price entry.
🎯 Enhanced Risk Management
Risk/Reward Ratio : Define a risk-reward ratio (default: 2.0) to set profit targets relative to stop-loss levels, ensuring consistent trade sizing.
Bracket Orders : Trades include entry, stop-loss, and take-profit levels calculated from divergence pivot points, tailored to the entry type and risk-reward settings.
Stop-Loss Placement : Stops are strategically set (e.g., at recent pivot or last price point) based on entry type, balancing risk and trade validity.
Order Cancellation : Optionally cancel pending orders when a divergence is broken (e.g., price moves past the pivot in the wrong direction), reducing invalid trades. This feature is toggleable for flexibility.
🎯 Trade Visualization
Target and Stop Boxes : Displays take-profit (lime) and stop-loss (orange) levels as boxes on the price chart, extending 10 bars forward for clear visibility.
Dynamic Trade Updates : Trade visualizations are added, updated, or removed as trades are executed, canceled, or invalidated, ensuring accurate feedback.
Overlay Integration : Trade levels overlay the price chart, complementing the screener’s oscillator-based divergence lines and labels.
🎯 Strategy Default Configuration
Capital and Sizing : Set initial capital (default: $1,000,000) and position size (default: 20% of equity) for realistic backtesting.
Pyramiding : Allows up to 4 concurrent trades, enabling multiple divergence-based entries in trending markets.
Commission and Margin : Accounts for commission (default: 0.01%) and margin (100% for long/short) to reflect trading costs.
Performance Optimization : Processes up to 5,000 bars dynamically, balancing historical analysis and real-time execution.
🎲 Inputs and Configuration
🎯Trade Settings
Direction : Select Long or Short (default: Long).
Divergence : Trade Regular, Hidden, or Both divergence types (default: Both).
Entry/Exit Type : Choose Cautious, Confident, or Mixed (default: Cautious).
Risk/Reward : Set the risk-reward ratio for profit targets (default: 2.0).
Use Market Order : Enable market orders for immediate entry (default: false, uses limit orders).
Cancel On Break : Cancel pending orders when divergence is broken (default: true).
🎯Inherited Settings
The strategy inherits all inputs from the Divergence Screener, including:
Oscillator Settings : Oscillator type (e.g., RSI, CCI), length, and external oscillator option.
Trend Settings : Trend detection method (Zigzag, MA Difference, External), MA type, and length.
Zigzag Settings : Zigzag length (fixed repaint = true).
🎲 Entry/Exit Types for Divergence Scenarios
The Divergence Strategy offers three Entry/Exit Type options—Cautious, Confident, and Mixed—which determine how trades are entered and exited based on divergence pivot points. This section explains how these settings apply to different divergence scenarios, with placeholders for screenshots to illustrate each case.
The divergence pattern forms after 3 pivots. The stop and entry levels are formed on one of these levels based on Entry/Exit types.
🎯Bullish Divergence (Reversal)
A bullish divergence occurs when price forms a lower low, but the oscillator forms a higher low, signaling a potential upward reversal.
💎 Cautious:
Entry : At the pivot high point for a conservative entry.
Exit : Stop-loss at the last pivot point (previous low that is higher than the current pivot low); take-profit at risk-reward ratio. Canceled if price breaks below the pivot (if Cancel On Break is enabled).
Behavior : Enters after confirmation and exits quickly to limit downside risk.
💎Confident:
Entry : At the last pivot low, (previous low which is higher than the current pivot low) for an aggressive entry.
Exit : Stop-loss at recent pivot low, which is the lowest point; take-profit at risk-reward ratio. Canceled if price breaks below the pivot. (lazy exit)
Behavior : Enters early to capture trend continuation, holding longer for gains.
💎Mixed:
Entry : At the pivot high point (conservative).
Exit : Stop-loss at the recent pivot point that has resulted in lower low (lazy exit). Canceled if price breaks below the pivot.
Behavior : Balances entry caution with extended holding for trend continuation.
🎯Bearish Divergence (Reversal)
A bearish divergence occurs when price forms a higher high, but the oscillator forms a lower high, indicating a potential downward reversal.
💎Cautious:
Entry : At the pivot low point (lower high) for a conservative short entry.
Exit : Stop-loss at the previous pivot high point (previous high); take-profit at risk-reward ratio. Canceled if price breaks above the pivot (if Cancel On Break is enabled).
Behavior : Enters conservatively and exits quickly to minimize risk.
💎Confident:
Entry : At the last price point (previous high) for an aggressive short entry.
Exit : Stop-loss at the pivot point; take-profit at risk-reward ratio. Canceled if price breaks above the pivot.
Behavior : Enters early to maximize trend continuation, holding longer.
💎Mixed:
Entry : At the previous piot high point (conservative).
Exit : Stop-loss at the last price point (delayed exit). Canceled if price breaks above the pivot.
Behavior : Combines conservative entry with extended holding for downtrend gains.
🎯Bullish Hidden Divergence (Continuation)
A bullish hidden divergence occurs when price forms a higher low, but the oscillator forms a lower low, suggesting uptrend continuation. In case of Hidden bullish divergence, b]Entry is always on the previous pivot high (unless it is a market order)
💎Cautious:
Exit : Stop-loss at the recent pivot low point (higher than previous pivot low); take-profit at risk-reward ratio. Canceled if price breaks below the pivot (if Cancel On Break is enabled).
Behavior : Enters after confirmation and exits quickly to limit downside risk.
💎Confident:
Exit : Stop-loss at previous pivot low, which is the lowest point; take-profit at risk-reward ratio. Canceled if price breaks below the pivot. (lazy exit)
Behavior : Enters early to capture trend continuation, holding longer for gains.
🎯Bearish Hidden Divergence (Continuation)
A bearish hidden divergence occurs when price forms a lower high, but the oscillator forms a higher high, suggesting downtrend continuation. In case of Hidden Bearish divergence, b]Entry is always on the previous pivot low (unless it is a market order)
💎Cautious:
Exit : Stop-loss at the latest pivot high point (which is a lower high); take-profit at risk-reward ratio. Canceled if price breaks above the pivot (if Cancel On Break is enabled).
Behavior : Enters conservatively and exits quickly to minimize risk.
💎Confident/Mixed:
Exit : Stop-loss at the previous pivot high point; take-profit at risk-reward ratio. Canceled if price breaks above the pivot.
Behavior : Uses the late exit point to hold longer.
🎲 Usage Instructions
🎯Add to Chart:
Add the Divergence Strategy to your TradingView chart.
The oscillator and divergence signals appear in a separate pane, with trade levels (target/stop boxes) overlaid on the price chart.
🎯Configure Settings:
Adjust trade settings (direction, divergence type, entry type, risk-reward, market orders, cancel on break).
Modify inherited Divergence Screener settings (oscillator, trend method, zigzag length) as needed.
Enable/disable alerts for divergence notifications.
🎯Interpret Signals:
Long Trades: Triggered on bullish or bullish hidden divergences (if allowed), shown with green/lime lines and labels.
Short Trades: Triggered on bearish or bearish hidden divergences (if allowed), shown with red/orange lines and labels.
Monitor lime (target) and orange (stop) boxes for trade levels.
Review strategy performance metrics (e.g., profit/loss, win rate) in the strategy tester.
🎯Backtest and Optimize:
Use TradingView’s strategy tester to evaluate performance on historical data.
Fine-tune risk-reward, entry type, position sizing, and cancellation settings to suit your market and timeframe.
For questions, suggestions, or support, contact Trendoscope via TradingView or official support channels. Stay tuned for updates and enhancements to the Divergence Strategy!

Divergence Screener [Trendoscope®]🎲Overview
The Divergence Screener is a powerful TradingView indicator designed to detect and visualize bullish and bearish divergences, including hidden divergences, between price action and a user-selected oscillator. Built with flexibility in mind, it allows traders to customize the oscillator type, trend detection method, and other parameters to suit various trading strategies. The indicator is non-overlay, displaying divergence signals directly on the oscillator plot, with visual cues such as lines and labels on the chart for easy identification.
This indicator is ideal for traders seeking to identify potential reversal or continuation signals based on price-oscillator divergences. It supports multiple oscillators, trend detection methods, and alert configurations, making it versatile for different markets and timeframes.
🎲Features
🎯Customizable Oscillator Selection
Built-in Oscillators : Choose from a variety of oscillators including RSI, CCI, CMO, COG, MFI, ROC, Stochastic, and WPR.
External Oscillator Support : Users can input an external oscillator source, allowing integration with custom or third-party indicators.
Configurable Length : Adjust the oscillator’s period (e.g., 14 for RSI) to fine-tune sensitivity.
🎯Divergence Detection
The screener identifies four types of divergences:
Bullish Divergence : Price forms a lower low, but the oscillator forms a higher low, signaling potential upward reversal.
Bearish Divergence : Price forms a higher high, but the oscillator forms a lower high, indicating potential downward reversal.
Bullish Hidden Divergence : Price forms a higher low, but the oscillator forms a lower low, suggesting trend continuation in an uptrend.
Bearish Hidden Divergence : Price forms a lower high, but the oscillator forms a higher high, suggesting trend continuation in a downtrend.
🎯Flexible Trend Detection
The indicator offers three methods to determine the trend context for divergence detection:
Zigzag : Uses zigzag pivots to identify trends based on higher highs (HH), higher lows (HL), lower highs (LH), and lower lows (LL).
MA Difference : Calculates the trend based on the difference in a moving average (e.g., SMA, EMA) between divergence pivots.
External Trend Signal : Allows users to input an external trend signal (positive for uptrend, negative for downtrend) for custom trend analysis.
🎯Zigzag-Based Pivot Analysis
Customizable Zigzag Length : Adjust the zigzag length (default: 13) to control the sensitivity of pivot detection.
Repaint Option : Choose whether divergence lines repaint based on the latest data or wait for confirmed pivots, balancing responsiveness and reliability.
🎯Visual and Alert Features
Divergence Visualization : Divergence lines are drawn between price pivots and oscillator pivots, color-coded for easy identification:
Bullish Divergence : Green
Bearish Divergence : Red
Bullish Hidden Divergence : Lime
Bearish Hidden Divergence : Orange
Labels and Tooltips : Labels (e.g., “D” for divergence, “H” for hidden) appear on price and oscillator pivots, with tooltips providing detailed information such as price/oscillator values, ratios, and pivot directions.
Alerts : Configurable alerts for each divergence type (bullish, bearish, bullish hidden, bearish hidden) trigger on bar close, ensuring timely notifications.
🎲 How It Works
🎯Oscillator Calculation
The indicator calculates the selected oscillator (or uses an external source) and plots it on the chart.
Oscillator values are stored in a map for reference during divergence calculations.
🎯Pivot Detection
A zigzag algorithm identifies pivots in the oscillator data, with configurable length and repainting options.
Price and oscillator pivots are compared to detect divergences based on their direction and ratio.
🎯Divergence Identification
The indicator compares price and oscillator pivot directions (HH, HL, LH, LL) to identify divergences.
Trend context is determined using the selected method (Zigzag, MA Difference, or External).
Divergences are classified as bullish, bearish, bullish hidden, or bearish hidden based on price-oscillator relationships and trend direction.
🎯Visualization and Alerts
Valid divergences are drawn as lines connecting price and oscillator pivots, with corresponding labels.
Alerts are triggered for allowed divergence types, providing detailed information via tooltips.
🎯Validation
Divergence lines are validated to ensure no intermediate bars violate the divergence condition, enhancing signal reliability.
🎲 Usage Instructions as Indicator
🎯Add to Chart:
Add the “Divergence Screener ” to your TradingView chart.
The indicator appears in a separate pane below the price chart, plotting the oscillator and divergence signals.
🎯Configure Settings:
Adjust the oscillator type and length to match your trading style.
Select a trend detection method and configure related parameters (e.g., MA type/length or external signal).
Set the zigzag length and repainting preference.
Enable/disable alerts for specific divergence types.
I🎯nterpret Signals:
Bullish Divergence (Green) : Look for potential buy opportunities in a downtrend.
Bearish Divergence (Red) : Consider sell opportunities in an uptrend.
Bullish Hidden Divergence (Lime) : Confirm continuation in an uptrend.
Bearish Hidden Divergence (Orange): Confirm continuation in a downtrend.
Use tooltips on labels to review detailed pivot and divergence information.
🎯Set Alerts:
Create alerts for each divergence type to receive notifications via TradingView’s alert system.
Alerts include detailed text with price, oscillator, and divergence information.
🎲 Example Scenarios as Indicator
🎯 With External Oscillator (Use MACD Histogram as Oscillator)
In order to use MACD as an oscillator for divergence signal instead of the built in options, follow these steps.
Load MACD Indicator from Indicator library
From Indicator settings of Divergence Screener, set Use External Oscillator and select MACD Histograme from the dropdown
You can now see that the oscillator pane shows the data of selected MACD histogram and divergence signals are generated based on the external MACD histogram data.
🎯 With External Trend Signal (Supertrend Ladder ATR)
Now let's demonstrate how to use external direction signals using Supertrend Ladder ATR indicator. Please note that in order to use the indicator as trend source, the indicator should return positive integer for uptrend and negative integer for downtrend. Steps are as follows:
Load the desired trend indicator. In this example, we are using Supertrend Ladder ATR
From the settings of Divergence Screener, select "External" as Trend Detection Method
Select the trend detection plot Direction from the dropdown. You can now see that the divergence signals will rely on the new trend settings rather than the built in options.
🎲 Using the Script with Pine Screener
The primary purpose of the Divergence Screener is to enable traders to scan multiple instruments (e.g., stocks, ETFs, forex pairs) for divergence signals using TradingView’s Pine Screener, facilitating efficient comparison and identification of trading opportunities.
To use the Divergence Screener as a screener, follow these steps:
Add to Favorites : Add the Divergence Screener to your TradingView favorites to make it available in the Pine Screener.
Create a Watchlist : Build a watchlist containing the instruments (e.g., stocks, ETFs, or forex pairs) you want to scan for divergences.
Access Pine Screener : Navigate to the Pine Screener via TradingView’s main menu: Products -> Screeners -> Pine, or directly visit tradingview.com/pine-screener/.
Select Watchlist : Choose the watchlist you created from the Watchlist dropdown in the Pine Screener interface.
Choose Indicator : Select Divergence Screener from the Choose Indicator dropdown.
Configure Settings : Set the desired timeframe (e.g., 1 hour, 1 day) and adjust indicator settings such as oscillator type, zigzag length, or trend detection method as needed.
Select Filter Criteria : Select the condition on which the watchlist items needs to be filtered. Filtering can only be done on the plots defined in the script.
Run Scan : Press the Scan button to display divergence signals across the selected instruments. The screener will show which instruments exhibit bullish, bearish, bullish hidden, or bearish hidden divergences based on the configured settings.
🎲 Limitations and Possible Future Enhancements
Limitations are
Custom input for oscillator and trend detection cannot be used in pine screener.
Pine screener has max 500 bars available.
Repaint option is by default enabled. When in repaint mode expect the early signal but the signals are prone to repaint.
Possible future enhancements
Add more built-in options for oscillators and trend detection methods so that dependency on external indicators is limited
Multi level zigzag support

RSI Divergence (Nikko)RSI Divergence by Nikko
🧠 RSI Divergence Detector — Nikko Edition This script is an enhanced RSI Divergence detector built with Pine Script v6, modified for better visuals and practical usability. It uses linear regression to detect bullish and bearish divergences between the RSI and price action — one of the most reliable early signals in technical analysis.
✅ Improvements from the Original:
- Clean divergence lines using regression fitting.
- Optional label display to reduce clutter (Display Labels toggle).
- Adjustable line thickness (Display Line Width).
- A subtle heatmap background to highlight RSI overbought/oversold zones.
- Uses max accuracy with high calc_bars_count and custom extrapolation window.
🔍 How It Works: The script applies linear regression (least squares method) on both RSI data, and Price (close) data.
It then compares the direction of RSI vs. direction of Price over a set length. If price is making higher highs while RSI makes lower highs, it's a bearish divergence. If price is making lower lows while RSI makes higher lows, it's a bullish divergence. Additional filters (e.g., momentum and slope thresholds) are used to validate only strong divergences.
🔧 Input Parameters: RSI Length: The RSI period (default: 14). RSI Divergence Length: The lookback period for regression (default: 25). Source: Which price data to calculate RSI from (default: close). Display Labels: Show/hide “Bullish” or “Bearish” labels on the chart. Display Line Width: Adjusts how thick the plotted divergence lines appear.
📣 Alerts: Alerts are built-in for both RSI Buy (bullish divergence) and RSI Sell (bearish divergence) so you can use it in automation or notifications.
🚀 Personal Note: I’ve been using this script daily in my own trading, which is why I took time to improve both the logic and visual clarity. If you want a divergence tool that doesn't clutter your chart but gives strong signals, this might be what you're looking for.
