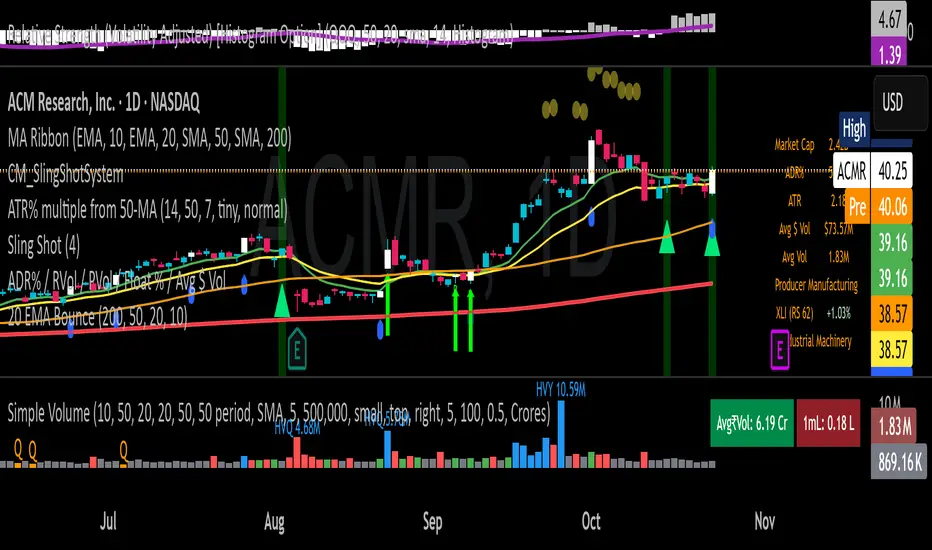
POWER OF STOCK'S 5 EMA BUY / SELL Indicator is based mainly on two conditions :
1. Previous candle should not touch 5 EMA.
2. Current candle should close “ABOVE/BELOW” 5 EMA.
Features -
* Buy candle is represented by Aqua Color
* Sell candle is represented by Fuchsia Color
* You can set Risk: Reward ratio. ( Default = 1:2)
* It also shows label for Entry, Stop Loss & Target.
* Suggested timeframe 15 Minutes for intraday.
* Use closing basis Stop loss.
Exponential Moving Average (EMA)
Power Of Stocks - Bollinger Band & 5Ema Indicator - Keanu_RiTz
Power of Stocks - Bollinger band & 5ema Strategy
In this script you get to take Buy/Sell trades using the 3 options mentioned below.(Alerts with price levels for buy/sell at , SL & Target are included in this one)
1. Combined Strategy :- uses confirmation from both strategies to trade.
2. Bollinger band Strategy :- use the Bollinger band Strategy to trade.
3. 5ema Strategy :- use the 5ema Strategy to trade.
1. Combined Strategy :-
for Selling :- we will go short/sell only when conditions of both strategies are satisfied.
i.e. when a candle is completely above the upper Bollinger band & completely above the 5ema then it will be our Alert Candle.
We Short/Sell only when the low of the Alert candle is broken or when the candle closes below the close of the Alert Candle.
SL will be above high of the Alert Candle. Target will be minimum 1:3 or as per your emotions.
for Buying:- we will go Long/Buy only when conditions of both strategies are satisfied.
i.e. when a candle is completely below the lower Bollinger band & completely below the 5ema then it will be our Alert Candle.
We go Long/Buy only when the high of the Alert candle is broken or when the candle closes above the close of the Alert Candle.
SL will be below low of the Alert Candle. Target will be minimum 1:3 or as per your emotions.
2. Power of Stocks - Bollinger Band Strategy :-
Bollinger band with standard deviation = 1.5
when a candle is completely above the upper Bollinger band, that candle will be called a signal/alert candle.
Initiate a Sell trade when that alert candles low is broken. SL will be above high of that alert candle.
Risk to reward ratio will be 1:4 i.e. target will be 4 times the SL.
when a candle is completely below the lower Bollinger band, that candle will be called a signal/alert candle.
Initiate a Buy trade when that alert candles high is broken. SL will be below low of that alert candle.
Risk to reward ratio will be 1:4 i.e. target will be 4 times the SL.
other rules for Options buying:- minimum 15min timeframe
The day you initiate the position , you should be in profit above 10%-15% then only you should carry forward that position overnight, otherwise squareoff your trade on that day only.
Buy ATM or slightly OTM, SL max 100 points , target 1:4
for Long-term/Investing :- Minimum Weekly
If candle is outside the lower band then initiate a Buy trade when that candles High is broken. Sl will be below Low of that candle.
for Long-term Target will be according to your emotions.
3. Power of Stocks - 5ema Strategy (target minimum 1:3)
Timeframe -
5 min for Selling (Sell Futures/index/stocks or buy Put)
15 min for Buying (Buy Futures/index/stocks or sell Put)
for selling stocks :-
you should enter trade within 10am , don't look for entries after that time. take only 2 entries a day.
for selling Index(Banknifty) :-
you can take trade at anytime of the day whenever conditions get satisfied. you can take multiple entries in banknifty as it is very volatile.
for options choose atm strikes: selling trade
sl for premium between 200-300 :- 20-30 points SL
sl for premium between 400-500 :- 40-50 points SL
sl for premium between 500-600 :- 50-60 points SL
Subhashish Pani's (power of stocks) 5 EMA Strategy:-
It plots 5 EMA and Buy/Sell signals with Target & Stoploss levels.
What is Subhashish Pani's (power of stocks) 5 EMA Strategy :-
His strategy is very simple to understand. for intraday use 5 minutes timeframe for selling. You can sell futures, sell call or buy Puts in selling strategy.
What this strategy tries to do is , it tries to catch the tops, so when you sell at top & it turns out to be a reversal point then you can get good profit.
this will hit stop losses often, but stop losses are small and minimum target should be 1:3. but if you stay with the trend you can get big profits.
According to Subhashish Pani this strategy has 60% success rate.
Strategy for Selling (Short future/Call/stock or buy Put)
When ever a Candle closes completely above 5 ema (no part of candle should be touching the 5ema), then that candle should be considered as Alert Candle.
If the next candle is also completely above 5 ema and it has not broken the low of previous alert candle, Then the previous Alert Candle should be ignored and the new candle should be considered as new Alert Candle.
so if this goes on then continue shifting the Alert Candle, but whenever the next candle breaks the low of the Alert Candle we should take the Short trade (Short future/Call/stock or buy Put).
Stoploss will be above high of the Alert Candle and minimum target will be 1:3.
Strategy for Buying (Buy future/Call/stock or sell Put)
When ever a Candle closes completely below 5 ema (no part of candle should be touching the 5ema), then that candle should be considered as Alert Candle.
If the next candle is also completely below 5 ema and it has not broken the high of previous alert candle, Then the previous Alert Candle should be ignored and the new candle should be considered as new Alert Candle.
so if this goes on then continue shifting the Alert Candle, but whenever the next candle breaks the high of the Alert Candle we should take the Long trade (Buy future/Call/stock or sell Put).
Stoploss will be below low of the Alert Candle and minimum target will be 1:3.
Buy/Sell with extra conditions :
it just adds 1 more condition to buying/selling
1. checks if closing of current candle is lower than alert candles closing for Selling & checks if closing of current candle is higher than alert candles closing for Buyling.
This can sometimes save you from false moves but by using this, you can also miss out on big moves as you'll enter trade after candle closing instead of entering at break of high/low.
Note :- According to Subhashish Pani Timeframe for intraday buying should be 15 minutes Timeframe.
If you haven't understood the strategy by reading above description, then search for "Subhashish Pani's (power of stocks) 5 EMA Strategy" on YouTube to get a deeper understanding.
Note:- This is not only for Intraday trading , you can use this strategy for Positional/Swing trading as well. If you use this on Monthly Timeframe then it can be very good for Long Term Investing as well.
Rules will be same for all types of trades & Timeframes.
Modified Color Relative Strength IndexThis indicator is old normal RSI, but I have Modified its Color, to make trade able to investigate the trend easier
This indicator uses the concept of:
- RSI Relative Strength Index
- and Many Different MA (For example EMA SMA RMA LSMA WMA etc.)
There are 2 line displays in this indicator
1) Normal RSI line, Default is set as White color
2) MA line which calculates from RSI, a trader can choose the model to calculate RSIMA in setting
How Modified Color Relative Strength Index work?
We use RSI as we normally use, but the RSIMA is a little different in this Indicator
I use the idea that if RSI is over RSIMA, the Trend seems to be Uptrend which will display as a Green color filled. Same as if RSI is lower than RSI MA that trend seems to be a Down Trend.
With this idea, we can identify the trend of the chart but we still don't know whether the trend is strong or not, to satisfy this problem the change rate of RSIMA came into its role.
Now let me reviewing you some of my 5-grade math ideas:
Remember how to calculate the Average value? that's right we sum all of the values and divide it all by the amount of the number
for example, we want to calculate the average value of 1 2 3 4 5 so it should be (1+2+3+4+5)/5 which is the amount of number and then we get the average value of 1 2 3 4 5 = 3
now apply that concept to the change in RSIMA value
There will be 3 stages of the color displayed in RSIMA
1) Green will be displayed if the rate of change or RSIMA is over X time average rate of change of this RSIMA while trader and change X in the setting (Positive value)
2) Red will be displayed if the rate of change or RSIMA is over X time average rate of change of this RSIMA while trader and change X in the setting (Negative value)
3) Light Blue and Orange (Gray) will be displayed if the rate of change or RSIMA is not over X time average rate of change of this RSIMA while trader and change X in the setting if the recently is red the RSIMA line will be orange while it is green, RSIMA will be color in Light Blue
Green and Red can be a help to confirm, how strong the trend is. While Light blue and Orange mean there is a small amount of change so traders should be prepared to Buy/Sell
Use of Modified Color Relative Strength Index
When the area between RSI and RSIMA is Green and RSIMA is colored in Green, That is a Strong Uptrend
Same a Strong Down Trend, area between RSI and RSIMA need to be RED and RSIMA colored in red too,
other than this is considered as a sideway Trend or weak Trend
Apply RSI with other Indicator
- You can use any indicator that can help you enter the trade easier with it
- I personally use it with MACD, BB Band, and UT Bot Alerts
Tunable SWMADissected the standard SWMA function and added options for user to change just about every part of it. Weights ,Lookback ,Source can all be changed in the settings.
Green is the standard SWMA, Using the Input value selected.(MAs/LRC/VWAP)
Red is the tuned SWMA, with the option of applying a final Output filter (MAs/LRC/VWAP). Uses 8 datapoints instead of 4 for the default.
Customization can really help expand upon the standard SWMA I find. Enjoy tuning to your hearts content
Original Strategy - Backtest & Alerts [AlgoRider]█ OVERVIEW
This indicator simulates an efficient trading strategy developed by our team in a simple and effective way, the primary objective when designing it was to make its reading and use as simple as possible for TradingView users. The Backtesting feature has been designed to keep only the most essential information to obtain clear and precise results directly on the graph. The settings interface has also been designed for ergonomic and simplified use. The user is free to customize the parameters as he wishes and according to his trading profile by having the choice, for example, of using options to reduce the risk of loss, to increase the win rate, to optimize profits. Automation is made possible and facilitated thanks to preconfigured alert conditions.
█ CONCEPTS
How the strategy works :
When the price is close to its equilibrium (represented by an exponential moving average - EMA) and it starts to take an upward or downward direction the script will issue Long or Short entry orders. If the price turns and goes to the opposite direction, the script quickly cuts the position by issuing a Stop Loss order. When the price takes a real clear direction, this is where the script will be able to accumulate profits.
What makes this script unique is :
• That it is entirely developed by us, inspired by a strategy that is little known and little used in the trading world, in particular because it often involves a greater number of losing trades than winning trades.
• Its ease of reading and use. The backtesting feature was designed to clearly display the most important information in a data table directly on the chart. The user is not lost with dozens of superfluous data and can directly access the most essential information to see how the strategy has performed in the past.
• Its ease of configuration and customization. Once in the configuration window, again the user is not lost, because there is only one main parameter to modify, it is the length of the EMA, which will influence the timing of entries and exits trades. Then there are a few other non-mandatory parameters to fine-tune risk management and maximize profits. (Detailed description of the settings further down the page)
• Strategy automation made easy and fast thanks to several types of alerts which are differentiated for entries, for auto-exits and for Custom TP and SL. These alerts can be configured to send the messages by email or via Webhooks.
• The indicator has several custom options allowing its user to go further than the basic strategy. Several confirmations for entries are available as well as the possibility of adding or not a personalized TP and/or SL.
• There is no repaint, once an entry/exit symbol or drawing is displayed it doesn't change anymore. The Short, Long and auto-Exit signals appear only at the open of the candles, just after the signal was confirmed at the close of the previous candle. The custom TP and custom SL signals can appear when a candle is not yet finished, but once displayed they don't change.
█ HOW TO PROCEED
1 — Once the script is applied to your chart, it already works with its default settings. You can already see the performance of the strategy in the data table directly on the chart (in the top right corner by default).
2 — You can customize the strategy and influence the results/performance by modifying its parameters. 3 types of parameters are present and can be modified.
3 — This strategy is designed for the cryptocurrency market in priority, but you can also try it on other types of assets. It works on Futures but you can also try it on Spot market mainly for LONG trades.
4 — You can apply the script in every timeframe. We do not recommend using it below m30 because in most cases the statistics are unfavorable largely because of the fees. (This is not a financial advice but only for the use of the indicator)
█ FEATURES
Screenshot on BYBIT:EGLDUSDT Bybit Futures, H1, with default parameters, from 2022-01-01 to 2022-09-27, to show the settings window
• Settings For Backtesting
- Strategy : Choose from a drop-down list if the strategy should execute only Long trades or only Short trades or both. Default Both.
- Invest. : Choose the amount you want to invest in the simulation. Default 10000.
- Position : Choose the amount of the position (Size order) that will be used during the simulation. This will be the $ amount staked/involved for each trade entry.
Ex: If you put 20000 in position and 10000 in Invest. We consider that you use at least a leverage x2. Default 10000.
- Slipp. TP : Choose the amount in percentage of average slippage for Take Profits. This parameter makes it possible to predict a potential gap between the theoretical exit price for each TP (On the graph) and the real exit price on an exchange when implementing the strategy for real (slippage may be due to a time lag of a few seconds from execution time of the order on the exchange and/or due to the execution of a market order).
Ex: If a TP exit order of a Long trade, with entry $19000 (on BTCUSDT), is carried out in theory on the chart at $20000, in practice on the exchange the script have indeed sent an exit order at 20000 , but if the true exit price is 20050, the TP slippage is then +0.25%. Default 0.
- Slipp. SL : Choose the amount in percentage of average slippage for Stop Losses. This parameter makes it possible to predict a potential gap between the theoretical exit price for each SL (On the graph) and the real exit price on an exchange when implementing the strategy for real.
Ex: If an SL exit order of a Long trade, entry $19000 (on BTCUSDT), is carried out in theory on the chart at $18000, in practice on the exchange the script have indeed sent an exit order at 18000 $, but if the true exit price is 17950, the slippage SL is then +0.278% . Default 0.
- Fees % : Choose the percentage amount of fees applied to each trade to simulate the application of the strategy on the exchange of your choice. Applies to the entry and exit of each trade. Ex: For Binance Futures: 0.04; For Bybit futures: 0.06; For Ftx Futures: 0.075. Default 0.
- Cumulate Trades : If you check this, the Backtest will use 100% of the balance as Order Size (Position) for All or in the next X consecutive trades. Default not checked.
⚠️ Be Careful please, this option is available to show the full extent and possibilities of the algorithm when pushed to its limits thanks to the accumulation of profits (cumulative earnings), but it is a strategy that involves great risk. If a bad trade suffers a -50% loss, 50% of the account balance is lost, if the position is liquidated, the entire account balance is lost.
- All : If you check this All trades will be accumulated. Default not checked.
- Consecutive Trades : Choose the number of trades to accumulate. After X consecutive trades, the algorithm reassigns the initial order size to the current one and starts again for X consecutive trades. Minimum Value 2, Default 2.
• Settings To Optimize Performances and Risk Management
- (Main Parameter) EMA Length : Choose the length of the EMA. This value will determine the exponential moving average plot (blue line) that represents the equilibrium in this strategy. Depending on the positioning of the price around this equilibrium, the algorithm will decide to trigger Long or Short entry alerts, and exit alerts. Default 200.
- 1 - Confirm (After X Bar(s)) : If you check this, when the algorithm will detect an entry, it will wait for the number of bars you have entered to actually trigger the entry alert. Default not checked.
- Nb Bar : Enter here the number of bar you want, will be taken into account only if you check (1) Confirm (After X Bar(s)). Default 2.
- 2 - Confirm (Trend) : If you check this, when the algorithm will detect an entry, it will check that the trend is similar to the direction of the trade, if not, it will wait that the trade goes in the same direction as the trend to actually trigger the entry alert. Default not checked.
- OR/AND : This choice is taken into account only if you tick both confirmations. If you choose OR: The first of the 2 confirmations to be validated will trigger the entry alert. If you choose AND : once confirmation (1) is validated, the algorithm waits for confirmation (2) to be validated to actually trigger the entry alert. Default OR.
- Use TP / Use SL : If you check these, the algorithm will trigger personalized trade exit alerts when the price evolution has reached the amounts indicated since the trade entry. Default not Checked.
- % TP - SL : Indicate here the personalized amount in percentage that you want for your Take Profit and Stop Loss of each trade. Default 15-5.
• Settings For Appearances
- Small-size Data Table : If you check this, the data table will become smaller to free up more space on the chart to make it visually more pleasing. Default not checked.
Hide Table /
- Hide Labels / : You can check these to get a cleaner chart and focus only on what interests you in the indicator. Default not checked.
Hide Risk-Reward Areas
█ MAIN PARAMETERS TO USE
• In the default settings none of the box settings are checked. Basic strategy is made to be applied this way.
• The main parameter (the length of the EMA) is by default 200 because it is a known value that many traders rely on in many trading strategies. Moreover in this strategy it works in many cases and on different timeframes.
• To go further the user of the indicator is free to modify the parameters of the category "Leading Parameters - Risk Management" to reduce risks and to optimize profits.
• You can find below our recommendations for the EMA length value corresponding to the main timeframes.
m30 — EMA Length = 400 | 800
H1 — EMA Length = 200 | 400
H2 — EMA Length = 200 | 250
H4 — EMA Length = 100 | 200
D — EMA Length = 20 | 40
⚠️ We have chosen to recommend these settings because they will work in most cases, on most cryptoassets, but of course they will not work 100% of the time on all assets and will not always give positive results in the backtest, and they are not the most optimized parameters either. The user of the indicator is free to optimize the asset on which he wants to trade in his own way. Just as we do not give financial advice, we do not encourage to trade any asset in particular.
█ STATISTICS
The statistics presented below are an example of the results that the strategy can provide. (Reminder: These statistics are made over a past period and there is no guarantee that the same performance will reproduce in the future) .
For the demonstration we chose to apply the strategy on the Top 5 marketcap cryptos in September 2022. They are not the most favorable coins for this strategy but at least this way we don't take the most suitable assets to show wonderful and biased results. Likewise for the parameters used which are the default ones and which are not the most optimized parameters, much better results are possible. We chose Binance because it has the highest volumes and liquidity and the most historical data. We chose H1 because it is one of the most used timeframes.
BTC
Screenshot on BINANCE:BTCUSDTPERP Binance Futures, H1, with default parameters (EMA : 400), from 2022-01-01 to 2022-09-27
ETH
Screenshot on BINANCE:ETHUSDTPERP Binance Futures, H1, with default parameters (EMA : 400), from 2022-01-01 to 2022-09-27
BNB
Screenshot on BINANCE:BNBUSDTPERP Binance Futures, H1, with default parameters (EMA : 400), from 2022-01-01 to 2022-09-27
XRP
Screenshot on BINANCE:XRPUSDTPERP Binance Futures, H1, with default parameters (EMA : 200), from 2022-01-01 to 2022-09-27
ADA
Screenshot on BINANCE:ADAUSDTPERP Binance Futures, H1, with default parameters (EMA : 400), from 2022-01-01 to 2022-09-27
To show the potential of the indicator and push it to its limits, here is an example of the strategy applied for about 2 years (Up to the maximum of historical data available).
⚠️ It must be taken into account that during the period of this backtest the last Bullrun took place and it was a very favorable period for the strategy and for this altcoin (FTM), nothing ensures that it will happen again. ⚠️
FTM
Screenshot on BINANCE:FTMUSDTPERP Binance Futures, H4, with default parameters ( without cumulative earnings) and EMA : 400, start on 2020/12/03 to 2022/09/27
✅ All of the above statistics are verifiable by anyone using the indicator's backtesting system.
█ LIMITATIONS
• Despite the fact that we can see good performances when we backtest the strategy, we must take into account the fact that these are results performed in the past and that in no case does this guarantee that these same performances will be repeated again in the future.
• The automation of this strategy is made possible and is facilitated by alerts, but you must be aware of the fact that if you decide to put this strategy into practice in real life, you are solely responsible for the results that you will be able to obtain and you must be aware of the possibility at all times of partial or even total losses of your invested capital.
• Keep in mind that generating profits in trading is difficult. A strategy can perform very well at one time in the past during a period that is favorable to it, then from one day to the next it can give really bad results for several months or years.
• When backtesting a strategy, there are many factors to consider, not just trade entries to which you add a Take Profit and sometimes a Stop Loss. You must at least take into account the size of the position in relation to the capital you want to invest, the trading fees, the slippages (which can be really important depending on the exchange on which you are trading and depending on the asset you are trading), trading frequency, risk management, momentum, volumes and even more.
• This indicator has been optimized for crypto, you can try to use it on other type of assets but again, at your own risk.
The information published here on TradingView is not prohibited, doesn't constitute investment advice, and isn't created solely for qualified investors.
═════════════════════════════════════════════════════════════════════════
Important to note : our indicators with the same backtesting system are published in separate publications, because putting them together in a single script would considerably slow down the execution of the script. In addition each indicator, even when it is based on a simple technical indicator, has several options, parameters and entry/exit conditions specific to the underlying technical indicator. Finally, we want to keep the simplicity of use, configuration and understanding of our indicator by not mixing strategies that have nothing to do with each other.
Shift DashboardThe Shift Dashboard is a simple table that shows where current price is relative to the 8 EMA and 21 EMA, as part of the DCXTRA Shift Strategy.
If current price is below the 8 and 21 EMAs, the dashboard will provide a red sell signal.
If current price is above the 8 and 21 EMAs, the dashboard will provide a green buy signal.
If current price is between the 8 and 21 EMAs, the dashboard will leave a blank reading.
The dashboard shows buy or sell signals based on various timeframes.
If all timeframes are aligned with all buy or all sell signals, then the trader takes a long/short position at the appearance of a candlestick reversal pattern with price pushing off the 21EMA in the direction of indicated trend.
Momentum - EddyThis indicator uses momentum, emas, macd trend, probability to find the best entry for both long and short positions.
L = Long
When the low goes below the green line (ema fast low), close is above open and momentum is up
S = Short
When the high goes above the red line (ema fast high), close is below open and momentum is down
XS = Exit short at potential bullish pivot
When the low is below a red step (probability) and below ema fast low and both ema fast high and low are 0.5 % (can be changed in the settings) spread, and high is below ema fast low and open is at least 0.2 % spread (can be change in the settings).
XL = Exit long
When the high is above ema fast high and above a green step (probability) with at least 0.2 % spread (customizable in the settings)
The win rate changes based on the % change parameter. The lower the % change the higher the win rate will be.
Green and Red background shows you a bull trend or bear trend. It uses the Mac signal (periods are customizable in the settings).
You can add alerts for Long / Short / Exit Long / Exit short.
You can adjust parameters in the settings.
Use your own judgement to place trades. This algorithm helps you remove the stress of trading.
To avoid false signals trade from 4h timeframe +.
PowerOfStocks_5EMAThis indicator is based of Subhashish Pani's (power of stocks) 5 EMA Strategy.
It plots 5 EMA and Buy/Sell signals with Target & Stoploss levels.
What is Subhashish Pani's (power of stocks) 5 EMA Strategy :-
His strategy is very simple to understand. for intraday use 5 minutes timeframe for selling. You can sell futures, sell call or buy Puts in selling strategy.
What this strategy tries to do is , it tries to catch the tops, so when you sell at top & it turns out to be a reversal point then you can get good profit.
this will hit stop losses often, but stop losses are small and minimum target should be 1:3. but if you stay with the trend you can get big profits.
According to Subhashish Pani this strategy has 60% success rate.
Strategy for Selling (Short future/Call/stock or buy Put)
When ever a Candle closes completely above 5 ema (no part of candle should be touching the 5ema), then that candle should be considered as Alert Candle.
If the next candle is also completely above 5 ema and it has not broken the low of previous alert candle, Then the previous Alert Candle should be ignored and the new candle should be considered as new Alert Candle.
so if this goes on then continue shifting the Alert Candle, but whenever the next candle breaks the low of the Alert Candle we should take the Short trade (Short future/Call/stock or buy Put).
Stoploss will be above high of the Alert Candle and minimum target will be 1:3.
Strategy for Buying (Buy future/Call/stock or sell Put)
When ever a Candle closes completely below 5 ema (no part of candle should be touching the 5ema), then that candle should be considered as Alert Candle.
If the next candle is also completely below 5 ema and it has not broken the high of previous alert candle, Then the previous Alert Candle should be ignored and the new candle should be considered as new Alert Candle.
so if this goes on then continue shifting the Alert Candle, but whenever the next candle breaks the high of the Alert Candle we should take the Long trade (Buy future/Call/stock or sell Put).
Stoploss will be below low of the Alert Candle and minimum target will be 1:3.
Buy/Sell with extra conditions :
it just adds 1 more condition to buying/selling
1. checks if closing of current candle is lower than alert candles closing for Selling & checks if closing of current candle is higher than alert candles closing for Buyling.
This can sometimes save you from false moves but by using this, you can also miss out on big moves as you'll enter trade after candle closing instead of entering at break of high/low.
Note :- According to Subhashish Pani Timeframe for intraday buying should be 15 minutes Timeframe.
If you haven't understood the strategy by reading above description, then search for "Subhashish Pani's (power of stocks) 5 EMA Strategy" on youtube to get a deeper understanding.
Note:- This is not only for Intraday trading , you can use this strategy for Positional/Swing trading as well. If you use this on Monthly Timeframe then it can be very good for Long Term Investing as well.
Rules will be same for all types of trades & Timeframes.
3 Series Cross Indicator with Alerts - by WAMRAThis Indicator allows users to add any 3 combinations of moving averages (SMA, EMA, RMA, RSI, Stochastic RSI, WMA, VWAP ) with granular alert conditions.
Users can alert when all series are in climbing or declining mode.
SUPER MULTI MOVING AVERAGE [Gabbo]📈 Moving Average Indicator Update - Version 2
🔹 New Features and Improvements:
1️⃣ Enhanced MA Selection for Table Lines:
Previously, the indicator did not allow users to choose a different Moving Average type for the table lines. Now, you can select the MA type for the table.
2️⃣ New Table Text Customization Inputs:
Added inputs to choose the table text color and size for a more personalized display.
3️⃣ Improved Input Visibility and Organization:
We’ve reorganized the inputs so that the most commonly used options are now placed at the beginning for quicker and more convenient configuration.
4️⃣ Bug Fixes and Code Improvements:
Minor bugs have been fixed, and the code has been optimized for improved stability and performance. The code is now cleaner and fully functional in version 6.
5️⃣ Cometreon Public Library Integration:
To lighten the code and improve modularity, we’ve integrated the Cometreon public library. This makes the code more efficient and reduces the need to duplicate common functions.
☄️ With this update, the Moving Average indicator becomes even more versatile and user-friendly, offering a refined table interface and enhanced customization options!
Ichi-Price WaveWelcome to the Ichi-Price Wave. This indicator is designed for day trading options contracts for any ticker, using a number of indicators — Ichimoku Cloud, Volume-Weighted Average Price, Stochastic Relative Strength Index, Exponential Moving Average (13/48) — and calculating how they interact with each other to provide entry and exit signals for both Calls and Puts on normal days. ****Read the Important Information section before opening any positions based on this indicator. (Also *NFA)
The general concept is that you, the trader, are a Surfer 🏄🏾 who rides the best waves in deep water until it gets dangerous.
Emoji storyline: The 🏄🏾 emoji (Call or Put, depending on the color of its Green or Red label, respectively) indicates an upcoming *potential* entry that, for a number of reasons, may be disregarded. (See: Important Information section below). And just as there are no certainties in the stock market itself, the tiered exit signals are ranked by low 🐬, medium 🦈 and high risk 🦑 tolerance. (In other words, it's relatively safe to surf with dolphins around, but there's the off chance they even strike trainers and become aggressive. It's more dangerous to swim with sharks. And on the unlikely, rare occasion you see a literal, giant, mythical, ship destroying Kraken 😬 ... you definitely need to get out of the water.
Surfing for as long as possible reaps the greatest rewards — but risk/reward are to be considered for entries and exits. Exiting every time you see a 🐬 (E1) should secure profits nearly 100% of the time, but they'll be very minimal. Whereas surfing til you reach a Kraken 🦑 (which will not even appear on most Price Wave cycles) would reap the most rewards. (NFA: I recommend considering sharks 🦈 as an exit point for the majority of positions, and perhaps only keeping a few runners open with the hopes of finding that shiny Kraken. (On the non-Emoji chart, the low, medium and high risk exits are named E1, E2 and E3, respectively. Got to the indicator's Settings > Inputs > then toggle EMOJIs ON/OFF)
Boring stuff: The entry 🏄🏾 signals are triggered by multiple conditions that must be all true. For Call entries, one of the necessary conditions is that the RSI's K must be maximum 10 (this can be changed in default). This, along with another condition where current price must be below the VWAP Lower Bound 1, serves as a great reference point showing the stock price is currently uncomfortable where it is and may likely soon snap back closer to the VWAP, perhaps even to the other side due to a pendulum effect.
Important information
Relying on those two factors for setting entry and exit points are great for normal days. (Normal, as in the ticker price bounces within a channel (e.g., ≤3% + or -) that's trending slightly bullish or bearish depending on greater market trend). But there are abnormal days where news catalysts (e.g., CPI data, CEO scandals, unexpected company data release, etc.) trigger FOMO and FUD, ultimately rendering the logic behind most indicators non applicable (e.g., RSI's "buy when oversold"). On the chart, this indicator accounts for this with two measures:
One, you should only "Surf" in the water. That is, there are two bands — Shallow and Deep Water. Any "Surf" emojis where price action is outside of the water should be ignored**. Two, there are additional EMOJIs that show you "Bearish trend" ⛈ and "Bullish trend ☀️. (Story time again: You obviously shouldn't surf in thunder and lightning. But also, surfing in the blistering sun with no clouds in the sky during a heatwave is also dangerous to your health.)
You can use these two measures to disregard the "surfers" suggesting you join them in opening a position in the suggested direction. And surfers followed by Cloud EMOJIs — 🌤️ (Put) or 🌧️ (Call) — can be used as "perfect entry" points. (The clouds represent weather being less extreme and better for surfing).
(**While these should mostly be ignored, these have not been muted because there is the possibility of a very strong turn around if you happen to catch the last one (which is not ideal for risk-averse traders). Use other indicators, such as the MACD and trend lines, to find potential bottoms (or tops) as price action plunges (or soars) due to abnormal news circumstances.)
Entry and exit buffers
At the beginning of each day, most indicators usually are not immediately calibrated correctly due to premarket trading and open market (at least to the degree that the day's sentiment can be best read from them due to the amount of volatility). What I recommend when using this indicator is disregarding signals during the first 15 minutes (or possibly 30 minutes) of market open to get the best results. And also, considering this indicator is meant for day trading (i.e., not holding positions overnight), disregarding ENTRY signals for the last 45 minutes of the trading day could give yourself enough buffer on the back end for exiting comfortably.
RSI entry
Preparing for an entry when you see a surfer is recommended, but actually opening the position when you see a 🌤️ (Put) or 🌧️ (Call) would yield best results and avoid misfires — particularly when those two cloud EMOJIs are signaled when the RSI is overbought and K is at least 95 (Puts), or oversold and K at maximum 5 (Calls). (Story time logic: The cloud eclipsing the Sun means it's cooling off and better for surfing. And the rain cloud no longer having lightning means the "bearish" storm is possibly soon over).
Delta and the Greeks
You should experiment yourself, but keep in mind that this is for capitalizing off of a day's minor price swings (≤3% + or -). Entering a same day expiry contract that's deep OTM is not going to work with this indicator (even if you enter at a surfer 🏄🏾 and exit at a Kraken 🦑) because the price wave from one end to the other won't be enough to compensate for the other Greeks working against you. Use another indicator (or insider knowledge ... Just kidding, that's illegal, don't do that) if you want to buy those kind of contracts.
I personally purchase contracts w/ minimum 80% Implied Volatility and somewhere between 20-40 Delta. Having a nice range for yourself with these factors, depending also on the size of your own portfolio and the risk tolerance you have, will determine how much you're able to capitalize off successful entry and exits.
Tips
• I set stop losses 5-10% depending on the ticker. (e.g., $TSLA's volatility may require SL closer to 10% whereas using it on $SPY, a 5% could suffice). This is in addition to ignoring entry signals that don't meet the aforementioned two requirements (i.e., it's risky to Surf in shallow water, and you shouldn't try to Surf at all outside of the water, ref. Band 2 and outside of Band 2). Remember, this is the stock market — not the casino. We rely on strategy and risk management — not hope.
• It's recommended you use time intervals ≤ 5 min. (I use 1 minute and 5 min)
• Liquidity . Using these signals on a ticker with low liquidity (particularly if you enter on the Ask side), can reduce your profits to 0% or even to a loss even if you have a perfect entry and exit. I always point to SPY as the optimal bid-ask spread, but keep that in mind.
What's with the name "Ichi-Price Wave"?
The "Ichi" gives credit to Japanese journalist Goichi Hosoda, whose indicator I used in conjunction with the 13/48 Exponential Moving Averages to create some of the exit signal conditions (e.g., E2🦈). That E2 condition is: Signal the first time the price intersects the Ichimoku conversion line *after* it has entered the VWAP UB/LB channel on one end and has exited on the opposite end). And it's named "Price Wave" because it's a literal price wave, which is where the fun surf narrative comes in. Also, "Price" doubles as me naming it after myself (in a less pretentious way). It's actually convenient that my last name is literally Price. Almost as if I was born for this. Nonetheless, this indicator is far more accurate in spotting directional changes than the free 13/48 cross, which oddly enough, influencers are charging for access. It's free, but the code is protected, for now at least.
Try it out on any ticker and look at how accurately it catches the tops and bottoms (keeping in mind to ignore misfires according to the two measures and also setting ~5-10% stop losses). And of course, use this in conjunction with other indicators. Ignoring all of my other emojis and simply setting surfer 🏄🏾 alerts could serve as additional confirmations for your personal strategy. Or you could simply enter at a surfer 🏄🏾 and exit when it reaches VWAP (or at least increase your Stop Loss to sell at break even if it doesn't reach). That strategy is the most conservative and would secure consistent gains). AND AGAIN, use your stop losses. Either it makes a move or it doesn't. Simply re-enter at a better point if necessary.
WilliamTrendFollowerWith this indicator, we try to catch the trends in price. With continued use of this indicator, we expect it to eventually escape horizontal positions and catch up with continuous trends.
Combined with the WilliamsR indicator and the exponential moving average indicator.
The WilliamsR Fisher Transforms are combined with the ATR indicator to create a line that lags behind the moving average value.
Since it is a tracking indicator, we created a line that is more connected to the price and itself.
In this way, a curve close to the price line is obtained in uptrends and downtrends.
In this indicator, if you choose the parameters correctly, you can easily bypass the horizontal positions. This gives you a safe visualization of support and resistance points as well.
With this tracker, you can generate Buy and Sell signals and you can see them on the chart.
From the settings of these indicators, you can set the multiplier and the exponential moving average period.
It works in all time intervals.
But it was calculated without volume , instead it was created using fisher transforms, moving averages, and the average true range .
You can set an alarm for Buy and Sell orders.
You can see the processing entry and exit areas in a straight line.
The Fisher Transform indicator is an oscillator that helps identify trend reversals and can be applied to any financial instrument. J.F. Created by Ehlers
Muti EMAVẽ 5 Đường EMA , chỉ số mặc định tương đường với dãy số Fibonanci (ngoại trừ đườn EMA200), giúp cho những tài khoản free có thể sử dụng hơn 3 chỉ báo BINANCE:NEARUSDT
JSS:Relative Strength Index//Date: 5-Oct-22
//Author: Jatinder Sodhi
RSI Indicator with colour coding.
Blue - Long
Red - Short
Gray - Stay Out
Best used for Intraday on 5 minute charts. Works well on other timeframes as well.
@Inspired from Asit Baran's RankDelta-RSI Indicator.
ST_EMA+VWAP_V0.0Scalping strategy using relative position of price, intraday VWAP and EMAs
ex of timeframes for scalping 3 and 5 min chart
*** Default settings
- EMA 8 / 20
- Intraday VWAP
*** For bull conditions:
- Price must close twice above all lines above
- EMA 8 must be above EMA20
- should have a recent crossover between EMA8 and EMA20
(E)Moving Average Ribbon High/LowThis is a slight modification of the standard Moving Average Ribbon. This script will take the 200 EMA and SMA with source the high and low, not the close.
This band will act as a support and resistance zone and should be used as a confluence with other indicators or support/resistance lines.
I got inspired to create this one, by the YT video "FINALLY! The 200 EMA Confluence Trading Strategy You’ve Been Waiting For" by The Secret Mindset.
In his video he takes only the 200EMA, but this script will take by default also the SMA into account.
In the settings you still can adapt as you wish ;-)
Happy trading!
Fibonacci EMA's with Bollinger Bands [Feniks]Many Fibonacci EMAs are calculated and then tracked using custom-colored candlesticks so that your chart remains very clean. This setup is mainly used for scalping on the 2min. Feniks uses gray candlesticks and then all of the custom-colored candlesticks to know when to react to price action.
WARNING: Do your own due diligence and try it out. Also, the script's default colors were determined with the chart's candlesticks being gray for both bullish/bearish candles. You'll probably have to change some of the colors to make use of the script if your chart's candlesticks are not similarly configured.
The main two strategies involve the 13/55 and 21/233.
The 13 EMA (blue) crosses above or below the 55 EMA (green).
- 13/55 Crossover is shown by the triggering candlestick being blue.
- 55/13 Crossunder is shown by the triggering candlestick being orange.
- (Alerts 1/2)
The 21 EMA (red) crosses above or below the 233 EMA (white).
- 21/233 Crossover is shown by the triggering candlestick being green.
- 233/21 Crossunder is shown by the triggering candlestick being red.
- (Alerts 3/4)
Supertrend, MA 44|6, EMA FIBS 13|21|34I have this indicator based on my strategy. This indicator is based on existing functions available in the system. I haven't added anything new. This indicator uses Supertrend, MA44|6, EMA fibs 13|21|34 combining to find a profitable trade.
- Supertrend : Indicator uses supertrend strategy with default ATR period of 10 and Factor value 3. These values can be customized based on your preferences. Uptrend is denoted by green color and downtrend by red color. You can change the colors based on your preferences.
- MA 44|6: Indicator plots moving averages of 44 and 6. These values can be customized based on your preferences. Although it is highly recommended to keep 44 as is. Value 6 can be adjusted based on your preference. Default color for uptrend is green and for downtrend is red. You can change the colors based on your preferences.
- FIBS EMA 13|21|34: Indicator plots EMA of fibbonacci numbers 13, 21,34 to identify consolidation and breakout. The periods can be adjusted but it is highly recommended not to do so. Default colors for 13,21 and 34 is Aqua, Blue and Navy respectively. You can change the colors based on your preferences.
When to take trade?
To take a trade all conditions needs to be fulfilled.
Supertrend : Always take a trade in the direction of Supertrend. It is always advisable to take trade if the trend is changing or price is taking support of resistance.
MA 44|6: Moving average 44 indicates average price of 44 last candles and 6 for last 6 candles. Price crossing MA 44 indicates change in trend. It is advisable to take trade at crossing the line above or below. If many candles closing near MA 44 then it indicates consolidation. The more far the candle closes from MA44 the better. MA 6 is used to identify when to enter or exit the trade. If candle closes away from MA 6 then you can wait for candle to start near the MA 6 line. If candle closes above/below MA 6 you can exit your trade.
Fibonacci 13|21|34: When all lines are closed it indicates consolidation. When price breakouts to either direction you can take a trade in that direction with following conditions.
Bullish Trade:
When to enter?
If candle closed above MA 44, Supertrend is uptrend and EMA Fibs are moving away and are above MA 44. The price is near to MA 6 line then you can enter into bullish trade. If price is away from MA 6 then you should wait until the price/line comes near to avoid loss.
When to exit?
Price moving in opposite direction:
You should set a stop loss when you enter the trade. The stop loss can be set below the low of the previous candle or any other strategy you have. But it is really important to set the stop loss. If price moves in opposite direction then your stop loss will hit and you will be out of the trade.
Price moving in same direction:
Once you enter the trade you can exit based on two conditions whichever suits you.
1. Exit the trade if candle closes below MA6. The drawback is you may exit too early. You can also adjust the period based on your preferences.
2. Exit the trade if candle closed below low of previous candle. The drawback is you may book less profit but you can capture the movement very well.
Bearish Trade:
When to enter?
If candle closed below MA 44, Supertrend is downtrend and EMA Fibs are moving away and are below MA 44. The price is near to MA 6 line then you can enter into bearish trade. If price is away from MA 6 then you should wait until the price/line comes near to avoid loss.
When to exit?
Price moving in opposite direction:
You should set a stop loss when you enter the trade. The stop loss can be set below the low of the previous candle or any other strategy you have. But it is really important to set the stop loss. If price moves in opposite direction then your stop loss will hit and you will be out of the trade.
Price moving in same direction:
Once you enter the trade you can exit based on two conditions whichever suits you.
1. Exit the trade if candle closes below MA6. The drawback is you may exit too early. You can also adjust the period based on your preferences.
2. Exit the trade if candle closed below low of previous candle. The drawback is you may book less profit but you can capture the movement very well.
When not to take trade?
1. If MA 44 is completely horizontal and EMA Fibs are very close to each other. This indicates that the market is consolidated and if you enter the trade you may hit stop loss very often.
Note: Please note that I am not expert and I don't take any responsibility of your profits or losses. I have created this indicator based on my knowledge and it is for study purpose. Use of this indicator is totally your responsibility. Use all your knowledge and expertise and don't totally depend on the indicator. Don't forget to use stop loss and do money management.
Happy Trading!
Vegas AutoThis is a trial script that searches for Vegas buy/sell signals in different time frames.
When a Vegas signal is found, it remains valid until the Vegas tunnel at that time frame is broken (i.e. 12 EMA crosses 144 EMA), or the candle closes across the 200 EMA.
When a signal in a lower time frame is found, the Vegas signal in higher time frames are also considered to be valid, as long as the corresponding EMAs are in the appropriate order. And when the Vegas signal in a lower time frame is invalidated, the script automatically switches to the next higher time frame that is still valid.
The Vegas tunnels when the buy/sell signals are valid are shown as green/red lines. The time frames considered are 30m, 1H, 2H, 4H, 6H, 12H, and 1D.
Fibonacci MAsIt's a pretty simple script. Idea is to compute MAs with the length of Fibonacci numbers and then compute an average of them all.
In the script, you can choose the type of MAs and how many Fibonacci numbers to use for it.
You can also adjust the length of these MAs manually and choose the color of every one of them.
Thanks to @MUQWISHI for helping me code it.
Disclaimer
Please remember that past performance may not be indicative of future results.
Due to various factors, including changing market conditions, the strategy may no longer perform as well as in historical backtesting.
This post and the script don’t provide any financial advice.
sohail Anjum EMA buy sellBased on Sohail anjum
Ema crossing teaching
Crossover alerts, only in trend 200 Ema (yellow line) make sure If the price is above the 200 EMA, you can prefer a long position and ignore short positions.
If the price is below the 200 EMA, you are allowed to open only short positions and avoid long positions.
Do not use this indicator alone, Use other recommended indicators by ShohailAnjum Rsi, Macd , chart pattren, etc
This indicator good win rate in 15m TF recommended 1H, 4H
Trend ExplosionThis script features a combination of trend indicators. Upon backtesting various indicators and how price action reacts to past signals, I discovered that using a combination of conditions would allow for a simple, easy-to-use, yet (in my opinion) accurate representation of current market sentiment. I typically use this on the 5/15 minute charts as I reference higher timeframe conditions. If you would like to trade the 1 hour and above timeframes, you would have to manually adjust the timeframe you want under "Resolution". Another thing to note is that this script provides a REFERENCE for trends. It does not provide entry and exit signals and you would have to discretionarily determine those yourself.
Long sentiment = Green triangles below the bar
Short sentiment = Fuchsia triangles above the bar
Due to a large amount of effort and time taken into creating this script, I have decided to protect the source code. If you do have any suggestions, you can feel free to drop me a DM.
EMA x5A simple script involving exponential moving averages. It draws on 5 customizable lookback periods for the EMA and draws it on the chart. From backtesting, periods of confluence between all of the exponential moving averages lead to trades with an increased probability of working out. I have also taken the liberty and added the feature of including higher timeframe comparisons on the same chart. For example, you can choose to draw a 50-period 4-hour EMA on your 5-minute chart if you are an intraday trader. This might holistically help with your analysis by having the data on a single chart. This indicator also helps traders who are using the free or pro versions of TradingView and want to use 5 EMA's but TradingView's indicator count does not allow that many.
I have also made the script open source for anyone looking to reference code.
Relative Strength Index with fast and slow MAsThis is the typical Relative Strength Index indicator with two moving averages, one slow (length 50 by default) and one fast (length 20 by default). Additionally, there are four lines, which mark the oversold/overbought signals at different levels, there are two inner bands with values at the levels 40, and 60, and two outer bands at the levels 20, and 80. The presence of the fast and slow moving averages and their crossover/crossunder with the oversold/overbought levels or the RSI can provide more insightful and faster signals. The indicator has a slightly different colouring mechanism.
The views of the RSI indicator on the above the price chart in both dark and light modes: