Cauchy Distribution Trend AnalysisThis custom Pine Script indicator is designed to analyze assets, including cryptocurrencies, through a lens inspired by the Cauchy distribution's characteristics. It focuses on identifying potential long and short opportunities by evaluating the asset's price position relative to a dynamically calculated median price and a scale parameter. Here's a breakdown of its components and how to use it:
Components
Median Length: The period over which the median price is calculated. The median price acts as a proxy for the Cauchy distribution's location parameter, representing a central value around which the market price fluctuates.
MA Length: The length for calculating the moving average, which is used to determine the scale parameter. The scale parameter estimates the average volatility around the median price, adjusted for the selected averaging method.
Moving Average Type: Offers a choice between HMA (Hull Moving Average), SMA (Simple Moving Average), and EMA (Exponential Moving Average) to calculate the scale parameter. This flexibility allows users to tailor the sensitivity of the scale parameter to the asset's price volatility.
Median Price Calculation: Uses the close price (by default) to calculate the median price over the specified period.
Scale Parameter Calculation: A function that calculates the scale parameter based on the chosen average source. This parameter is used to identify the threshold for long and short conditions.
Strategy Logic
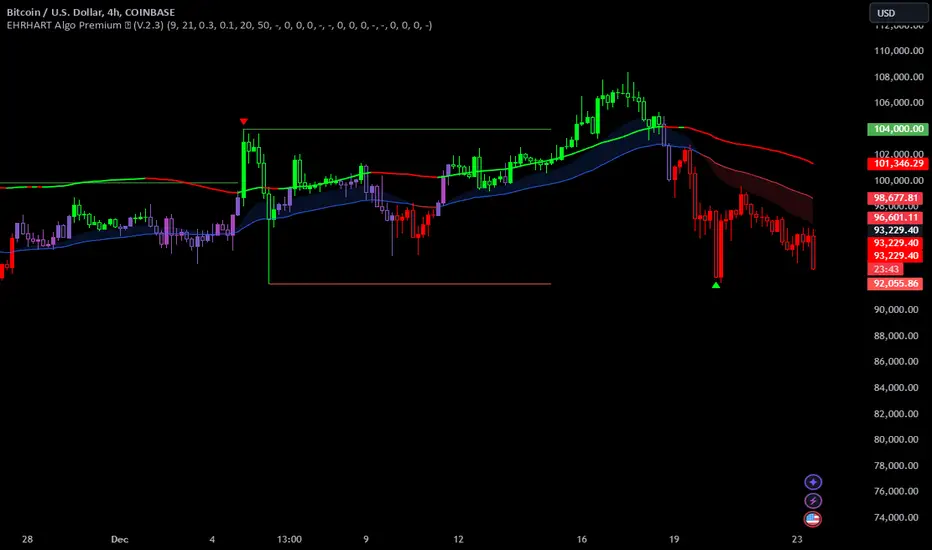
Long Condition: Triggered when the asset's close price is greater than the sum of the median price and the scale parameter. This indicates that the asset's price has moved significantly above the median price, suggesting bullish momentum.
Short Condition: Triggered when the asset's close price is less than the difference between the median price and the scale parameter. This indicates that the asset's price has moved significantly below the median price, suggesting bearish momentum.
Pine Script® indicator