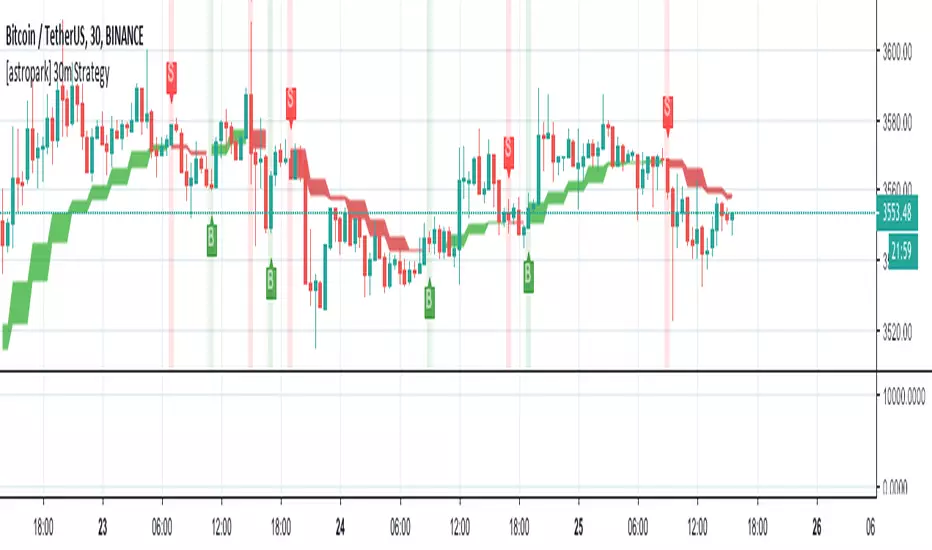
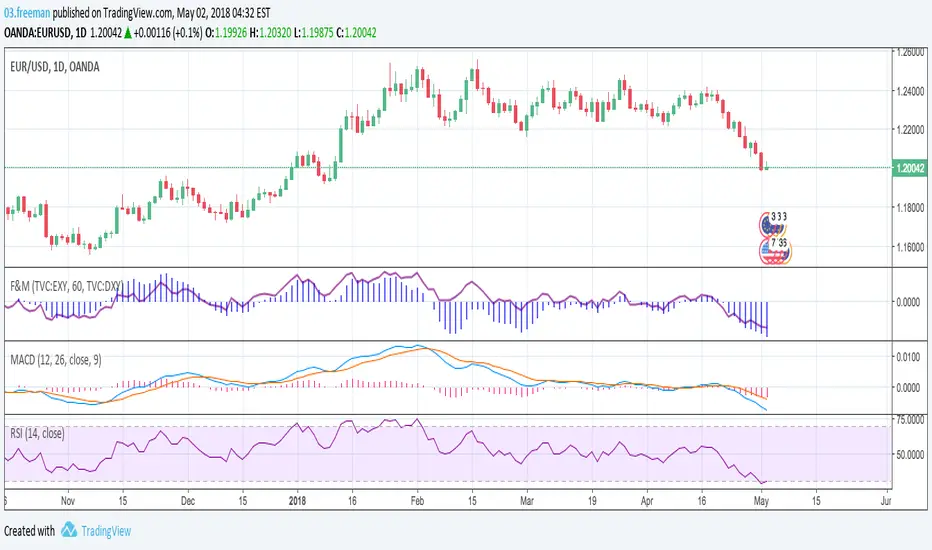
[astropark] Low TimeFrame Strategy (2H or lower)Buy/Long when you see a green "B" label on the screen "at best price you can", considering green cloud as support for more buys/longs
Sell/short when you see a red "S" label on the screen "at best price you can", considering red cloud as resistance for more shorts
BTC jar: 1K5kuYQPEqoNo6GRmJbHWMPmqwKM5S3oRR
ETH jar: 0x091b541a6dd6fe08c4e7bd909baafb2fce9b975e
LTC jar: LSVoAChsZrVsvbNyUfdpxtFpDAUSaUTUig
XRP jar: (XRP deposit tag) 103997763 (XRP deposit address) rEb8TK3gBgk5auZkwc6sHnwrGVJH8DuaLh
EURUSD
USD/JPY/GBP/EUR merged from BTCxFIATBTC market 24h 365D (data from BitFinex BTCxFIAT)
BitUSDJPY = BTCJPY / BTCUSD
BitEURJPY = BTCJPY / BTCEUR
BitGBPJPY = BTCJPY / BTCGBP
BitEURUSD = BTCUSD / BTCEUR
BitGBPUSD = BTCUSD / BTCGBP
BitEURGBP = BTCGBP/ BTCEUR
It may complement the holiday time of forex
this indicator need to apply on BTC chart(virtual currency cahrt)

RSI Multi Time Frame [Jigga]This indicator simply displays RSI on 4 time frames. You can configure individual RSI lengths as well. The first two RSIs are more visible to prevent clustering. It is possible to define oversold / overbought areas and the script displays the middle line as well.
A couple of use cases:
Comparison of 7, 12, 18 and 24 RSIs on a given time frame
Comparison of 14 RSI on 30m, 1h, 2h and 3h time frame (Default settings)
Please, always use a proper stop loss and risk management.
Here you can see it in action:
BTC - BitMex
BTC - BitMex

RSI Bands Multi Time Frame [Jigga + LazyBear]This is a modified version of LazyBear's RSI Bands script. I added the possibility to display multiple RSI bands, so you can see the zones, where it is viable to enter a long or a short. You can also use different time frames, so you can visually see where any specific value of RSI is for your given time frame. This gives you a lot of possibilities. Default settings use 1h time frame and the most common reversal areas for RSI. Feel free to change the settings as you see fit. If the script makes your candles too small, you can go to style and turn off individual RSI bands. After that you will still be able to see the zones, but the scale of your chart won't be affected.
It also displays the middle line, which shows you the current trend and can prevent you from entering a long, when RSI is oversold during a strong downtrend or a short, when RSI is overbought during a strong uptrend.
Do not forget to use a proper stop loss and risk management.
Here you can see it in action in different markets:
BTC - BitMex
NASDAQ Composite - Stocks
EUR / USD - Forex

VJ_Holy_Grail_BigSwing_TraderBig Swings Trading Indicator
Suitable for Stocks, CFDs and Forex.
Not at all suitable for cryptocurrencies due to lack of historical data.
Add script to your favorites to gain access.

Forex CorrelationsA utility tool to find linear relationships between different currency pairs and
specified symbols. This is another private indicator of mine.
Features
37 well known Forex pairs
3 correlation display modes ( Positive and Negative , Positive , Negative )
Ability to specify any symbol to see correlations
Ability to specify a preferred timeframe
Readable and optimized code
Supported pairs
USDCAD
USDMXN
USDBRL
USDCHF
USDRUB
USDTRY
USDZAR
USDJPY
USDCNY
USDHKD
CADCHF
CADJPY
EURUSD
EURCAD
EURGBP
EURCHF
EURRUB
EURTRY
EURJPY
EURCNY
EURAUD
EURNZD
GBPUSD
GBPCAD
GBPJPY
GBPCNY
GBPAUD
GBPNZD
AUDUSD
AUDCAD
AUDCHF
AUDJPY
AUDCNY
AUDNZD
NZDUSD
NZDJPY
NZDCNY

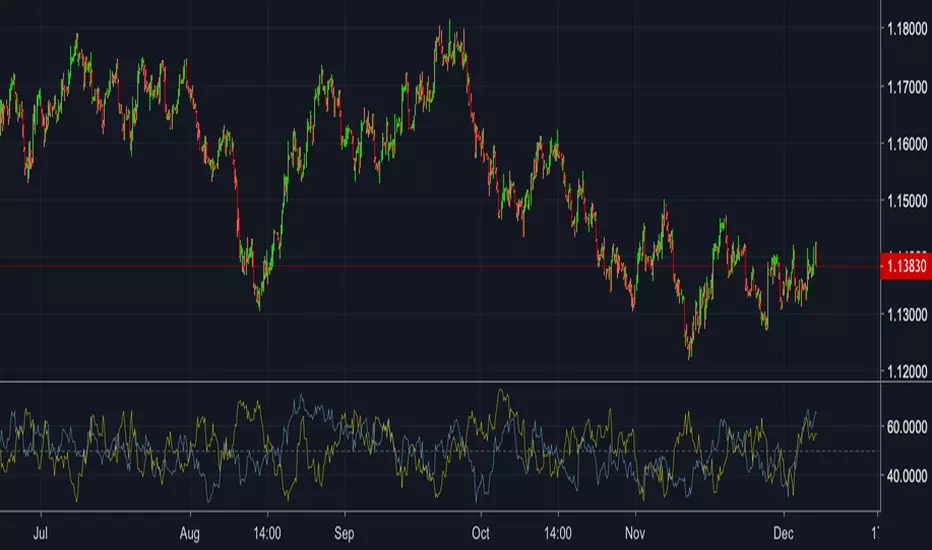
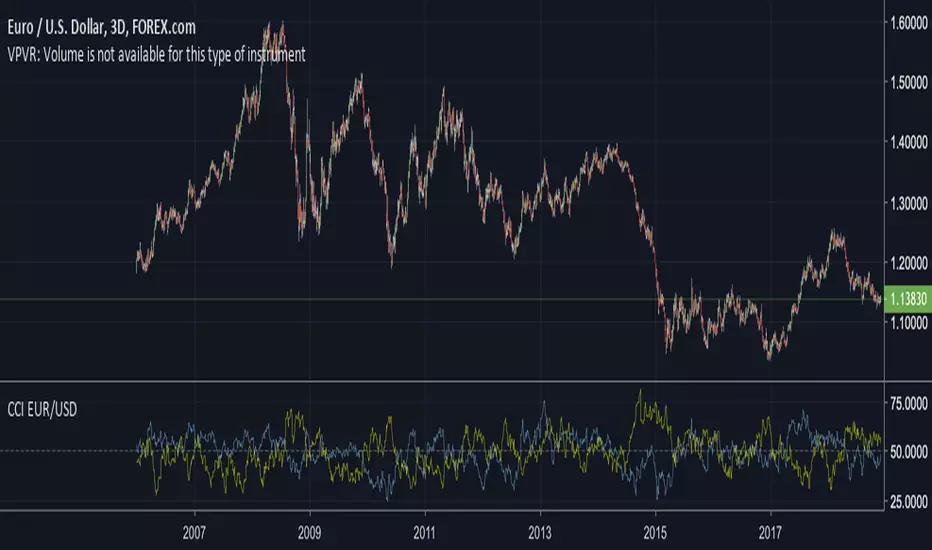
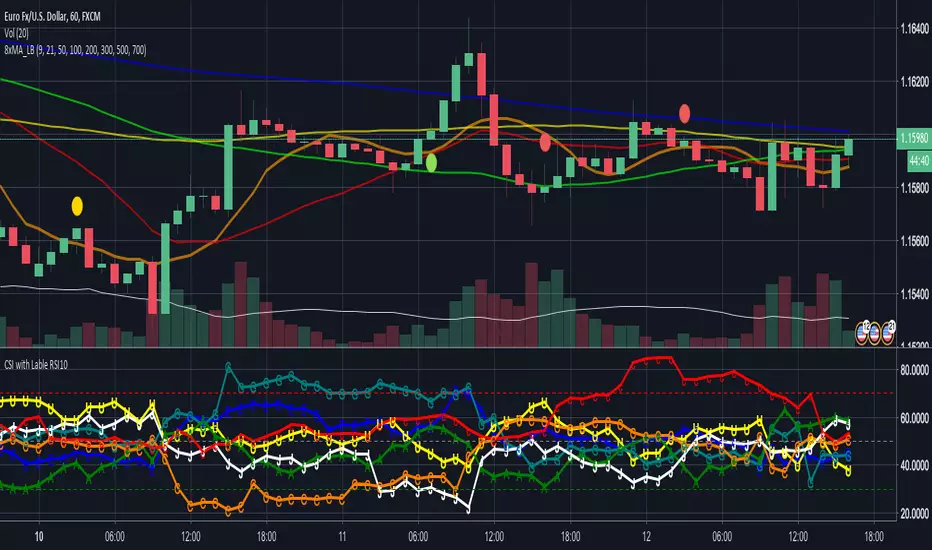
CSI - Currency strength indicator RSI 10This Indicator shows you the strength of the Currency in comparison for all other Main Currencys at the timeframe you choose.
The Currencys in this Indicator is: EUR, USD, GBP, CHF, AUD, CAD, JPY
The Base is the RSI (relative strength Indicator) with the following Currency pairs:
eurusd, eurgbp, euraud, eurjpy, eurcad, eurchf
usdeur, usdgbp, usdaud, usdjpy, usdcad, usdchf
gbpeur, gbpusd, gbpaud, gbpjpy, gbpcad, gbpchf
audeur, audusd, audgbp, audjpy, audcad, audchf
jpyeur, jpyusd, jpyaud, jpygbp, jpycad, jpychf
cadeur, cadusd, cadaud, cadgbp, cadjpy, cadchf
chfeur, chfusd, chfaud, chfgbp, chfjpy, chfcad
The letters in the LineChart:
EUR = E
USD = U
GBP = G
CHF = C
AUD = A
CAD = C
JPY = J
The CSI can help to see, if your trading pair have the potential to breakout on the support and resistance or if it more likely go back.
Some people say that the banks use this indicator.
NZD is missing there because Tradingview only support 6 variables.
If you have a solution for than, please let me know.
Thanks
XBT Volatility Weighted Bottom Finder. [For Daily Charts]An update to:
Made it into and indicator.
v. 0.0.1
DESIGNED FOR DAILY CHARTS

Trendster v1.0The Trend Is Your Friend
Trendster v1.0 will give you simple areas of possible entries (both long and short) in order to jump on board new trends early and stay in the trade for maximum profit. Can be used with most assets including equities, FOREX and cryptocurrencies. Alerts can be created from this indicator allowing for better manual trade timing or autotrading. Happy trading!

PeBAS €$ Scalper 5m ALERT VersionHere is the EurDollar ScalpingScript for Alerts.
Have fun and the sun in your heart!

Dhananjay Volatility stop strategy v1.0
Sharing one more strategy after getting good feedback on my earlier published strategy.
This is simple volatility stop strategy where in we are using VStop as entry and exit point.
Again smart traders can add MA to decide the trend and can avoid trading in opposite direction of trend which will help them to minimize loss making trades.
There are more than 1 parameters which traders can use/change to make this strategy compatible to their instrument.
To understand what is VStop use google.com :-)
Looking forward to receiving feedback from all of you.

Strenght and MomentumThe scope of this script is to measure momentum and strenght of EURO and DOLLAR using their indexes.
Forza (line) above 0 means EURO is stonger than DOLLAR
Momento (histogram) above 0 means EURO has a positive momentum against DOLLAR
The added value to see MACD and RSI directly on EURUSD chart is that indexes consider also other pairs so their RSI and MACD has a larger view on forex markets.
Script has also an option for multi timeframes.
I think that could be used as filters for LONG or SHORT positions in lower time frames.
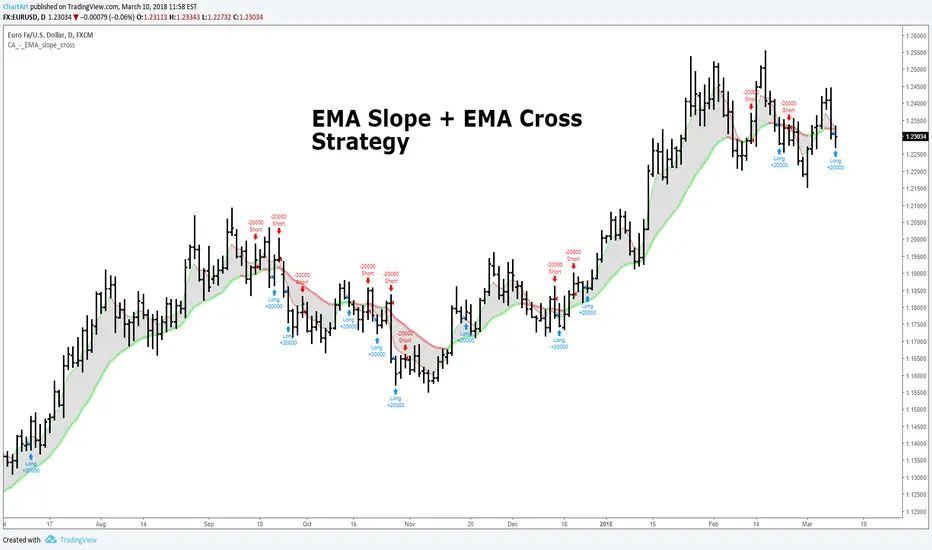
EMA Slope + EMA Cross Strategy (by ChartArt)This strategy uses divergences between three exponential moving averages and their slope directions as well as crosses between the price and these moving averages to switch between a long or short position. The strategy is non-stop in the market and always either long or short.
In addition the moving averages and price bars are colored depending if they are trending up or down.
The strategy was created for the "EURUSD" daily timeframe.
All trading involves high risk; past performance is not necessarily indicative of future results. Hypothetical or simulated performance results have certain inherent limitations. Unlike an actual performance record, simulated results do not represent actual trading. Also, since the trades have not actually been executed, the results may have under- or over-compensated for the impact, if any, of certain market factors, such as lack of liquidity. Simulated trading programs in general are also subject to the fact that they are designed with the benefit of hindsight. No representation is being made that any account will or is likely to achieve profits or losses similar to those shown.
HL MovingAvg2Line Cross Dhananjay
Sharing the simple trend following trading strategy, traders can add their own rules in this, to minimise the losses and maximise the profits. Like below.
1. Go long only if price is above 189 days EMA/SAM
2. Exit position when high or low of previous candle is breached in the opposite direction of the trend.
3. Go long only if price is in up trend on higher time frame charts and go short when price is down trend of higher time frame charts.
Stop loss, target and other things can also be decided by the trader.
Idea is to capture the short term trend to trade in FnO or 2/3 days position in underlying instrument.
Traders can optimise the length of the Moving average so that your traded is set for maximum profit giving settings for this strategy. Different instruments responds to different moving averages because of different volatility.
Idea is to go long when price closes above 9 days EMA of Highs and exit and go short whenever price closes below 9 days EMA of lows, exit short when first condition meets after short trade.
I ma not that good with scripts, have many such ideas, interested script writers can get in touch with me so that we can create trading systems which have grater success rate .

Cowabunga System from babypips.comPlease do read the information below as well, especially if you are new to Forex.
The Cowabunga System is a type of Mechanical Trading System that filters trades based on the trend of the 4 hour chart with EMAs and some other familiar indicators (RSI, Stochastics and MACD) while entering trades base on 15 minute chart.
I have coded (quite amateurishly) the basic system onto a 15 minute chart (the 4 hour settings are coded as well). The author says the system is to be traded off the 15 minute chart with the 4 hour chart only as a reference for trend direction.
4 Hour Chart Settings
5 EMA
10 EMA
Stochastics (10,3,3)
RSI (9)
Then we move onto the 15 minute chart, where he gives us the trade entry rules.
15 Minute Chart Settings
5 EMA
10 EMA
Stochastics (10,3,3)
RSI (9)
MACD (12,26,9)
Entry Rules - long entry rules used, obviously reverse these for shorting.
1. EMA must cross above the 10 EMA.
2. RSI must be greater than 50 and not overbought.
3. Stochastic must be headed up and not be in overbought territory.
4. MACD histogram must go from negative to positive OR be negative and start to increase in value.
What I did.
1. Set the RSI and Stochastic levels to avoid entries when they indicate overbought conditions for long and oversold conditions for short (80 and 20 levels).
2. Users can input specific times they want to backtest.
3. User's can configure profit targets, trailing stops and stops. Default is set it to was 100 pips profit target with a 40 pip trailing stop. (Note, when you are changing these values, please note that each pip is worth 10, so 100 pips is entered as 1000.)
The Cowabunga System from babypips.com is another popular and active system. The author, Pip Surfer, continues to post wins and losses with this system. It shows there is a lot of honesty and integrity with this system if the author keeps up to date even 10 years later and is not afraid of sharing the times the system causes losses.
As an example of this, here is post he shared just last week . It's almost like a journal, he gives specific times and reasons why he entered, lets the readers know when he was stopped out, etc. I think that what he does is equally important as his system.
To read more about this system, visit the thread on babypips.com, click here.

SMART4TRADER-UP-DOWN Stock Exchange Volume (SPY)Shows the trend direction for the S&P500
Показывает направление тренда для S&P500

EUSDwaveV2 [pietherrieck]another version of my highly efficient strategy for the d1 eur/usd chart. i don't recommend to use it on other currencies/timeframes!

EUSDwave [pietherrieck]this is a highly efficient strategy for the d1 eur/usd chart. i don't recommend to use it on other currencies/timeframes!


HL2 - 22 EMA Cross for RenkoEURUSD
This is a simple strategy to use for those who like Renko bars. I ONLY use it on Renko.
Basic idea is that when the Renko bar closes above or below the 22 EMA, you go long or short.
However, some of the frustrations I've had with any strategy shared in Tradingview is so few folks put in the ability to set a stop or a profit target or the ability to set a specific time to trade. I have added those to this strategy. (And I for the life of me can not remember where I got the code for the the time, I need to find you!).
Special note: If you have never used the Renko bars in Tradingview, make sure you click the Format option next to whatever pair you are looking at and change it from Traditional to ATR. You can set it for a static pip amount if you want. But ATR at first will help you decide which amount of pips you should throw in.
This is my first published strategy so if I screwed up on anything or didn't explain it very well, please let me know!!

EUSDwaveV2 [pietherrieck]new version of my highly efficient strategy for the d1 eur/usd chart. i don't recommend to use it on other currencies/timeframes! if you want to use it contact me!
