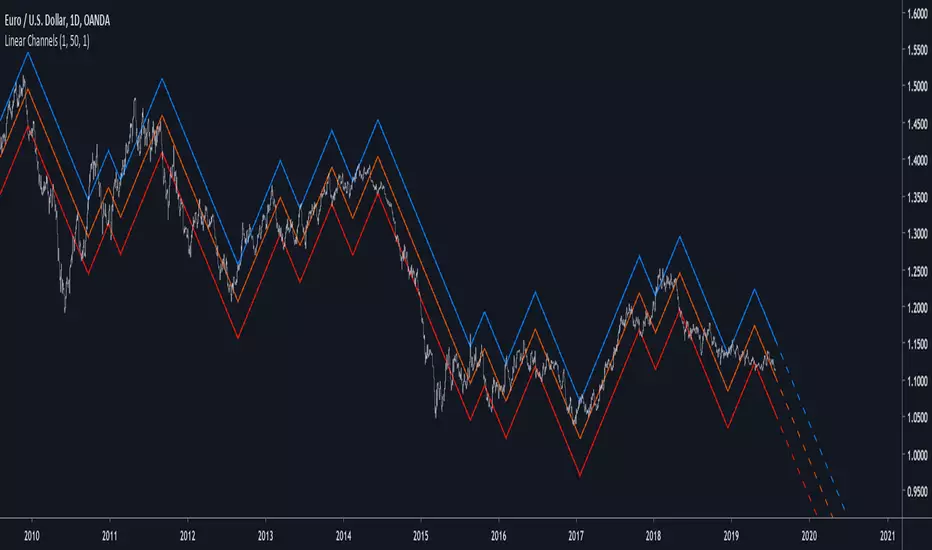
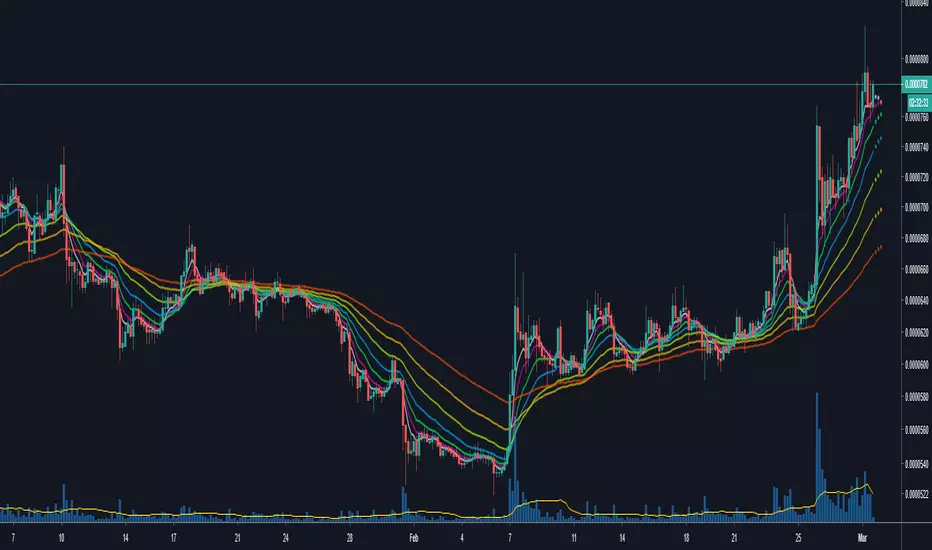
Linear ChannelsIntroduction
I already made an indicator (simple line) that tried to make lines on price such that the results would not repaint and give a good fit to the price, today i publish a channels indicator based on the simple line indicator. The indicator aim to show possible support and resistance levels when the central line posses a low sum of squares with the price, a linear extrapolation was also provided in order to show possible future price positions respective to the channels.
The Indicator
The emphasis parameter of the simple line indicator has been removed, instead we keep length and mult as numerical input parameters. In general length control how persistent the lines are, larger values will create longer lines on average, mult help make the line fit to the price better but might as well affect how spread the channels are as well as the lines average length. When mult > length the lines will fit better the price while when length >= mult the fit might not be the best.
The point parameter allow you to fix the indicator when using it on high market price values or when the indicator exhibit a weird behaviour.
point = false on btcusd
point = true
If the lines still does not fit well enough try to lower length.
I know this might result inconvenient in so many ways but i'am working on simplifying things. Therefore some larger price values might use lower length and use mult instead. For market not using the point parameters a settings of : length > 1 and mult = length*2 might provide a good to go setup.
The channel spreading parameter allow to make spread the channels by a certain factor.
Issues
I'am still not good with line extensions, if it bother you deactivate the extrapolation parameter. Sorry for the inconvenience.
Conclusion
It is possible to make non repainting linear indicators, and i'am working on some of them. While some might argue that price is not linear thus not requiring the use of linear indicators it can still be interesting to use those if they, unlike the linear regression, don't repaints and provide a way to change their directions according to the price trend.
Thanks for reading !
Forecast
SMA collector MTF ForecastHello everyone
Here's the today indicator
That one is a true gift before X-mas. X-mas in July which bundles a lot more than what Santa Claus will offer you in December :)
So without further due, let's dive right in
This indicator will display the following algorithmic SMA :
SMA 20 Daily
SMA 50 Daily
SMA 50 Daily
SMA 100 Daily
SMA 200 Daily
SMA 20 Weekly
SMA 50 Weekly
SMA 100 Weekly
SMA 200 Weekly
SMA 7 Monthly
SMA 20 Monthly
SMA 50 Monthly
Those SMA usually work as big supports/resistances for all tradable assets (forex, index, crypto, stocks, ...)
That's it for the first feature, let's cover the next one
2/ I developped a small optimization to get those labels placed on the right hand side of your screen.
"Is it really useful sir ?" Well, you certainly noticed that looking at a chart on tradingview mobile is not ideal (indicators overlapping, indicator names taking too much space and so on...)
When you'll deactivate the indicator name label display from tradingview, you can activate mine which will look way nicer on your mobile (and even Desktop).
This concept was greatly inspired by @scarf :
3/ Now the cherry on the top of the cherry on the top of the.... cake
You'll have the cool option to display the forecasts for those SMAs based on either current price "flat" or a 3 period liner regressions "linreg".
You can play out with the forecasts options and find out which ones will make the most of sense to you
They're represented by small dots at the very right of the moving averages
This concept was greatly inspired by @yatrader2 :
That's a lot to digest but hope it went smoothly
As always if you have any question or feedback or complain or you want to show me some love (please), shoot it in the comments section
See y'all tomorrow for another indicator
Enjoy
Dave


SMA Stochastic ForecastThis tool uses a discrete-time non-Markovian Martingale stochastic process (Please do not confuse with the strategy of the same name) under the hood to forecast a future (up to 28 bars, customizable) behaviour of the Simple Moving Average. The longer the average period, the more accurate the forecast.
The common cases are the next:
You can apply two instances of this indicator to your chart to obtain a crossover forecast
You can decrease an interval between forecasts to obtain a bunch of possible traectories
Decreasing a forecast interval for two instances, you will get the Kraken
This is the further improvement of my research work on forecasting
Mr. @syrinxflunki was the only one who provided a clear and useful feedback after testing, so he get a free lifetime access. I respect a fair play.
If you have any questions you can concat me via private messages.
Good luck.

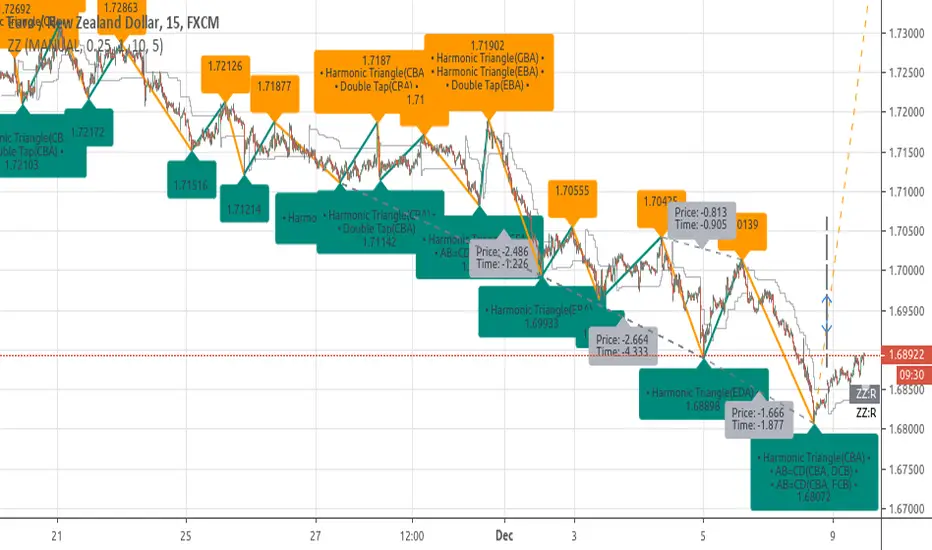
[RS]ZigZag Percent Reversal - Forecast - patterns - labels description:
• Zig Zag indicator plots points on the chart whenever prices reverse
by a percentage greater than a pre-chosen variable.
• Forecasts area based on zigzag statistics.
• Displays labels with detected patterns.
• Displays slope information rate of price, time diferentials and angle(experimental)
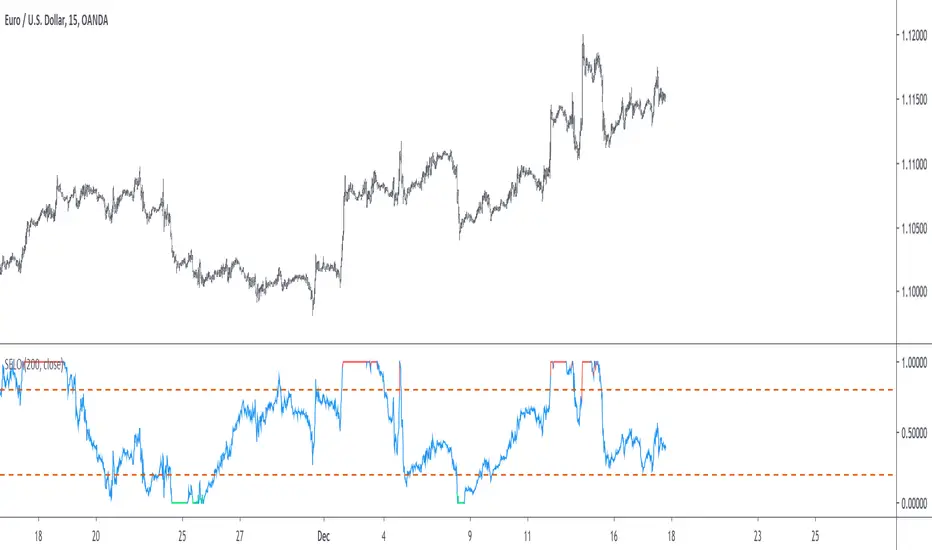
Stationary Extrapolated Levels OscillatorIntroduction
The oscillator version of the stationary extrapolated levels indicator. The methodology behind the extrapolated levels where to minimize the risk of making a decision based only on a forecast, therefore the indicator plotted levels in order to determine possible reversal points, signals where generated when the detrended series crossed over/under those levels.
The Indicator
First we detrend the price, this is because forecasting the trend is often harder than a series without trend (stationarity > non-stationarity) , then we forecast the detrended price with a linear extrapolation over a period of length and apply a max/min filter twice to the forecast, the max/min filters are just the highest and lowest function in pine. So the max/min filter have lag length/2 , by applying it two times we have a lag of length which is the period of the forecast. Because we use highest and lowest we can apply min-max normalization in the form of :
x' = (x - min(x, min'))/(max(x,max') - min(x, min'))
where x is the detrended price, max' the highest of the forecast of x and min' the lowest of the forecast of x . This result in a scaled oscillator in a range of (1,0),
When the indicator is equal to 1 or 0 there are high chances of reversals, more in depth this mean that the detrended price have crossed the highest/lowest of the forecast, when the indicator is equal to 0 or 1 for a long time this mean that the forecast was quite inaccurate, you can minimize risk by focusing on the cross between the detrended price and the 0.8/0.2 levels.
Conclusion
I've shown an oscillator version of my previous "Stationary extrapolated levels" indicator, the method involving taking the highest and lowest of the forecast is a great way to minimize the risk involved by time-series forecasting driven decisions. So i hope you find an use to it.
Thanks for reading !
Displaced Moving Average by Atilla YurtsevenPlease visit www.investopedia.com for more information about Displaced Moving Average.
You can choose your favorite moving average from the list: "SMA, EMA, WMA, RMA, VWMA, VWAP, Linear or Rank"
I have also added 3rd DMA which can be disabled.
I urge you to use the Forecast mode. But feel free to find the best that fits your needs.
FYI: This is not financial advice.
Trade safe,
Atilla Yurtseven

Morphed Sine WaveIntroduction
If you rescale a sine wave to the price you will need to correlate it with it in order to show good results, today i present a different method that does not involve correlation to "morph" a sine wave to the price in order to provide forecast's and highlight market periodic patterns.
Parameters
length control the period of the sine wave, power control the "morphing" amount, if you see for example that the results are going nuts try to increase power , if the results are just the price and the delayed price try to decrease power .
power = 1
power = 100
Those settings might be different depending on which market you are in.
Various Uses
You can do a lot of things with this indicator, use filters as source :
Use the indicator as source for oscillators in order to create cycles indicators :
And certainly many more things
Conclusion
I presented a way to morph a sine wave to the price i order to highlight cycles. You can use any function that return a value between -1 and 1 instead of sin , this can be a scaled rsi/stochastic or correlation coefficient, its up to you :)
If you need help don't hesitate to commend or pm me. I hope you will like the indicator and that it will inspire you to make great things.
Thanks for reading !

[RS]ZigZag Percent Reversal(Multiple) - Forecast Areasnaive level forecasting of multiple zigzag's
based on this principle:
BB Forecast PrototypeExperiment to try apply @atrader2's MA Forecast () to bollinger bands - didn't exactly work out how I expected it to, especially with the Upper/Lower forecast projections.

Binance MAs ForecastBinance MAs Forecast
From an idea of Bull Of Bitcoin
Coding performed by GM_Hedge_Fund
The study is focused on the forecast of the 7, 25 and 99 MAs.
The MA simulate the ones present on Binance Exchange.
The script:
Plots 7 (grey), 25 (blue) and 99 (purple) MA on the chart in overlay
Plots the possible continuation of the 7 (grey), 25 (blue) and 99 (purple) MA on the chart in overlay for 6 further candles after the current one
The script is meant to be used in the following timeframes:
1H = for day-trading, gives 6H forecast
4H = for swing-trading in short periods of time, gives 24H forecast
1D = for weekly forecast and trend analysis, gives 6D forecast
Disclaimers
The tool is a Forecast which means is NOT the reality and it can be wrong.
The algorithm is dynamic: it changes the plot of the forecast at every candle. Monitor your position even after a clear signal by the indicator.
Suggestions
I strongly recommend to use proper stops and take profits orders.
Suggestions:
The script is meant to be displayed on a naked chart (no other indicators) with light background to facilitate the reading.
---------------------------------------------------------------------------------------------------------------------------------------------
Please consider to support BullOfBitcoin by joining his Telegram, Twitter.
His precious idea lead to the creation of this indicator.
Consider also to support me by following my TradingView account and Twitter.
For Donations:
3PkC2iqwP37vbAUsMNSQZpaDA711HNQhyY BTC
0xB78056Cc5E87b6FD4D8A62852ae630AC92aBAcce ETH

Moving Averages & Bollinger Bands with ForecastsMoving Averages & Bollinger Bands with Forecasts
11 Moving Averages
SMA, EMA, WMA
Highly Customizable
Linear Regression Forecast
Bollonger Bands
Personal Setup: Add indicator twice
1st indicator = SMA using #4, 7, 10, 11 (20, 50, 100, 200 SMAs) with bollonger bands on 20.
2nd indicator = EMA using #1, 2, 3, 5, 6, 8, 9 (5, 8, 13, 21 ,34, 55, 89 EMAs).
This allows easy toggling between SMAs/Bolls and Fib EMAs
Thank you to yatrader2 for the forecast code

4Hours-optimized Crypto Alert ReloadedUPDATE:
*Added Pivot Levels for a better market lecture.
Advice, try to filter the early B signals by pivot strength.
Stay tunned!
Meister Shredder - Exponential Moving Averages x4 ForecastShows the 21, 50, 100, 200 Exponential Moving Average + 6 bar forecast

Meister Shredder - Simple Moving Averages x4 ForecastIncludes the 21, 50, 100 and 200 SMA and 6 bar forecast
4EMA ForecastThis script is an upgrade of the existing 3EMA forecast to allow the user to display 4 different EMAs (short, mid, long and very long range) and the forecast for the 5 candles ahead

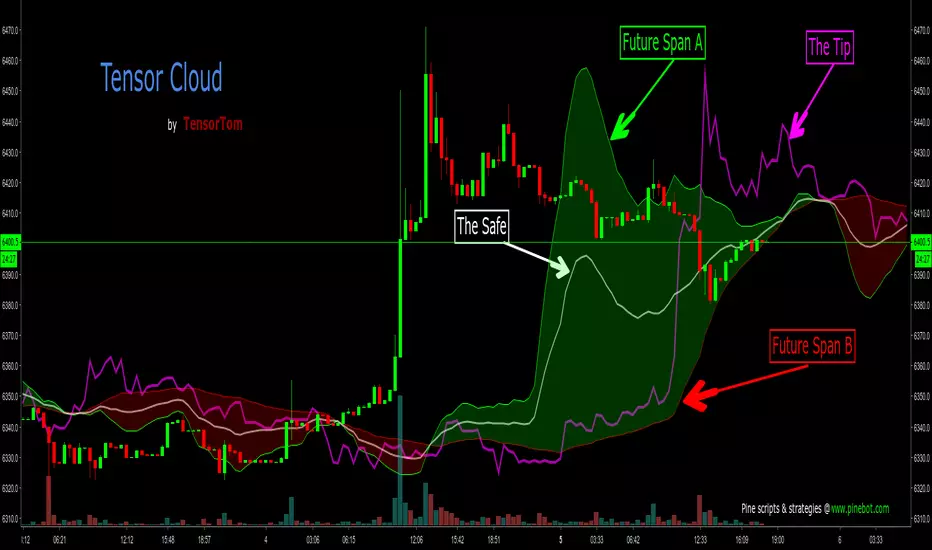
Tensor CloudIntroducing the Tensor Cloud. This is probably the best indicator I've come up with so far. I'm really proud of it. Ichimoku is a brilliant system. It's been around for over half a century and I praise Goichi Hosoda for his brilliant work. However, it's time for something new. I love math and this indicator really showcases that. The Tensor Cloud is an indicator of its own. It is not related to Ichimoku at all. The only thing they have in common is that they both form clouds. The maths in Tensor Cloud are 100% apart.
The Tensor Cloud is mostly comprised of some special forms of linear regression. Let's do a rundown.
Future Span A (Green)
This is one predictor using a linear regression technique. Future Span A is one of the two lines that makes up a Tensor Cloud. From here on out it will traditionally be colored green. It can be used as both a predictor on its own and comprising the Tensor Cloud. This can also be viewed as sort of a long signal when crossing up Future Span B. This line can also be used to help identify levels of support and resistance.
Future Span B (Red)
This is another form of linear regression meant specifically to work alongside Future Span A. This is the second line that comprises a Tensor Cloud. From here on out it will traditionally be colored red. It can be used both as a predictor on its own and comprising the Tensor Cloud. This can also be viewed as sort of a short signal when crossing down through Future Span A. This line can also be used to help identify levels of support and resistance.
Safe (White)
The Safe is a moving average taken of Future Span A and Future Span B. It is highly predictive. From here on out it will traditionally be colored white.
Tip (Fuchsia)
This is yet another form of regression and is highly predictive. The Tip can also be used to help judge trend strength and probability of reversal. More study is of course needed. More on that later in this description. From here on out it will traditionally be colored fuchsia. This line can also be used to help identify levels of support and resistance.
The Tensor Cloud
The space between Future Span A and Future Span B is shaded in green or red, depending on which Future Span is on top. If Future Span A is on top, the Tensor Cloud will be green. This is considered a long signal. If Future Span B is on top, the Tensor Cloud will be colored red. This is a short signal. Attention should also be given to other factors such as:
The position of price in relation to the Tensor Cloud (Under, inside or above).
The position of Tip in relation to the Tensor Cloud.
Crosses of Future Span A and Future Span B.
Tensor Twist
Whenever Future Span A and Future Span B cross (In either direction), this is called a Tensor Twist. If Future Span A is crossing up, this is a long Tensor Twist. If Future Span B is crossing up, this is a short Tensor Twist.
Closing Summary
Much study needs to be done. This is a brand new technique. It's up to all of you to help figure out the best ways to use it. I may still add other components to this indicator but it's pretty solid as is. You will notice that the two integer inputs are set to 27. Twenty-seven is a very important number in mathematics. The details of that are beyond the scope of this description but from here on out, the traditional setting for those will be 27. You will notice that I am not yet releasing the source code to this indicator. For now, it will remain protected. Once I have enough feedback and we're all happy with the final result, I will release the code for the world to have. I have no wish of keeping this closed-source (As profitable as that might be). I just want it to help as many people as possible.
Please share this on social media so we can attract as many testers to give feedback as possible. For publishing this for free, that's all I ask in return. That way it will be as solid as possible when I release the source code.
Enjoy!
Seasonality ForecasterThe Seasonaliity Forcaster indicator takes advantage of the seasonality of the price to create a forecast of how the price could go in the coming days.
It is calculated on the DAILY chart that contains about 260 days of market and I recommend using it on that chart.
In the properties under " Style " you can turn on or off the chart of what made the price 1, 2, 3, 4, 5 years ago or the average of the last 5, 7 or 10 years (if there are enough data).
Under " Input " you can decide the offsets of the various charts, or horizontally align the various charts to find the most similar configuration to what the price has done, so as to understand if the price is following the seasonality of a few years in particular, the vertical alignment is a decimal number that allows you to raise or lower the chart in percentage to better align it with the price.
How to use it:
1) under "Properties" --> "Style" deselect all the last years charts and leave just the actual price.
2) select just the last year chart.
3) under input you have the parameters to change to align the last year chart on the actual price chart, the indicator by default show the forecast 100 bars,
align the horizontal offset and the vertical alignment to put the 2 charts together, you have to find the macro trend, not the micro, of the last 5 - 6 months.
4) repeat it with another chart, for example 2 years ago
5) then repeat it with all the charts, if there are no macro trend as the actual price deselect the chart
6) when you find a good overlap look for the candle chart to find a good level to enter.
That's it that's all.

Arbitrage ForecastWith great excitement we are pleased to announce Arbitrage Forecast.
We have combined the precision of Arbitrage Level with the Accuracy of Arbitrage Loop to create a forecasting tool to help you visually see which way the market is moving.
This is how it works.
First, the light blue lines bind the purple line within the confines of this Forecast Band(99.6% of the time)
This means we show you where the most probable turn around points are located.
Second, that purple line: long as it's below the histagram the forecast is bearish.
Third If both the purple line and the histogram are below the 0 line. RUN FOR YOUR CASH... It's about to get UGLY.
Aggressively playing this indicator you can exit your long position as soon as the purple line pierces the histogram area
And for those who demand confirmations letting the histogram turn red by falling below the black 0 line will confirm a new down trend has started
Lastly for those aggressive bulls, letting the purple line pierce a red cloud from below signals a bullish trend but again the confirmation of the trend will
be both the purple line being above the black 0 line and the histogram turning back green.
Stop guessing, Start Profiting
Arbitrage Trade Team
