Bitcoin to $90k - February 2026Remember those dizzy heights seven days ago?
** The weeks ahead, void after May 2026 **
You read correctly, Without-worries has a bullish idea. For most of quarter 4, 2025 it has been a stream of bearish ideas, mostly all falling on deaf ears. Today is a bullish idea. A bullish idea with a time limit.
On the above 2 week chart we can see price action has collapsed 42% (The Answer to the Ultimate Question of Life, the Universe, and Everything) as retail traders provided the necessary exit liquidity to allow legacy holders to exit the market at $126k.
Today sellers continue their enthusiasm for locking in losses by selling into past resistance. Not just any resistance, a resistance that took most of 2024 to break. Folks selling into an obvious area of support test use emotion as their guidance.
Higher highs higher lows. On this timeframe price action continues to be in a bull market until a lower high print AND a break of market structure, that’s a 2 week candle body below $54k
The 0.382 Fibonacci retracement level, where price action is today, is not only a support backtest, but also a Fibonacci level Bitcoin price action has continued to respect throughout most of its history.
Notice the Head & Shoulders pattern? Whether it confirms or not is up to the market, there’ll be clear identifiers which way it should go. Remember, extremes in a market is marked by extremes in volume. If the right shoulder should form with an absence of volume, expect confirmation and continuation to the downside. Either way the right shoulder identifies a date and price when it would be better not to have exposure to the market. Think escape hatch, that’s your moment to jump from this sinking ship and spare yourself another 2025.
Conclusions
Bitcoin remains structurally bullish on the 2-week timeframe. The trend of higher highs and higher lows is still intact, and price is currently reacting at a historically respected confluence: former macro resistance, now support, aligned with the 0.382 Fibonacci retracement. This is not where long-term bull markets typically fail impulsively.
The recent 42% drawdown appears corrective rather than terminal. Capitulation behaviour is coming from late cycle participants selling into support, not from long-term holders distributing into strength. Until a decisive break of market structure occurs, defined as a 2-week candle body close below ~$54k, then the bullish thesis remains valid.
That said, this is a time boxed idea. The developing Head & Shoulders formation provides a clear decision framework. If the right shoulder forms on declining volume, downside continuation becomes the higher-probability outcome, and risk should be reduced aggressively. If the pattern fails, it reinforces the broader bull trend and opens the door for continuation later in 2026. The key takeaway is not blind optimism, but asymmetric positioning:
Support holding + volume confirmation → stay engaged
Right shoulder + volume divergence → use the escape hatch
After May 2026, clarity diminishes. Volatility is expected to increase, structure may degrade, and probabilities flatten. This idea expires there. Not because Bitcoin must fail, but because the edge does. Bullish for now, but be prepared to exit when the market tells us to.
Ww
=========================================================
Disclaimer
Let me be very clear. This is not financial advice. Nobody gives better non-financial advice than me. People say it all the time. Tremendous disclaimers. The best disclaimers.
I’m not telling you to buy Bitcoin. I’m not telling you to sell Bitcoin. I’m just looking at the chart, a beautiful chart by the way, and saying what I see. Very strong lines. Very smart lines. Some people don’t understand the lines. Sad!
If you lose money after reading this, that’s on you. Totally on you. I warned you. Many people warned you. You clicked the button anyway. Not my fault. Not even a little. Markets are brutal. Absolutely brutal. They don’t care about your feelings, your tweets, or your conviction. They will destroy weak hands. I’ve seen it. Terrible. Just terrible.
This is analysis. Entertainment. Maybe education.
But advice? No. Never said that. Didn’t even think it.
What traders are saying

BITCOIN and the powerful Stoch RSI Cycle SignalThe Stoch RSI is a very rarely used indicator, in fact the last time we made use of it on Bitcoin (BTCUSD) was around the bottom of the 2022 Bear Cycle. We bring it forward to you once more as December closed with the 1M Stoch RSI below the 20.00 level. Historically, every time the market did that, BTC's new Bear Cycle had already started but it was still in its beginning.
You can see that during the majority of each Bear Cycle, the 1M Stoch RSI settled sideways below the 20.00 mark and when it broke back above it, the new Bull Cycle had already started. The time distance between those signals during the last two Cycles has been just over 1 year (13 months, 396 days). This suggests that by January 2027, BTC's new Bull Cycle will already have started most likely.
As to a potential bottom? The strongest candidate is the 3W MA100 (red trend-line), which has been hit during all previous three Cycles. That is currently around $53000 and rising, so we expect BTC to hit at least this level before a Bear Cycle bottom around October 2026. Additionally, the Mayer Multiple Bands (MMBs) green Zone, offers a Buy Zone, which priced the November 2022 bottom.
So what do you think? Is this Stoch RSI signal useful in your long-term positioning? Feel free to let us know in the comments section below!
---
** Please LIKE 👍, FOLLOW ✅, SHARE 🙌 and COMMENT ✍ if you enjoy this idea! Also share your ideas and charts in the comments section below! This is best way to keep it relevant, support us, keep the content here free and allow the idea to reach as many people as possible. **
---
💸💸💸💸💸💸
👇 👇 👇 👇 👇 👇

Stop Dreamig, Start Trading!I’ve talked quite a lot about the illusions in crypto. I’ve made fun of the arrival of altcoin season, and even about 3 weeks ago I wrote an article saying that if I want, I can see any chart bullish, even if I flip it upside down 🙂
It’s Sunday, I’m scrolling aimlessly on the internet and I keep seeing the same thing again, something that repeats like the voice of an alcoholic saying he’ll quit drinking again starting Monday.
Altcoin season is coming again.
These prices will never be found again.
BTC has hit the bottom again — a bottom that was also at 100k where it was the opportunity of a lifetime, at 90k it was an unbelievable bargain.
Again.
Again, and...
Again...
The idea is simple: I also had a 75k target, it went to 60k… I didn’t know. The one who said 60k didn’t know either. And nobody knows if it goes to 50, to 30, or to 250k by the end of the year.
That’s basically the idea.
No grand conclusions.
Just reality.
A Simple Advice
If I were to give one clear and simple piece of advice:
- Stop dreaming, start trading.
- Start learning technical analysis
- Start using money management
Not because TA predicts the future like a crystal ball, but because it gives structure.
Not because money management is exciting, but because it keeps you alive.
A Funny Story From Last Night (But Also Not Funny)
Funny story from last night — and I swear it’s real.
Last night I was out with a friend in the Old Town in Bucharest. We were celebrating… well, celebrating his sports betting ticket that hit with odds of 486. In crypto language: a 486x.
He does this every weekend — places a few tickets, about 100 RON each (around 20 EUR). Most lose, one hits once in a while, this one hit BIG.🙂
What’s truly funny is the contrast.
The same friend bought a crypto coin at the top in 2021. Since then, he’s been DCA-ing into what is objectively a garbage coin. Yesterday I even asked him about it and he told me he’s about 60k in the hole.
60k...for a guy that is not rich at all...
The irony writes itself.
Investing vs. Calling It Investing
The reality is he believes he’s an investor.
But he doesn’t know how to draw a trendline.
I’m more than convinced the first time he ever looked at his coin’s chart was when I tried to analyze it for him about two years ago.
He bought because of an influencer’s story.
Now he keeps DCA-ing endlessly, with the desperate hope that one day he’ll recover.
That’s not investing.
That’s anchoring to a mistake.
And psychologically, it’s not that different from betting slips — just slower and dressed in nicer words.
The Lesson Hidden in Plain Sight
There’s actually a lesson in the contrast:
With sports betting, he knows it’s gambling.
With crypto, he believes it’s investing.
But behavior matters more than labels.
If decisions are based on:
- influencers
- hope
- blind DCA
- refusal to reassess
Then the difference between gambling and investing/trading becomes very thin, if any.
The Market Owes Nobody a Recovery
Markets don’t care where you bought.
They don’t owe you a comeback.
They don’t reward loyalty.
Sometimes a bad asset stays bad forever.
Sometimes a narrative never returns.
Sometimes the “cycle comeback” is just a story people tell to cope.
Harsh? Maybe.
But expensive lessons are usually the honest ones.
The Real Shift
At some point, every trader faces a choice:
Treat the market like a place for dreams
or
Treat it like a place for decisions.
Dreams feel better.
Decisions work better.
Final Thought
You don’t need to predict bottoms.
You don’t need 100x stories.
You don’t need altcoin seasons to save you.
You need structure.
You need risk control.
You need honesty with yourself.
Stop dreaming.
Start trading.
Have a nice Sunday!
Mihai Iacob

BTC Liquidity Probe and then Liquidity Harvest laterIn the above chart, I am trying to show that the selling pressure that drove price sharply to $60,000 was engineered by market makers to test the depth of liquidity and grab some liquidity in the process. The fact that after buy orders were triggered at the support zone of $60,000 but there was no immediate follow through but a choppy and sideways price action suggests that 'they' have unfinished business below $60k. The price action we are seeing is the next step of their manipulation, it's designed to induce more buyers who will be sacrificed soon with panic selling. We need to understand that Bitcoin is getting scarce and market makers must build inventory and liquidity and this is how they are engineering it step by step.
The second liquidity sweep where the real liquidity sits around $48k to $54k is where clustered stop loss orders will be triggered along with panic sellers and margin liquidations. This is the target area for their intermediate accumulation, from about this level will there be a healthy bounce to about $80k.
Guys this is the liquidity atlas map I am looking at currently.
I hope this weekends analysis is helpful to your own due diligence.
Thank you as always for reading and listening to my publications.
Cheers my fellow traders.

BITCOIN: One Last Drop And Then On The Way $200,000Dear Traders,
In our previous analysis, we predicted a price drop from 100k to 60k through multiple analyses. This prediction has come true as the price is currently plummeting sharply. We believe the price will likely fall between 63k and 58k, which would be ideal for swing buyers and a potential high volume zone.
We anticipate a final drop before the price reverses and potentially reaches a record high. Our initial targets are $100k, $150k and ultimately $200k. This is likely to be a significant reversal.
Please like and comment for more updates. Also, follow us for the latest news.
Team Setupsfx_

BTCUSD Heavy Dump → Buyers Step In at SupportBitcoin (BTCUSD) has experienced a strong bearish impulse, breaking multiple intraday supports and printing lower lows. After this aggressive sell-off, price is now showing signs of short-term stabilization near a key demand zone, where buyers are attempting to step in.
The current structure suggests a potential corrective rebound if price holds above the recent low. A higher low formation could open the door for a short-term recovery toward the next resistance zone. However, overall momentum remains bearish, and any upside move should be treated as a pullback unless a clear structure break occurs.
📌 Key Levels to Watch:
– Demand zone reaction
– Higher low confirmation
– Break above short-term resistance for trend shift
⚠️ This analysis is for educational purposes only. Not financial advice. Always manage risk properly.

Is Bitcoin Really Rising — or Just an Exit Rally?If we set emotions aside and look at the market through a pure trend-following lens , BTCUSD is currently in a state of “a rebound within a broader downtrend” rather than a genuine recovery. The recent price bounces are largely driven by short-covering after panic selling, not by a clear return of strong institutional capital. With market sentiment still cautious, every rally risks turning into an opportunity for distribution.
From a structural perspective, Bitcoin has completely broken its previous bullish base and has entered a clearly defined descending channel on H4. Price remains trapped below the Ichimoku cloud, signaling that the dominant trend has not changed. The bounce from the lows has only produced a lower high, confirming that buyers currently lack the strength to regain control.
The 71,000–71,300 zone stands out as a critical price ceiling. This area is a confluence of the descending trendline and key technical resistance , where selling pressure is highly likely to emerge. If Bitcoin reaches this zone but fails to secure a decisive candle close above it , the probability strongly favors a renewed move to the downside.
In that scenario, the 62,800–63,000 region becomes a logical target for the next bearish leg —aligned with both technical structure and the risk-averse sentiment still dominating the crypto market. At this stage, fighting the trend by trying to catch a bottom carries significant risk , while selling into rallies remains the more disciplined strategy given the current market picture.

BTCUSD · 30M – Liquidity Sweep → Bullish RecoveryBITSTAMP:BTCUSD
BTC swept sell-side liquidity aggressively, forcing stops and triggering panic selling. After the sweep, buyers stepped in strongly, reclaiming key structure and printing a bullish break. The recovery shows acceptance above demand, suggesting a corrective bullish move toward higher resistance zones within the broader range.
Key Scenarios
✅ Bullish Case 🚀 → 🎯 Target 1: 71,000 → 🎯 Target 2: 75,000
❌ Bearish Case 📉 → Loss of the BOS/demand zone may lead to a revisit of liquidity lows.
Current Levels to Watch
Resistance 🔴: 71,000 – 75,000
Support 🟢: 65,800 – 66,300
⚠️ Disclaimer: This analysis is for educational and informational purposes only. It is not financial advice. Please conduct your own research before trading.

BTC: Is This the Bottom or Just the First Reaction?After the sharp BTC sell-off, the big question is obvious:
was this the bottom or just the first move?
Here’s my current read on BTC after the recent sell-off.
There are a few realistic scenarios worth considering.
Scenario 1: Black swan, not a bear market
This move could be driven by a black swan–type event rather than a true cycle shift.
In that case:
* the sell-off is reactive
* structure damage is temporary
* price may recover faster than expected once uncertainty fades
This would explain the violence of the move without requiring a full bear market thesis.
Scenario 2: Bear markets rarely end with a V-shape
Historically, bear markets almost never bottom with a clean V-shaped recovery.
If this is the start of a broader bearish phase:
* immediate upside would be suspicious
* fast recoveries tend to fail
* patience becomes more important than prediction
Sharp bounces can happen but they don’t automatically mean “bottom in”.
Scenario 3: Range before resolution
More often than not, markets need time.
A common pattern after major sell-offs:
* strong initial bounce
* followed by weeks or months of sideways range
* then a clearer directional move
This range phase is where sentiment resets and real positioning happens.
Takeaway
Right now, it’s less about calling the bottom and more about watching how price behaves after the bounce.
Does BTC:
* reclaim structure quickly?
* fail and range?
* or break down again?
The answer won’t come from one candle it will come from time.
Another important technical detail is that BTC recently rejected from the Weekly 200 Moving Average. Historically, this level acts as a key cycle filter.
In past bear markets, BTC has typically traded below the 200 MA for a period of time before a durable bottom was formed.
Because of that, I wouldn’t be surprised to see price dip below the Weekly 200 MA as part of a bottoming process. That kind of move wouldn’t signal weakness by itself, it would more likely confirm a bear-market bottom structure rather than invalidate the asset.
Curious to hear your take:
bottom in, or more chop ahead? 👇

Bitcoin Back Above $70,000. Here Are Key Levels to Watch NowA trip to $60,000 and back before coffee.
Bitcoin BITSTAMP:BTCUSD spent the end of last week doing what it does best: reminding traders that fire-breathing dragons aren’t in fairytales only.
After a sharp drop to $60,033 on Thursday torched thousands of long positions, the world’s largest cryptocurrency bounced hard. By Friday, it had clawed its way back above $70,000. Still, that dip was the orange coin’s lowest level since October 2024 and roughly 52% below last year’s record of $126,000 .
By Monday morning, Bitcoin looked almost calm. It hovered around $70,700, barely changed on the day. The contrast with last week’s price action felt dramatic. Bitcoin rarely travels in straight lines, and this was another reminder.
🤔 Buy the Dip or Declare It Gone?
As always, opinions split fast. Some traders rushed to declare Bitcoin’s demise (for the 463th time – there’s a website for that ). Others quietly loaded up, calling the move a classic paper-hands shakeout.
Markets, by nature, lean optimistic. The real question is whether optimism has enough fuel to pull Bitcoin out of its recent slump and into a renewed upside phase. The bounce has been impressive, an 18% upswing, but conviction remains fragile.
🌪️ Volatility Is a Feature, Not a Bug
Extreme volatility comes with the territory. Bitcoin’s slide from a $126,000 peak in October arrived despite a crypto-friendly White House and accelerating institutional adoption.
For some investors, that raised uncomfortable questions about Bitcoin’s role during periods of geopolitical stress.
Digital gold? Perhaps. Perfect hedge? That debate remains open.
🧊 The Market Finds Its Feet, Carefully
The broader crypto market has stabilized, though nerves remain close to the surface and Bitcoin still commands the lion’s share, according to the dominance chart . Traders describe the tone as cautious rather than confident. Or every analyst’s favorite expression: cautious optimism.
One level stands out on everyone’s chart. The $60,000 threshold has emerged as the primary near-term support. It marked the floor of last week’s selloff and remains the line bulls prefer not to revisit anytime soon.
On the upside, $75,000 carries symbolic weight. A sustained break above that zone would strengthen the case that the worst of the bear phase has passed and that buyers are regaining control.
📈 Institutions Quietly Step Back In
While price action grabbed headlines, flows told a quieter story. US Bitcoin exchange-traded funds recorded $221 million in inflows on February 6, suggesting that some investors viewed the selloff as an opportunity rather than a warning sign.
Institutional participation tends to move slowly and deliberately. These flows do not guarantee higher prices, but they add some confidence during moments of stress. For a market built on confidence, that matters.
🧮 The Levels That Matter Now
If Bitcoin is serious about $70,000, attention turns to a handful of technical levels that traders are watching closely.
But before that, let’s talk about the 200-week moving average near $58,000, a level Bitcoin respected during the recent dip. Holding above it keeps the longer-term structure intact.
Next sits the $73,000 to $75,000 zone, an area packed with prior support and resistance. Clearing it convincingly would signal momentum shifting back toward the bulls.
Beyond that, the path opens toward $81,000, a level that could act as the next magnet if sentiment continues to improve.
Again, that is if the OG coin manages to reel itself out of the sub-$70,000 area. The bounce from $60,000 reminded traders that sharp selloffs often attract bargain hunters and dip scoopers.
Off to you : So where do you stand right now? Are you holding your Bitcoin, exploring alternatives, or watching from the sidelines? Share how you are navigating this market in the comments.

Bitcoin - The beginning of the bottom🚀Bitcoin ( CRYPTO:BTCUSD ) just ended its bearmarket:
🔎Analysis summary:
Over the past couple of months, Bitcoin has been dropping about -50%. But with today's retest of the major confluence of support, we are already seeing some first rejection. It all just comes down to Bitcoin creating bullish confirmation at this major reversal area.
📝Levels to watch:
$60,000
SwingTraderPhil
SwingTrading.Simplified. | Investing.Simplified. | #LONGTERMVISION

Elise |BTCUSD · 30M – Corrective Pullback → Bullish ContinuationBITSTAMP:BTCUSD
Bitcoin completed a deep sell-off and swept liquidity below previous lows, trapping late sellers. Price then recovered impulsively and formed a corrective rising channel. After rejecting channel highs, BTC pulled back into demand, where buyers are reacting again. As long as this support holds, the structure favors a continuation move toward higher resistance levels.
Key Scenarios
✅ Bullish Case 🚀 → 🎯 Target: 74,500 – 75,000
❌ Bearish Case 📉 → Failure to hold the 66,800 support opens the door for another downside continuation.
Current Levels to Watch
Resistance 🔴: 74,500 – 75,000
Support 🟢: 66,800 – 67,200
⚠️ Disclaimer: This analysis is for educational and informational purposes only. It is not financial advice. Please conduct your own research before trading.

BITCOIN hit $60k and is -50% from ATH. Did it crash too soon??Bitcoin (BTCUSD) almost hit the $60000 mark in early session today, which represents a more than -50% crash from its October 2025 $126000 All Time High (ATH).
** Is it happening too soon? **
Given that we haven't even completed 4 months since the ATH, the question that arises is this: Is this crash happening too soon??
Short answer: YES. And the reason is simple and has to do with the market's macro technicals. Today's $60k Low isn't just a -50% drop from the ATH but it is also taking place extremely close to its 1W MA200 (orange trend-line), while the 1W RSI turned oversold (below 30.00). All this just the second week after losing the 1W MA100 (green trend-line), which has been holding as the Support in almost the past 3 months of the 1W MA50 - 1W MA100 consolidation Rectangle.
** The 1W MA200 and oversold RSI **
That consolidation Rectangle has always served as the pattern that transitioned BTC from its early to the final stage of its Bear Cycle. However this is the soonest occasion historically that Bitcoin reaches its 1W MA200 from an ATH. On the 2014 Bear Cycle it took 59 weeks to do so, on the 2018 Bear Cycle 51 weeks (both were Cycle bottoms), on the 2022 Cycle almost half the time, 31 weeks not a Cycle bottom) and now we are 'just' 17 weeks (119 days) after. Needless to say, it is also the soonest it hit an oversold 1W RSI state, something that has historically coincided with a 1W MA200 test, so that's consistent.
** So what now? **
So what does this historically earliest crash mean for us today? Well most likely that we still have a long way to go. Given this aggressive drop, the market should continue to test at least the 1W MA350 (red trend-line), which is where the previous Bear Cycle bottomed in November 2022 (took almost as much time as the 1W MA50 - 1W MA100 consolidation Rectangle did from he moment the 1W MA200 broke) and we expect that to be around $48000 by May - June 2026.
However, based on the 4-year Cycle Theory, the Bear Cycle bottom should be around late September- October 2026. So practically the bottom could be even lower (potentially the 1W MA500 even as we presented on an analysis last month).
So what do you think? Is the fact that BTC crashed too soon to its 1W MA200 alarming? Feel free to let us know in the comments section below!
---
** Please LIKE 👍, FOLLOW ✅, SHARE 🙌 and COMMENT ✍ if you enjoy this idea! Also share your ideas and charts in the comments section below! This is best way to keep it relevant, support us, keep the content here free and allow the idea to reach as many people as possible. **
---
💸💸💸💸💸💸
👇 👇 👇 👇 👇 👇

Elise | BTCUSD – 30M – Range Recovery StructureBITSTAMP:BTCUSD
After a sharp bearish impulse, BTC formed a base and transitioned into a range-bound corrective phase. Buyers defended demand effectively, but upside continuation remains conditional on holding range support. Current price action suggests accumulation before the next directional move.
Key Scenarios
✅ Bullish Case 🚀 →
If price holds above 76,300 support, a push toward range highs is likely.
🎯 Target 1: 78,800 – 79,200
🎯 Target 2: 79,300 (Range High Liquidity)
❌ Bearish Case 📉 →
Break and close below 76,300 invalidates bullish recovery.
🎯 Downside Target 1: 75,200
🎯 Downside Target 2: 74,900 (Major Demand Zone)
Current Levels to Watch
Resistance 🔴: 78,800 – 79,300
Support 🟢: 76,300 / 75,200 / 74,900
⚠️ Disclaimer: For educational purposes only. Not financial advice.

Bearish Descending Channel with Continuation Setup
This is a BTC/USD 1-hour chart showing a clear downtrend inside a descending channel. Price has been making lower highs and lower lows, respecting the channel boundaries. The Ichimoku Cloud is mostly above price, acting as dynamic resistance, which confirms bearish momentum. A BOS (Break of Structure) is marked, indicating continuation of the bearish move after a pullback into resistance. Price is currently trading near the lower half of the channel, suggesting selling pressure remains strong, with a projected downside target around the lower support zone (near 64k) if the trend continues.

Eliana | BTCUSD – 30M – Intraday Market ConditionBITSTAMP:BTCUSD COINBASE:BTCUSD
After distribution near the 79,000–78,000 resistance range, BTC experienced a strong impulsive sell-off, confirming bearish dominance. The breakdown below 73,000 accelerated momentum toward the 69,000 liquidity pocket. Current bounce appears corrective rather than a trend reversal. As long as price remains below the broken structure and supply zones, overall bias stays bearish, with only intraday pullback opportunities for buyers.
Key Scenarios
❌ Bearish Case 📉 (Primary Bias) →
Rejection below 72,900 – 73,500 keeps sellers in control.
🎯 Target 1: 69,150
🎯 Target 2: 67,800
🎯 Target 3: 66,500
✅ Bullish Case 🚀 (Relief Bounce Only) →
Strong hold above 69,100 demand may trigger a corrective move.
🎯 Target 1: 72,900
🎯 Target 2: 75,000
🎯 Target 3: 76,800
(Bullish move is corrective unless structure flips)
Current Levels to Watch
Resistance 🔴: 72,900 – 76,800
Support 🟢: 69,100 – 67,800
⚠️ Disclaimer: This analysis is for educational purposes only. Not financial advice.

Why the Same Strategy Performs Differently in Crypto and ForexMany traders experience the same frustration. A strategy shows consistency in one market and breaks down in another. The instinctive reaction is to question the rules, indicators, or entries. In most cases, the strategy is not the problem. The environment is.
Crypto and Forex operate under very different structural conditions. Crypto trends tend to expand faster, with sharper volatility and deeper intraday swings. Liquidity is thinner, order books change rapidly, and price frequently overshoots levels before stabilizing. Forex moves more slowly, with deeper liquidity and more controlled reactions, especially during active sessions.
These differences change how a strategy behaves in practice. Stop placement that works well in Forex can be too tight for Crypto, where routine volatility regularly exceeds technical boundaries. Profit targets that feel conservative in Crypto may be unrealistic in Forex, where expansion unfolds more gradually. The logic of the setup remains sound, but the execution parameters no longer match the market.
Time also plays a role. Crypto trades continuously, meaning trends can develop at any hour and extend without the pauses created by session boundaries. Forex activity is concentrated around specific windows, and strategies often perform best when aligned with those periods. Running the same rules outside their optimal timing reduces effectiveness.
Risk sequencing further amplifies these differences. In Crypto, clusters of volatility can create rapid drawdowns even when the strategy remains statistically valid. In Forex, losses are often more evenly distributed, allowing smoother equity curves. Traders who do not adjust position sizing or expectations misinterpret this as inconsistency.
Successful traders adapt execution while preserving logic. Entry criteria, risk models, and trade management evolve to fit the market’s structure. The strategy stays the same. The application changes. Understanding this distinction is what allows traders to remain consistent across asset classes rather than constantly searching for something new.

Wave (2)- Wave (3)
I see two possibilities; Blue or Brown ?
Technical Section:
Wave (2)- Sharp Correction
Common Ratios for Wave 2:
Wave 2 = either 61.8% of Wave 1 or 76.4% of Wave 1
Long Term support levels:
The Blue Path: $ 57655 (once complete the market will reverse ..)
The Brown Path: $ 47986 (Possible and probable (Middle East war))
Wave (3)
Wave 3 = either 1.618 x length of Wave 1
or 2.618 x length of Wave 1
or 4.236 x length of Wave 1
Long Term resistance levels:
1 x length of Wave 1= $ 181000 (always travels beyond the end of wave 1)
1.618 x length of Wave 1= $ 258000
2.618 x length of Wave 1= $ 383000
4.236 x length of Wave 1= $ 584000

BTCUSD CHoCH Signals Trend Reversal Clear structure break + CHoCH on BTCUSD (2H). Based on what you marked, here are clean upside targets:
🎯 BTCUSD Upside Targets (after CHoCH)
Target 1 (TP1):
78,000 – 79,000
Previous supply / structure resistance
First logical profit-taking zone
Target 2 (TP2):
83,500 – 84,500
Higher timeframe resistance
Major liquidity / imbalance area
Strong swing target if bullish momentum continues
Invalidation / Risk Area (for bias)
If BTC loses 65,000 – 64,000, bullish setup weakens and downside continuation becomes likely.
Short & Simple Caption (for your post)
BTC breaks bearish structure and shows CHoCH on 2H, hinting at a potential trend reversal. Price may target higher liquidity zones if bullish momentum holds.

Eliana | BTCUSD · 15M – Range at Resistance | Decision ZoneCOINBASE:BTCUSD BITSTAMP:BTCUSD
After a strong bullish impulse from the 60k liquidity sweep, BTC formed a distribution range near 71.5k resistance. This behavior indicates smart money indecision: either a liquidity grab above range for continuation or a breakdown toward deeper supports if trendline fails.
Key Scenarios
✅ Bullish Case 🚀 →
• Clean breakout and acceptance above range resistance
• 🎯 Target 1: 72,200
• 🎯 Target 2: 73,000
❌ Bearish Case 📉 →
• Rejection from resistance + trendline breakdown
• 🎯 Downside Target 1: 67,800
• 🎯 Downside Target 2: 65,000
• 🎯 Downside Target 3: 60,250
Current Levels to Watch
Resistance 🔴: 71,400 – 71,600
Support 🟢: 70,000 → 67,800
⚠️ Disclaimer: This analysis is for educational purposes only. It is not financial advice.

Below EMA, selling volume remains dominantHello everyone,
Looking at the current structure, the market is sending a fairly straightforward message: the primary trend remains bearish, and there are still no signs that the balance of control has shifted. The sequence of lower highs and lower lows is clearly intact, price is trading entirely below EMA 34 and EMA 89, and both moving averages are sloping downward. For me, that alone is enough to classify the market as bearish and to keep a defensive bias.
In this context, EMA 34 and EMA 89 are no longer acting as support but have turned into very “textbook” dynamic resistance levels. EMA 34 serves as short-term resistance, while EMA 89 caps price on a medium-term basis. What stands out is that nearly every rebound into these EMAs is quickly sold into, showing that sellers are firmly in control of price action. When EMA 34 stays below EMA 89 and the distance between them continues to widen, I consistently view upside moves as pullbacks within a downtrend, not as early reversal signals.
Volume further reinforces this view. Sharp declines are accompanied by a clear expansion in selling volume, reflecting active distribution and position unwinding. In contrast, recent rebounds have come with relatively weak volume, lacking meaningful follow-through from buyers. This is a very typical pattern of distribution within a downtrend, rather than accumulation ahead of a trend change.
From a price perspective, the area around EMA 34 is the nearest resistance, while EMA 89 represents a more attractive trend-aligned sell zone. On the downside, the most recent lows around 74k–75k are acting as temporary support. Only if price can print a clear H4 close back above EMA 89, supported by a convincing increase in buying volume, would I start to reassess the reversal narrative.

Elise | BTCUSD – 30M – Bearish Continuation SetupBITSTAMP:BTCUSD
After the sharp sell-off, BTC attempted a corrective pullback but failed to reclaim the previous breakdown level. The market is now respecting resistance and showing bearish pressure, with sellers maintaining control. As long as price remains below resistance, the structure favors further downside toward the marked demand and liquidity areas.
Key Scenarios
❌ Bearish Case 📉 →
Rejection below 76,800–77,200 keeps bearish momentum active.
🎯 Target 1: 72,800 – 73,200
🎯 Target 2: 69,800 – 70,000 (Major Liquidity Zone)
✅ Bullish Case 🚀 →
A clean breakout and hold above 77,200 would invalidate the bearish setup.
🎯 Upside Target: 78,500 – 79,000
Current Levels to Watch
Resistance 🔴: 76,800 – 77,200
Support 🟢: 73,200 / 70,000
⚠️ Disclaimer: This analysis is for educational purposes only. Not financial advice.

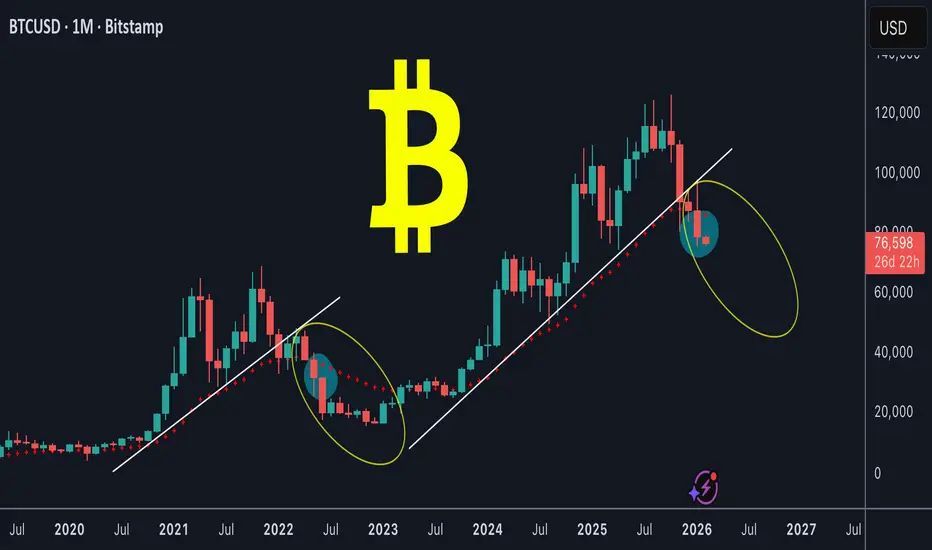
BTC monthly chart is bearishBTC / USD
I've been bearish on Bitcoin for the past 4 months (previous posts are attached below), and today we're seeing the price of Bitcoin continue to decline.
What is the current situation for Bitcoin (monthly chart)?
In short, Bitcoin has broken its upward trendline (white), as well as a very important EMA on the monthly chart (dashed red).
The current situation resembles the end of the bull market at 2022, and you can anticipate what will happen next by looking at my chart
Conclusion:
The current view on HTF is pure bearish