TMO ScalperTMO - (T)rue (M)omentum (O)scillator) MTF Scalper Version
TMO Scalper is a special custom version of the popular TMO Oscillator. Scalper version was designed specifically for the lower time frames (1-5min intraday scalps). This version prints in the signals directly on top of the oscillator only when the higher aggregations are aligned with the current aggregation (the big wheels must be spinning in order for a small wheel to spin). The scalper consist of three MTF TMO oscillators. First one is the one that plot signals (should be the fastest aggregation), second serves as a short term trend gauge (good rule of thumb is to us 2-5x of the chart time frame or the first aggregation). The third one (optional) is shaded in the background & should only serve as a trend gauge for the day (usually higher time frames 30min+).
Time Frames Preffered by Traders:
1. 1m / 5m / 30m - This one is perfect for catching the fastest moves. However, during choppy days the 1min can produce more false signals..
2. 2m / 10m / 30m - Healthy middle, the 2min aggregation nicely smooths out the 1min mess. Short term gauge is turning slowly (10min for a signal to confirm).
3. 3m / 30m / 60m - This TF is awesome for day traders that prefer to take it slow. Obviously, this combination will produce far less signals during the day.
Hope it helps.
Intraday


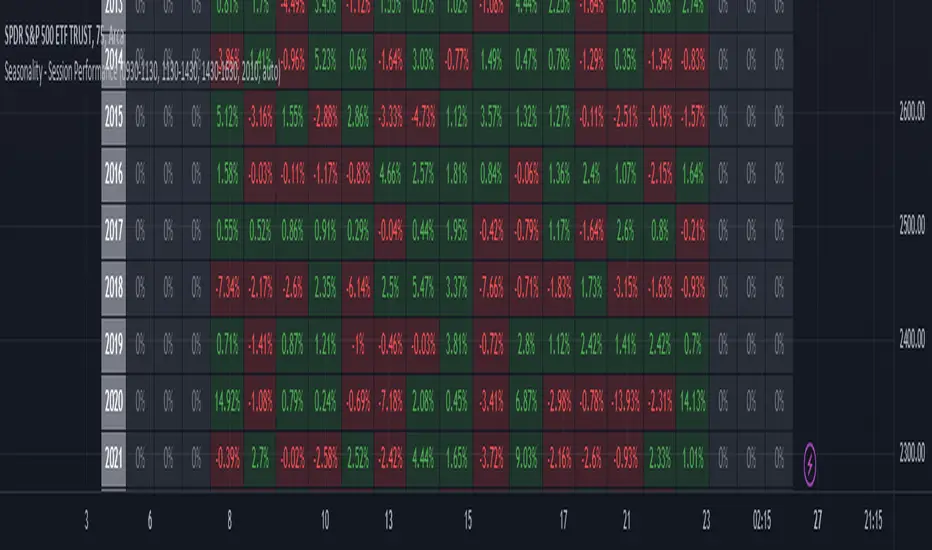
Seasonality - Session Performance - Morning Afternoon EveningUse this indicator on Intraday Timeframe. Higher the timeframe, more the data
This script calculates the performance of an instrument for different sessions.
Session inputs can be updated to study performance of
- Morning vs Afternoon vs Evening
- Pre-Market vs Market vs Post-Market (provided the data feed supports pre and post market)
- Overnight vs Intraday
Three session inputs are provided to tweak the session range
Performance is calculated as session close / session open - 1
Session timeframes can be set for various countries. Make sure the session timeframe aligns with the Candle open/close for the timeframe you choose. Some examples below
US Markets: 0930-1130 1130-1430 1430-1630 Timeframe 1 hour
India Markets: 0915-1030 1030-1415 1415-15:30 Timeframe 75min
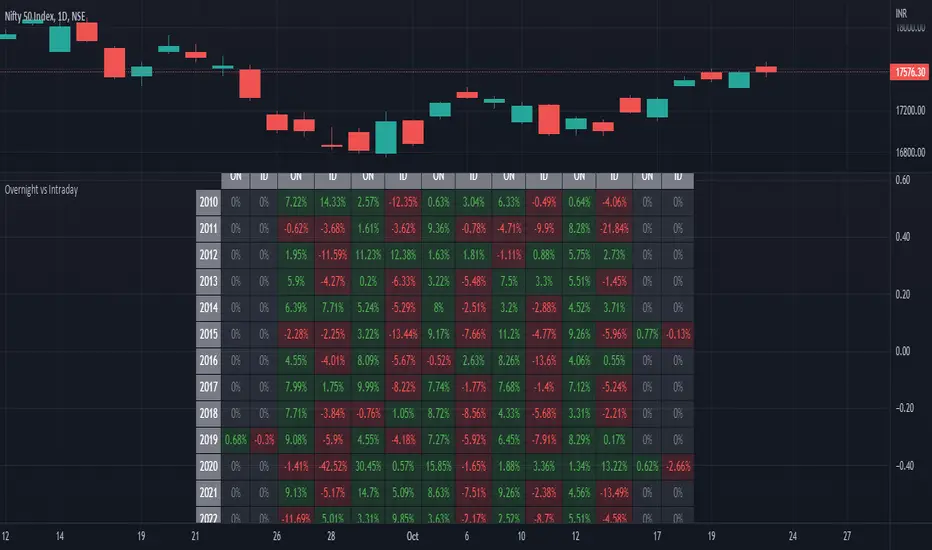
ILM Overnight vs Intraday Performance - Tabular FormUse this indicator on Daily Timeframe
This script compares Overnight vs Intraday Performance based on the Day of the Week (DOW) - Sun - Sat of index/stock/currency/commodity symbols.
ON column indicates Overnight performance = open/close -1
ID column indicates Intraday performance = close-open/1
The calculations are detailed in the tooltips of the individual table cells.
[co.n.g.] ADR 5/10/14/20Average Daily Range (ADR) over 5/10/14/20 Days
What it is
One of the oldest measurements of price volatility that is being used in technical and statistical trading is the range of a specific period of past days to estimate probability of chances, risk and price movements, as seen f.e. in
Molodovsky, N. (1967). Building a Stock Market Measure—A Case Study. Financial Analysts Journal, 23:3, 43-46 , DOI: 10.2469/faj.v23.n3.43.
Problem
After having tried all available community scripts I've encountered various indifferences, especially since Pine v5.
First, the anchor period changed, when I've switched between regular and extended trading hours.
- This meant, that the anchor switched between the official open of the day and the first bar of a new day beginnig at 00:00 UTC (or the corresponding timezone).
Second, thus in some scripts also changed the calculated average range, including or excluding pre market and after hours.
And therefor third, in many cases the distance between open and ADR high/low was indiffferent, putting one closer and the other further away.
Why is that?
After having tried seven different modes of calulation - from ta. to array, it appeared that especially since Pine v5 the calulation is lagging when calling
the request.security function and is thus rendering the calculations indifferent.
Especially the open is lagging and plotting delayed, about 15 minutes on a M1-chart or about 45 minutes on a M15 chart, which made id difficult to spot open (test) drives
- as f.e. described in Dalton, J. F., Jones, E. T., & Dalton, R. B. (1990). Mind over markets: power trading with market generated information. 1st edition . Probus. -
and estimating extremely strong or weak open moves.
While switching between regular and extended intraday charts, the open was either calculated on the open as request of "D" (open of the regular session)
and "1440" (which means full intraday since 00:00 UTC or the corresponding timezone), leading to undesired anchoring.
After having tried about five different anchoring periods and comparing the adr to @TradingView 's stock screener, there was no proper calulation or plotting possible,
if not partially hardcoded (being the least desired, elegant or flexible method).
Visualizing the problem
As described in the picture:
@sherwind 's ADR is plotting entirely wrong! I couldn't even figure out (even the source is available) whre the problem is rooted.
@treypeng 's ADR is anchored properly, but unfortunately the calculation is wrong.
Originality
As evident in the attached picture - and you are able to compare this to @TradingView 's stock screener - in this script as well the ADR is calculated PROPERLY
as well as the anchoring is set PROPERLY within the first tick of the session.
As matter of fact, you don't have to examine different timeframes, charts or sessions simoultaneously to see the correct levels and
you're able to ease observations and focus on your trading.
Innovation
There is no innovative approach, as described above, simply because this statistical approach is around since the 1960's.
Considering coding, neither is, but it is properly calculated and anchored.
What this script does
Anchoring at the first tick of the new New York session
Plotting the actual - not the past nor future - average day range (gray lines in picture)
Plotting the actual - not the past nor future - 75% average day range ( silver lines in picture)
Vizualising ADR breakouts by colouring the backround green (long breakout) or read (short breakout)
Selection methods
Keeping it simple stupid, as of now:
Abiliy to chose between 5/10/14/20 days
Additional
Theory says, that we are staying within the ADR of 75% every day.
_
Alas, there are some exceptions.
If price is breaking out of the ADR, we are likely to move in this direction for the rest of the day.
If price has broken out of the ADR on the previous day, ist highly unlikely to expect another ADR breakout day,
which doesn't mean that there might not appear a strong or weak second day.
Notes
Designed for intraday stock trading of the U.S. market.
Best (and easiest) chances are to be spotted in special conditions.
//Cheers,
//Constantine

NYSE Market Sentiment Oscillator - Intraday w/ alertsThe ULTIMATE market sentiment indicator that combines the sentiments from the MARKET INTERNALS : $ADD ( NYSE $ADV minus $DECL ), $VOLD ( NYSE $UVOL minus $DVOL ) and $TICK ( NYSE Cumulative tick ). Sentiment is based on calculating the crossovers of moving average pairs for each of the market internals. As a result, 3 corresponding signal lines are generated + 1 combined Market Sentiment Oscillator (aka MSO) signal line.
**Important** This indicator is only meant to be used for intraday 1min-5 min timeframe only *** It may not function at higher timeframes without updating some moving average periods.
WHAT IS IT SHOWING?
Each signal lines represents the trend of the 3 market internals (TICK, ADD, VOLD). If signal line is above zero, it is in a bullish trend; below zero, bearish. The oscillating frequency of these lines are dependent on the length of moving average pairs of your choosing. A combined MSO signal line shows the combined trends of those 3 market internals, hence it represents real time market sentiment of the NYSE.
FEATURES
There are 2 display modes for this indicator:
1) On a separate pane
- in this mode, the signal lines can be toggled to oscillate along the zero line
2) On the price chart
- in this mode, the signal lines can be toggled to oscillate along the OHLC line of the price chart
- comes with Nadaraya-Watson Envelope and ATR bands
BUY/SELL SIGNALS AND STRATEGIES
By default, this indicator comes with two day trading strategies and offers long and short signals with alerts. These strategies attempts to leverage on the oscillating nature of market price movement on major NYSE indices, such as SPY, SPX, QQQ, NAS, all of which have high correlation with the market internals. However, please note that these signals offers no guarantee to profitability, so use at your own risk.
BACKGROUND COLORS SIGNIFYING TRENDS
There are options to display the background colors in 2 colors and shades.
1) Short-term sentiment
- Bright green = ADD / VOLD / TICK all in up trend
- Dimmed green = ADD / VOLD in up trend, but not TICK
- Bright red = ADD / VOLD / TICK all in down trend
- Dimmed red = ADD / VOLD in down trend, but not TICK
2) Trend Convergence
- Green = ADD / VOLD / TICK all bullish
- Red = ADD / VOLD / TICK all bearish
3) MSO
- Green = MSO bullish ( MSO signal line > 0 )
- Red = MSO bearish ( MSO signal line < 0 )
MARKET INTERNALS REAL-TIME DATA TABLE
A data table can be toggled on / off that shows the real-time sentiment and values of the three market internals. It may be useful in making quick trading decisions. The table cells are colored according to their corresponding trends.

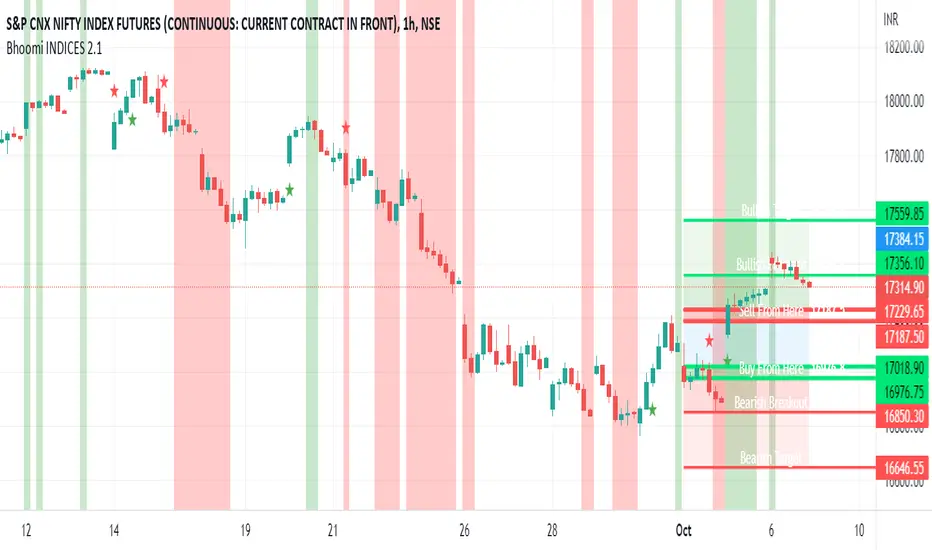
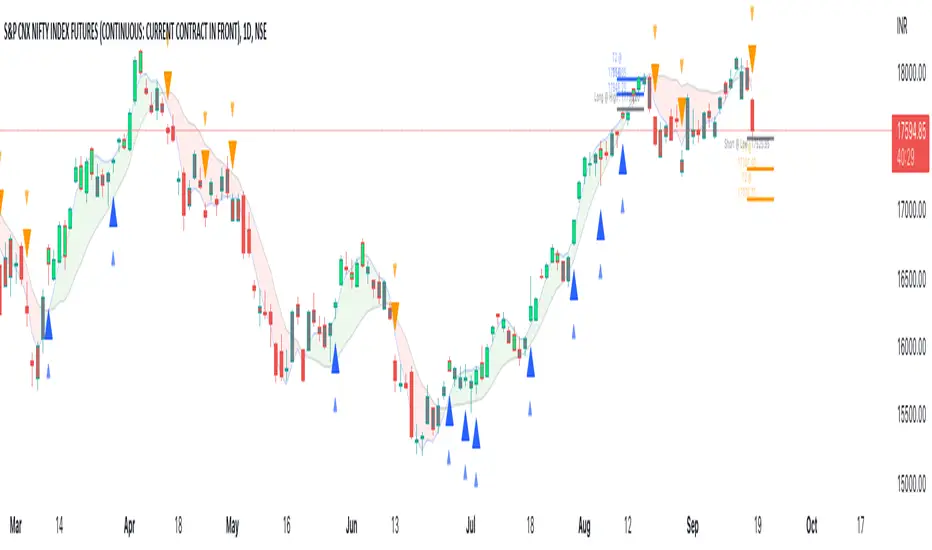
Bhoomi INDICES 2.1Bhoomi 2.0 is a Market Directional Indicator. It predicts the same by plotting respective zones and Labels.
To request access and to know more Information please contact us here.
Bhoomi 2.0 INDICES works on the Major World Indices as listed on tradingview. More to come in future, but please find the current list below. If you do not see the INDEX you trades, please comment below and we will add that for you.
"SPCFD:SPX"
"TVC:IXIC"
"DJCFD:DJI"
"TVC:NI225"
"CBOE:VIX"
"TSX:TSX"
"TVC:UKX"
"XETR:DAX"
"EURONEXT:PX1"
"EURONEXT:PX1GR"
"EURONEXT:PX1NR"
"TVC:FTMIB"
"TVC:NI225"
"TVC:KOSPI"
"TVC:SHCOMP "
"SZSE:399001"
"HSI:HSI"
"TVC:STI"
"ASX:XJO"
"NZX:NZ50G"
"TWSE:TAIEX"
"FTSEMYX:FBMKLCI"
"IDX:COMPOSITE"
"TVC:SX5E"
"BME:IBC"
"SIX:SMI"
"GPW:WIG20"
"EURONEXT:AEX"
"EURONEXT:BEL20"
"INDEX:BEL20"
"MOEX:IMOEX"
"OMXHEX:OMXH25"
"OMXICE:OMXI10"
"OMXSTO:OMXS30"
"OMXCOP:OMXC25"
"BELEX:BELEX15"
"OMXRSE:OMXRGI"
"OMXTSE:OMXTGI"
"OMXVSE:OMXVGI"
"BIST:XU100"
"TASE:TA35"
"TVC:SA40"
"NSE:NIFTY"
"BSE:SENSEX"
"DFM:DFMGI"
"TADAWUL:TASI"
"QSE:GNRI"
"BAHRAIN:BSEX"
"NSENG:NSE30"
"EGX:EGX30"
"BMFBOVESPA:IBOV"
"BMV:ME"
"BYMA:IMV"
"BVC:ICAP"
"BCS:SP_IPSA"
"BVL:SPBLPGPT"
"CURRENCYCOM:US500"
"CURRENCYCOM:US300"
"CURRENCYCOM:US100"
"CURRENCYCOM:US30"
"INDEX:DEU30"
"CBOE:VXD"
INDEX:DE40
Fib Percentage Previous Day CloseIntraday regulated markets move within their circuit range above or below which the market activity is halted.
These levels are protected by the MM to accumulate or distribute. These levels are mostly same for all markets i.e. 2%, 4% , 5%, 10% and 20% of previous day close, crossing which the market activity halts.
So, from here the expectation of turning or breaking increases.
This indicator automatically plots the levels and helps understanding the price behavior at these points. This in turn helps taking better RR trades.

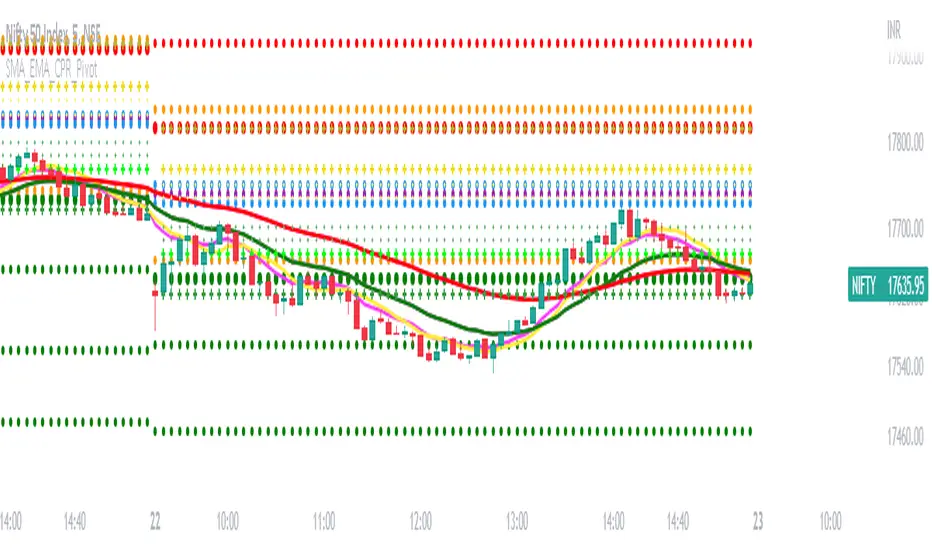
SMA_EMA_CPR_PivotThis Script can do multiple jobs in single indicator.
Like -:
Plot 3 SMA as per your inputs.
Plot 3 EMA as per your inputs.
Plot CPR Levels.
Plot Pivot Levels.
Plot Previous Day High Low.
Indicator can used in Intraday stock trading, Positional Trading and options trading.
Please Enjoy.
Intraday Range CalculatorThis indicator shows an easy way to determine if the stock, index or ETF ended within a configurable intraday range.
This solution is ideal for those who study and like Iron Condors or Iron Butterflies strategies.
Results:
If the square is red, it means that the selected deviation limits have been exceeded within the chosen times.
If the square is green, the price stayed within the pre-set limits.
A yellow circle marks the moment when the price leaves the range, either by the upper band or by the lower band.
In the last bar a label with the test results will be displayed.
Settings:
In the configuration there are three fields:
1. Deviation : is the range in percentage that the price can move up or down from the start time to the end time.
2. Begin Time: is the time (in 24h or military format) where the process begins.
3. End Time: is the time (in 24h or military format) where the process ends.
Example:
* for the time 11:00 am, you must enter "1100"
* for the time 2:45pm, you must enter "1445"
Important:
The selected timeframe must be less than 1 hour and Extended Trading Hours in the lower left corner), otherwise the indicator may not show results.
Later I will make an improvement to solve these inconveniences.

Intraday 5 Day Moving Average for Swing TraderThis indicator helps swing trader to quickly see if a stock or an index is in a short term up- or downtrend.
The 5 Day Moving Average line is shown on all intraday timeframes like 5, 10, 15, 30, 60, 65 and so on.
When an index like SPY or QQQ shows a green 5 DMA line, the index is in a short term uptrend and you can buy stocks for a swing trade,
when the line turns red be careful and stop buying stocks, instead watch out to short stocks.
In addition to the 5 DMA line you can show the percent distance to the 5 DMA and have multiple options to customize the indicator.
Features
■ Use SMA or EMA for the 5 DMA
■ Use different intraday timeframes or show on daily
■ Show the distance in percent
■ Different color modes
■ Multiple customize options

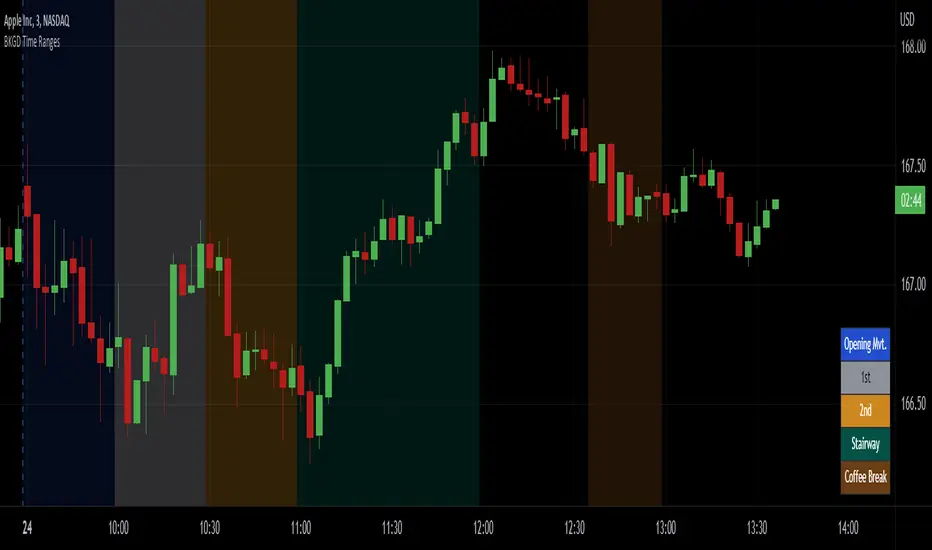
Intraday Background Time RangesThis simple script was written for studying recurring intraday behaviours of financial instruments. With it, you can highlight up to 13 customizable time ranges on your chart, filling the corresponding background space with colors you prefer. You can then write a note for each range and it will be shown in the optional related table.
The experience shows that every financial instrument has its own personality. With this in mind, the script can be useful to study intraday charts with the purpose of discovering recurring behaviours of specific instruments over a certain time range and under specific circumstances (normal days, earnings days, days with catalysts, etc.) This can help the trader to deeply understand the instrument personality, and therefore also to decide whether to enter or exit the market if its behaviour meets or not his expectations.
Please note that this script only works on minute/hourly charts.
Multiple Daily SMA EMA on Intra 1min 5min 15min ChartsThis script is helping you auto plot daily SMA EMA and extensions when you are looking at intraday charts. The script is customizable where user can select which ever levels they are interested in viewing. These daily lines act as support and resistance levels for intraday
The green line represent 20 EMA Daily
The yellow line represent 50 SMA Daily
The olive line represent 200 SMA Daily
The red line is upper Bollinger Band Daily
The black line is lower Bollinger Band Daily
To help you understand which lines are what I would recommend you add this indicator and select "D" timeframe and then see which lines you would like to view for your 1min chart or 5 min chart you can customize from the setting options which plot color you would like to view.

Optimal Confidence Scalper [OCS]Introduction
OCS : Optimal Confidence Scalpers, Utilise the computational approach towards finding confidence estimating in signal generating process, It helps u enter and exit the financial markets quickly, It buy and sell many times in a day with the objective of making consistent profits from incremental movements in the traded security's price. As we all know Lag is very undesirable because a trading system. Late trades can many times be worse than no trades at all, Main aim of the System is to find optimal Entry and Exit points for a successful trade
Mathematics behind the indicator
The indicator use two fundamentals pillars :
Estimation of a Confidence Interval
In frequentist statistics, a confidence interval (CI) is a range of estimates for an unknown parameter. A confidence interval is computed at a designated confidence level; the 95% confidence level is most common, but other levels, such as 90% or 99%, are sometimes used.
Desired properties are Validity, Optimality and Invariance
Polynomial Filters
The polynomial filters are based on the orthogonal polynomials of Legendre and Laguerre. Orthogonal polynomials are widely used in applied mathematics, physics and engineering, and the Legendre and Laguerre polynomials are only two of infinitely many sets, each of which has its own weight function.
They can be characterized in three equivalent ways:
1. They are the optimal lowpass filters that minimize the NRR, subject to additional constraints than the DC unity-gain condition
2. They are the optimal filters that minimize the NRR whose frequency response H(ω) satisfies certain flatness constraints at DC
3. They are the filters that optimally fit, in a least-squares sense, a set of data points to polynomials of different degrees.
The System uses Predictive Differentiation Filters, as subset to Polynomial Filters
Components of the System
Buy Signal and Sell Signals
=====================
=====================------ HOW TO USE IT
=====================
ENTRY and EXITS
Momentum Bands
Confidence Levels
Indicator Properties
Provision For Alerts
1. Buy Signal Alert
2. Sell Signal Alert
3. Exit Alert if in Buy Trade
4. Exit Alert if in Sell Trade
Some Examples
What TimeFrames To Use
U can use any Timeframe, The indicator is Adaptive in Nature,
I personally use timeframes such as : 1m, 5m 10m, 15m, ..... 1D, 1W
How to Access
U will need to privately message me.
use comment box for constructive comments
Thanks
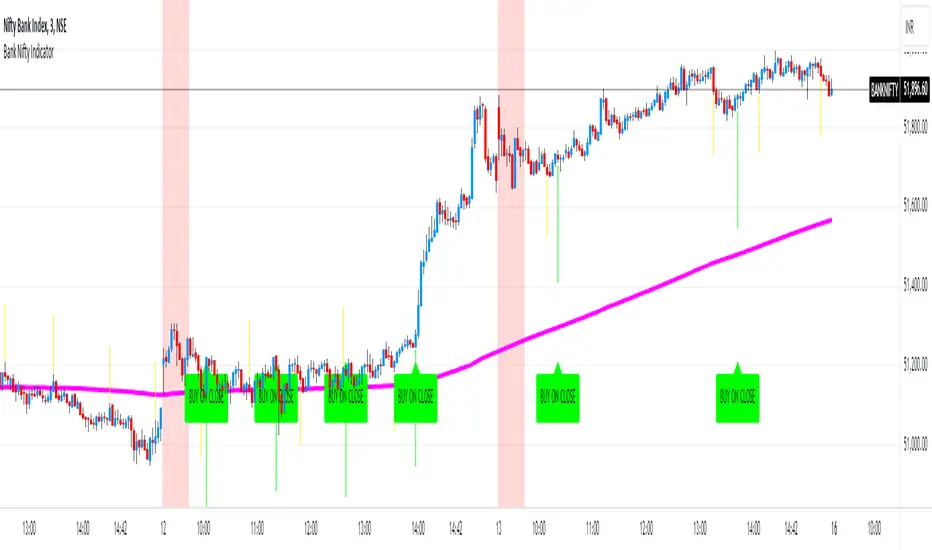
Bank Nifty Indicator by 'Bank Of Nifty'What is this indicator?
The indicator uses a series of Exponential Moving Averages, their directions and crossovers combined with Parabolic Stop And Reverse (SAR) to determine potential intraday entry points on the BANKNIFTY Index. It uses a long-period EMA to filter the direction of trade. For example, when the price is above the long-period EMA, it only generates Buy signals. It generates signals only between 10AM and 02:30PM IST. It has alert conditions for potential Long/Short Entry triggers.
Understanding the indicator plotted on the chart:
- The indicator uses settings that are arrived at after testing multiple conditions. Therefore, it does not allow the user to change these settings as doing so will render the indicator useless.
- EMA Line: One long-period EMA acts as a direction filter for trade signals. If price is above this EMA, only Buy signals are generated and if price is below this EMA, only Sell signals are generated.
- Yellow Arrows: These are early warning signs that a potential entry may be triggering soon. As it uses only some of the entry conditions to predict a potential entry, there can be multiple such signals before an actual signal is generated. These are only meant to be used as alerts and should NEVER be traded individually. Long Warning Alert and Short Warning Alert can be created using the 'Create Alert' dialog box.
- Buy On Close/Sell On Close Signals: These are actual entry triggers that are meant to be traded when confirmed by a candle close.
- Red Background: It indicates the first 30 minutes of the market opening from 9:15AM to 9:45AM.
- Colours for everything appearing on the chart can be customised in settings.
Notes and Usage Guidelines:
- The indicator should only be used on the BANKNIFTY Index for INTRADAY trades .
- For best results, use the 3 Minutes Chart and only trade the day's first signal after a 3 minute candle closes confirming the signal.
- Buy/Sell Signals are only generated between 10AM and 02:30PM .
- These signals work best in trending market conditions. In sideways and range-bound markets, there will be multiple false signals that could lead to losses. Therefore, it is best to limit the number of trades to 1 per day .
Why is this indicator closed source?
This indicator is closed source because it uses a specific combination of settings for indicators that are not available in the public domain, even though the indicators themselves are in the public domain. Keeping it closed source protects these settings from being discovered and as well as preserving them for the indicator to be useful. Without this specific combination of settings and values, the indicator becomes useless.
Disclaimer:
- Trade decisions should NOT be based solely on this indicator. It is meant to aid in confirming a direction bias and act as a confluence to the trader's analysis of the existing market condition.
- The indicator may be updated from time to time to adapt to changed market conditions.
OHL Screener by KiranScript is intended to scan Open = High and Open = Low (OHL) stocks for selected Opening Range in minutes.
I have added NSE NIFTY 50 stocks as default input for the script. Hopefully it will work with other stocks and exchanges.
Opening Range time is limited to the "1 min, 3 min, 5 min, 15 min, 30 min and 60 min" as OHL generally required for Intraday.
Stock qualified criteria OPEN = LOW (in selected Opening Range timeframe) will be listed in the table at TOP RIGHT corner of the chart screen in a green background.
Stock qualified criteria OPEN = HIGH (in selected Opening Range timeframe) will be listed in the table at BOTTOM LEFT corner of the chart screen in a red background.
Script scans stocks irrespective of current chart symbol and current time frame on the chart.
Limitations:
- Maximum 40 stocks can be scanned.
- request.security can't be placed under loop hence repeat call to request.security should be placed on separate line

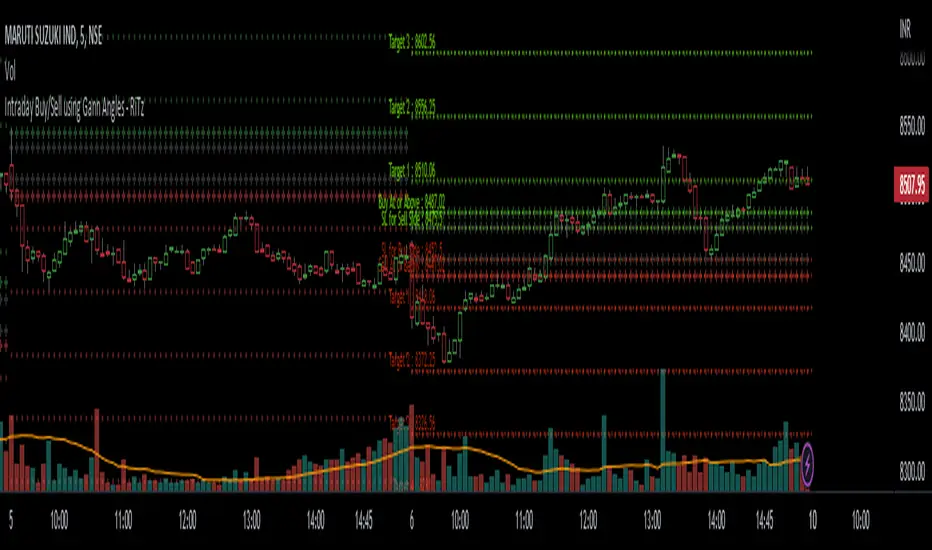
Intraday Buy/Sell using Gann Angles - RiTzIntraday Buy/Sell Levels using Gann Angles based on Todays Open/previous Day High/Low/Close prices
How to use this :
The Buy/Sell levels will be calculated on 1 of 4 things (you can choose any one which you prefer)
1. Todays Open price
2. Previous Day High
3. Previous Day Low
4. Previous Day Close
The Buy/Sell levels will be displayed in these ways
1. In a Table
2. on the Chart
You can turn them on/off according to your preference!
I can't seem to find the original documentation or a link to it.
i have it's excel file, in which we have to enter following data :
1. Todays Open price
2. Previous Day High
3. Previous Day Low
4. Previous Day Close
and the buy/sell levels are calculated by using the above data in following manner :
Based On Today's Opening Price
(lets call it TDO)
Degree's````````````````` Degree Factor```````````````````````` Buy````````````````````````` Sell
11.25```````````````````` =degree/180=11.25/180=0.0625````````` =(sqrt(TDO)-0.0625)^2``````` =(sqrt(TDO)+0.0625)^2````` SL
22.5````````````````````` =degree/180=22.5/180=0.125``````````` =(sqrt(TDO)+0.125)^2```````` =(sqrt(TDO)-0.125)^2`````` Buy/Sell At
45``````````````````````` =degree/180=45/180=0.25`````````````` =(sqrt(TDO)+0.25)^2````````` =(sqrt(TDO)-0.25)^2``````` Target-1
90``````````````````````` =degree/180=90/180=0.5``````````````` =(sqrt(TDO)+0.5)^2`````````` =(sqrt(TDO)-0.5)^2```````` Target-2
135`````````````````````` =degree/180=135/180=0.75````````````` =(sqrt(TDO)+0.75)^2````````` =(sqrt(TDO)-0.75)^2``````` Target-3
180`````````````````````` =degree/180=180/180=1```````````````` =(sqrt(TDO)+1)^2```````````` =(sqrt(TDO)-1)^2`````````` Target-4
225`````````````````````` =degree/180=225/180=1.25````````````` =(sqrt(TDO)+1.25)^2````````` =(sqrt(TDO)-1.25)^2``````` Target-5
270`````````````````````` =degree/180=270/180=1.5`````````````` =(sqrt(TDO)+1.5)^2`````````` =(sqrt(TDO)-1.5)^2```````` Target-6
315`````````````````````` =degree/180=315/180=1.75````````````` =(sqrt(TDO)+1.75)^2````````` =(sqrt(TDO)-1.75)^2``````` Target-7
360`````````````````````` =degree/180=360/180=2```````````````` =(sqrt(TDO)+2)^2```````````` =(sqrt(TDO)-2)^2`````````` Target-8
sqrt = square root
TDO = Today's Opening Price
PDH = Previous Days High
PDL = Previous Days Low
PDC = Previous Days Close
Based On Previous Days High Price
(lets call it PDH)
Degree's````````````````` Degree Factor```````````````````````` Buy````````````````````````` Sell
11.25```````````````````` =degree/180=11.25/180=0.0625````````` =(sqrt(PDH)-0.0625)^2``````` =(sqrt(PDH)+0.0625)^2````` SL
22.5````````````````````` =degree/180=22.5/180=0.125``````````` =(sqrt(PDH)+0.125)^2```````` =(sqrt(PDH)-0.125)^2`````` Buy/Sell At
45``````````````````````` =degree/180=45/180=0.25`````````````` =(sqrt(PDH)+0.25)^2````````` =(sqrt(PDH)-0.25)^2``````` Target-1
90``````````````````````` =degree/180=90/180=0.5``````````````` =(sqrt(PDH)+0.5)^2`````````` =(sqrt(PDH)-0.5)^2```````` Target-2
135`````````````````````` =degree/180=135/180=0.75````````````` =(sqrt(PDH)+0.75)^2````````` =(sqrt(PDH)-0.75)^2``````` Target-3
180`````````````````````` =degree/180=180/180=1```````````````` =(sqrt(PDH)+1)^2```````````` =(sqrt(PDH)-1)^2`````````` Target-4
225`````````````````````` =degree/180=225/180=1.25````````````` =(sqrt(PDH)+1.25)^2````````` =(sqrt(PDH)-1.25)^2``````` Target-5
270`````````````````````` =degree/180=270/180=1.5`````````````` =(sqrt(PDH)+1.5)^2`````````` =(sqrt(PDH)-1.5)^2```````` Target-6
315`````````````````````` =degree/180=315/180=1.75````````````` =(sqrt(PDH)+1.75)^2````````` =(sqrt(PDH)-1.75)^2``````` Target-7
360`````````````````````` =degree/180=360/180=2```````````````` =(sqrt(PDH)+2)^2```````````` =(sqrt(PDH)-2)^2`````````` Target-8
Based On Previous Days Low Price
(lets call it PDL)
Degree's````````````````` Degree Factor```````````````````````` Buy````````````````````````` Sell
11.25```````````````````` =degree/180=11.25/180=0.0625````````` =(sqrt(PDL)-0.0625)^2``````` =(sqrt(PDL)+0.0625)^2````` SL
22.5````````````````````` =degree/180=22.5/180=0.125``````````` =(sqrt(PDL)+0.125)^2```````` =(sqrt(PDL)-0.125)^2`````` Buy/Sell At
45``````````````````````` =degree/180=45/180=0.25`````````````` =(sqrt(PDL)+0.25)^2````````` =(sqrt(PDL)-0.25)^2``````` Target-1
90``````````````````````` =degree/180=90/180=0.5``````````````` =(sqrt(PDL)+0.5)^2`````````` =(sqrt(PDL)-0.5)^2```````` Target-2
135`````````````````````` =degree/180=135/180=0.75````````````` =(sqrt(PDL)+0.75)^2````````` =(sqrt(PDL)-0.75)^2``````` Target-3
180`````````````````````` =degree/180=180/180=1```````````````` =(sqrt(PDL)+1)^2```````````` =(sqrt(PDL)-1)^2`````````` Target-4
225`````````````````````` =degree/180=225/180=1.25````````````` =(sqrt(PDL)+1.25)^2````````` =(sqrt(PDL)-1.25)^2``````` Target-5
270`````````````````````` =degree/180=270/180=1.5`````````````` =(sqrt(PDL)+1.5)^2`````````` =(sqrt(PDL)-1.5)^2```````` Target-6
315`````````````````````` =degree/180=315/180=1.75````````````` =(sqrt(PDL)+1.75)^2````````` =(sqrt(PDL)-1.75)^2``````` Target-7
360`````````````````````` =degree/180=360/180=2```````````````` =(sqrt(PDL)+2)^2```````````` =(sqrt(PDL)-2)^2`````````` Target-8
Based On Previous Days Close Price
(lets call it PDC)
Degree's````````````````` Degree Factor```````````````````````` Buy````````````````````````` Sell
11.25```````````````````` =degree/180=11.25/180=0.0625````````` =(sqrt(PDC)-0.0625)^2``````` =(sqrt(PDC)+0.0625)^2````` SL
22.5````````````````````` =degree/180=22.5/180=0.125``````````` =(sqrt(PDC)+0.125)^2```````` =(sqrt(PDC)-0.125)^2`````` Buy/Sell At
45``````````````````````` =degree/180=45/180=0.25`````````````` =(sqrt(PDC)+0.25)^2````````` =(sqrt(PDC)-0.25)^2``````` Target-1
90``````````````````````` =degree/180=90/180=0.5``````````````` =(sqrt(PDC)+0.5)^2`````````` =(sqrt(PDC)-0.5)^2```````` Target-2
135`````````````````````` =degree/180=135/180=0.75````````````` =(sqrt(PDC)+0.75)^2````````` =(sqrt(PDC)-0.75)^2``````` Target-3
180`````````````````````` =degree/180=180/180=1```````````````` =(sqrt(PDC)+1)^2```````````` =(sqrt(PDC)-1)^2`````````` Target-4
225`````````````````````` =degree/180=225/180=1.25````````````` =(sqrt(PDC)+1.25)^2````````` =(sqrt(PDC)-1.25)^2``````` Target-5
270`````````````````````` =degree/180=270/180=1.5`````````````` =(sqrt(PDC)+1.5)^2`````````` =(sqrt(PDC)-1.5)^2```````` Target-6
315`````````````````````` =degree/180=315/180=1.75````````````` =(sqrt(PDC)+1.75)^2````````` =(sqrt(PDC)-1.75)^2``````` Target-7
360`````````````````````` =degree/180=360/180=2```````````````` =(sqrt(PDC)+2)^2```````````` =(sqrt(PDC)-2)^2`````````` Target-8
example based On Today's Opening Price = 4339
Degree's```````` Degree Factor```````` Buy`````````` Sell
11.25``````````` 0.0625``````````````` 4330.77`````` 4347.24```````` SL
22.5```````````` 0.125```````````````` 4355.48`````` 4322.55```````` Buy/Sell At
45`````````````` 0.25````````````````` 4372.00`````` 4306.13```````` Target-1
90`````````````` 0.5`````````````````` 4405.12`````` 4273.38```````` Target-2
135````````````` 0.75````````````````` 4438.37`````` 4240.76```````` Target-3
180````````````` 1```````````````````` 4471.74`````` 4208.26```````` Target-4
225````````````` 1.25````````````````` 4505.24`````` 4175.88```````` Target-5
270````````````` 1.5`````````````````` 4538.86`````` 4143.64```````` Target-6
315````````````` 1.75````````````````` 4572.61`````` 4111.51```````` Target-7
360````````````` 2```````````````````` 4606.48`````` 4079.52```````` Target-8
Note : ignore the '`' , inserted them to fill up the spaces , it was looking very weird!, tried to fix it as much as I can.
Note :- Please correct me if I'm wrong , as I've already mentioned I don't have it's original documentation.
if anyone can find it or already has it then please feel free to share it.
Regression Channel Alternative MTF█ OVERVIEW
This indicator displays 3 timeframes of parallel channel using linear regression calculation to assist manual drawing of chart patterns.
This indicator is not true Multi Timeframe (MTF) but considered as Alternative MTF which calculate 100 bars for Primary MTF, can be refer from provided line helper.
The timeframe scenarios are defined based on Position, Swing and Intraday Trader.
█ INSPIRATIONS
These timeframe scenarios are defined based on Harmonic Trading : Volume Three written by Scott M Carney.
By applying channel on each timeframe, MW or ABCD patterns can be easily identified manually.
This can also be applied on other chart patterns.
█ CREDITS
Scott M Carney, Harmonic Trading : Volume Three (Reaction vs. Reversal)
█ TIMEFRAME EXPLAINED
Higher / Distal : The (next) longer or larger comparative timeframe after primary pattern has been identified.
Primary / Clear : Timeframe that possess the clearest pattern structure.
Lower / Proximate : The (next) shorter timeframe after primary pattern has been identified.
Lowest : Check primary timeframe as main reference.
█ EXAMPLE OF USAGE / EXPLAINATION

ViVen - EXP - Signals with AlertsHi Friends,
Here the trading made easy with Signals...
The main purpose of this indicator is to identify the Support and Resistance levels well in advance to make ourselves ready for the Entries with confidence..
With this indicator we will be able to identify the Market Structure and Trend to initiate our trades.
Multi Timeframe Concepts are considered in some cases to capture the Golden Zones.
Details of the Indicator:
Method of Trading – Intraday, Positional or Swing – Indices, Stocks and Commodity Markets
Golden Zones : When two or more indicator levels are confluences at one price point which will act as Strong Support and Resistance in the Market. That is called Golden Zone.
CPR & Pivot (Daily / Weekly / Monthly) – Based on the previous Timeframe values, it will automatically calculates the Support and Resistance values for the upcoming Sessions.
BUY / SELL Levels (W-Refers the Weekly levels) – Possible Reversal in the market we can expect at this price level. Depends on the Time frame (Daily/Weekly)
Bull BO / Bear BO (W-Refers the Weekly levels) – Possible Breakout level, If breakout happens price will move to reach the Target 1 and 2 Points based on which side the price breaks ( BULLISH / BEARISH ). We can initiate our BUY/SELL Entries.
Target 1 & Target 2 – Once the Price breaks the Breakout (Bull BO / Bear BO) levels, it will try to reach the Target Points where we can book our profits.
Tomorrow Levels - This will help us to enable the next day trading session Support and Resistance Levels in advance to do pre-analysis to prepare for the Entry and Exits.
Colored Candles : Lime Green and Violet colored candles will indicate the Possible Trend Reversals.
Triangles : Orange and Violet triangles will indicate the Confirmation of Trend Reversal.
BUY / SELL Signal – Considering the momentum and the Trend change it will suggest the possible entry time.
Dashboard :
1. Weekly Trend : This will indicate how the current week trend is going to be – Trending / Sideways
2. Today – Current Session expectation in the Market ( Bullish / Bearish )
3. Sentiment – Indicates the Traders mind set (Positive/Negative Side)
4. Range - This will indicate how the current Day trend is going to be – Trending / Sideways
5. MB / MA Trend – This identifies the major trend (Is the Stock / script in Up Trend or Down Trend)
6. Other Parameters – Will indicates the present situation in the market
7. RSI Values – This is to know and understand the momentum of the particular script
Levels Name Explanations:
1. DPP – Daily Pivot Point
2. WPP – Weekly Pivot Point
3. WTC – Weekly Top Central Pivot
4. WBC – Weekly Bottom Central Pivot
5. PDH – Previous Day High
6. PDL – Previous Day Low
7. PWH – Previous Week High
8. PWL – Previous Week Low
9. PMH – Previous Month High
10. PML - Previous Month Low
11. WR1, WR2 – Weekly Resistance Levels 1 & 2
12. WS1, WS2 – Weekly Support 1 & 2
13. 5m 200 EMA – 5 Minutes 200 Period Exponential Moving Average
14. 15m 200 EMA – 15 Minutes 200 Period Exponential Moving Average
15. 1H 200 EMA – 1 Hour 200 Period Exponential Moving Average
16. 1H 200 SMA – 1 Hour 100 Period Simple Moving Average
17. 1D 200 EMA – Daily TF 100 Period Exponential Moving Average
Settings:
To turn ON and OFF any of these levels if it does not require, Go to Indicator Settings and disable the specific levels.
Alerts:
You can enable the Buy / Sell signal Alerts by creating new alert.
To Access the Indicator:
If you want to know more about the indicator & to access for your trading please check the link in the signature below.
If you have any doubts please mention it in the comment section.
Looking forward your valuable comments and feedbacks to improve further in accuracy of our Trading.
Thanks!!

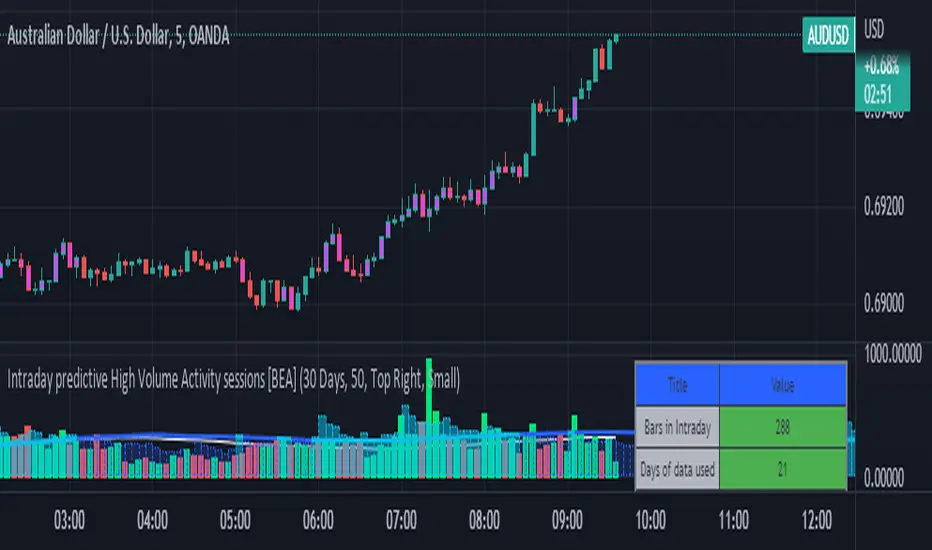
Intraday predictive High Volume Activity sessions [BEA]Idea:
This indicator is designed to know the high traded volume sessions in advance before the day starts.
The predictive volume bars will be plotted in advance once a new trading session starts.
Logic Used:
The basic idea is to store each bar volume / Volume MA data for the selected time. So, the first bar of each data is stored for all selected historical days.
Once the data is stored, I am taking average of each bar data for the selected Historical days.
How to Use:
This gives me an idea of the volume behavior throughout the days based on historical data. So I decide my time of trading for that specific times sessions where the traded volume activity is high.
The bars which are more than the Moving average ( Highlighted Volume bars plotted in future ) is the time session to focus.
Designed only for intraday timeframes.
Here in the image, you can see the session in advance for high traded volume activity.
Try it test it , let me know if it can be improved further.
Have a happy trading.
DISCLAIMER
Any and all liability for risks resulting from investment transactions or other asset dispositions carried out by the user based on information received or a market analysis is expressly excluded by me.
All the information made available here is generally provided to serve as an example only, without obligation and without specific recommendations for action. It does not constitute and cannot replace investment advice. We therefore recommend that you contact your personal financial advisor before carrying out specific transactions and investments.
Do your own research, this is not a financial advice.
Intrabar On Balance VolumeAn experimental modification of TradingView's built-in OBV indicator that calculates its value with intrabar data.
This leads to a more accurate OBV trace because it considers the price swings that happen within the time period of each candle, instead of only considering the candle close price.
For example: on a 4H timeframe a single candle spans 4 hours. In this indicator the OBV is calculated with 1-minute intrabar data, leading to a resolution of 240 intrabars per 4H candle (that is, it considers the volume and price swings that happened at each minute of those 4 hours).

Artharjan Volume AnalysisHi,
I have created Artharjan Volume Analysis indicator dashboard which gives following information about the volume to the traders.
It has two rows. The first row containing volume information is for the Daily Timeframe and the second row containing volume information for any other timeframe of your choice (Basically Chart timeframe)
It gives following information about volume to the traders.
1] Current Volume in Lakhs (Not in Millions) since this script was made keeping in mind Volumes of the Scripts traded in Indian Stock Exchanges. 1 Lakh = 1,00,000
2] Change from its previous Volume. If the change is positive it will be highlighted in Green else in Red.
3] 25 period SMA of the Volume (This period is a Long Term Moving Average and its a customizable parameter which can be changed in Indicator Settings)
4] Current Volume as a percentage of Long term SMA( Volume). If the percentage is positive it will be highlighted in Green else in Red.
5] High Volume during the Lookback period
6] Low Volume during the Lookback period
7] Is current Volume equal to Min Level or Max Level? Or its between Min Max Levels.
8] Is the current Volume rising over past 5 candles or is it falling over past 5 candles or its Swinging? (Short Term Period which is a customizable parameter and it can be changed in the Indicator Settings)
9] Current Volume as a percentage of Short term SMA( Volume). If the percentage is positive it will be highlighted in Green else in Red.
The 1st row will be shown only when the Chart Timeframe is a Daily Timeframe.
The 1st and the 2nd row will be shown only when the Chart Timeframe is not a Daily Timeframe.
With this information regarding volume, traders can identify whether the current volume is at its Highest Levels or at its Lowest Levels, can identify whether volume is rising or volume is falling in accordance to the price action and then take trading decisions.
I hope you would enjoy using this indicator in your day to day trading journey.
Regards
Rahul Desai
@Artharjan.

Intraday rejection levels3 supports, 3 resistances and an equilibrium price per day displayed at 9am (GMT+2), calculated on the dynamic study of the market at its opening over a certain period that we could qualify as "first opening interventions"
Method: We are interested in the first reaction of the market when it discovers one of the levels.
The red and green zones (from levels R2 to R3) are the zones of rejections/daily overextensions with large RRs of which we will appreciate a rejection for the US opening (where the zones are more opaque, the Killzone!), because the session US is known to either accompany the London session or completely break the trend.
Equilibrium, on the other hand, is a retest zone that can be traded in several directions, ideal for capturing the first retracement / retest of a recently broken structure:
Activate "EL" to display an ideally early morning rejection area so levels can be scalped! They correspond to opportunistic areas above the high and below the low of a custom Asian session ignoring part of the London open - which I consider to be liquidity :):
FIRST SETUP: Confluence R1/R2 with the EL!
SECOND SETUP: The price does not frequent the R2/R3 zone during London but only during the killzone:
Anticipate rejection zones, put them in confluence to find the best opportunity!
Tips:
I'm only interested in the first reaction on these levels
You can measure the difference between R1 and EQ: on average on the EURUSD it must be 20 to 30 pips! Apart from these values, I deduce that the market is unbalanced: I lower my risk on my scalps and I am more cautious.
It is possible to use the previous day's levels to look for correlations
Ideally, the Asia range Custom should not take the high/low of the day before (see "LIquidity maps" indicator on our profile for optimal use)
As an option you can display the standard pivot, and activate the "crypto" mode to be able to use it on your favorite crypto :)
