NSDT Colored Support And Resistance ZonesScript that allows you to plot four (4) different support/resistance zones. The zones will change color whether the candle is over or under or within the zone area. All options can be modified. Tip: If you want eight (8) zones, just load the indicator twice.
Levels

RSI LevelsRSI Levels
- The relative strength index ( RSI ) is a technical indicator used in the analysis of financial markets.
It is intended to chart the current and historical strength or weakness of a stock or market based on the closing prices of a recent trading period.
- This indicator allows us to visualize the levels of rsi in the chart, so that we can calculate take profit and stop points in a simple way,
knowing what position the price is currently in relation to these levels and how much space we have.
- We can also visualize the slope of the three levels of rsi , overbought, oversold and level 50, something that is not possible in the oscillator version.
- It allows you to display 2 rsi values at the same time.
- Allows to change the color of candlesticks based on rsi.

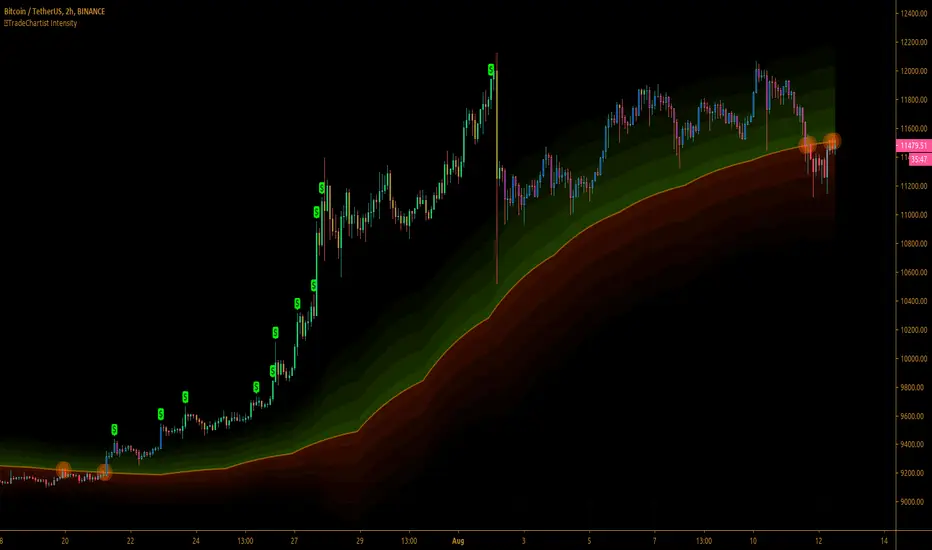
™TradeChartist Intensity™TradeChartist Intensity is a visual indicator that comes with Intensity color candles and Auto-fibs feature that helps any trader with Entry/Exit and levels confirmation based on where the price is, in relation to the Orange Price Equilibrium line and the 5 zones of Bull/Bear limits that fade into the top or bottom outer space.
™TradeChartist Intensity itself doesn't plot BUY or SELL signals, but when used with ™TradeChartist Rubicon gives a better picture for trade confirmations. It can also be used as a standalone indicator and works equally effective with other traditional and non-traditional indicators.
The indicator comes with simple settings with useful features outlined below.
Intensity Color Candles
Intensity Color Candles when activated from settings paints the candles/bars with colors specific to the Bull/Bear limits or the outer space and is easy to identify the signal strength over time.
Uptrend - The bars/candles move away from the Orange Price Equilibrium line towards the upper Bull limits with bar color fading slowly leading to outer space where the bar color turns neon green.
Downtrend - The bars/candles move away from the Orange Price Equilibrium line towards the lower Bear limits with bar color fading slowly leading to outer space where the bar color turns neon red.
When the price candle wick or body touches the Orange Price Equilibrium line, distinct torchlight circle appears to signal the trader of a potential change in price direction which can be used as a signal confirmation in conjunction with another indicator before taking a trade position.
Show Auto Fib Levels
Auto Fib Levels plot automatic Fib levels based on significant Highs and Lows based on Intensity strategy which mostly are reference prices of recent highest high above Orange Equilibrium price line and recent lowest low below the Orange Equilibrium price line.
15m XBT chart with 'Show Auto Fib Levels' checked and 'Show Fibs from current High/Low' unchecked under indicator settings
These Auto Fib Levels change when the price movement/trend changes direction and will be based on trending price direction.
Show Fibs from current High/Low
When this option is chosen from indicator settings, the auto fib levels are drawn from the highest high of the trending price direction to lowest low of last trend for uptrend or vice-versa for downtrend.
15m XBT chart as above with 'Show Fibs from current High/Low' unchecked under indicator settings
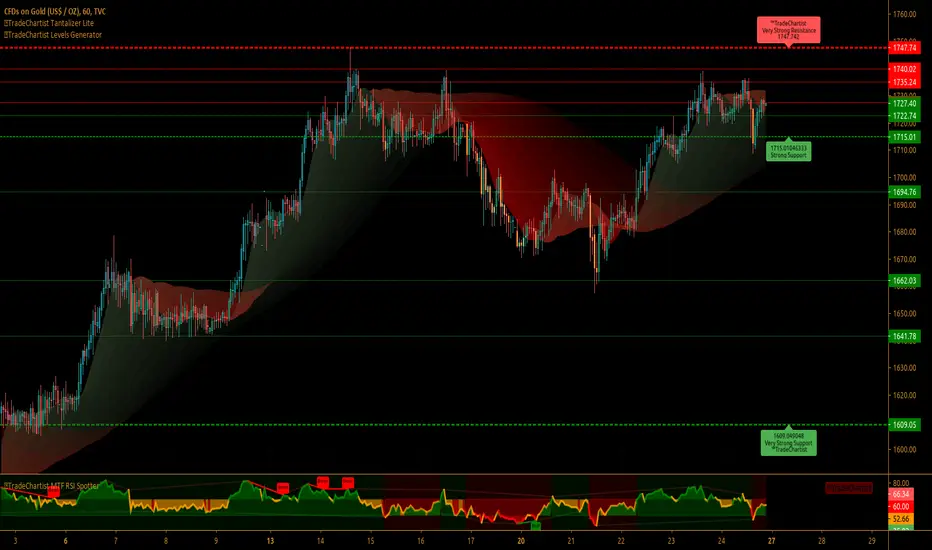
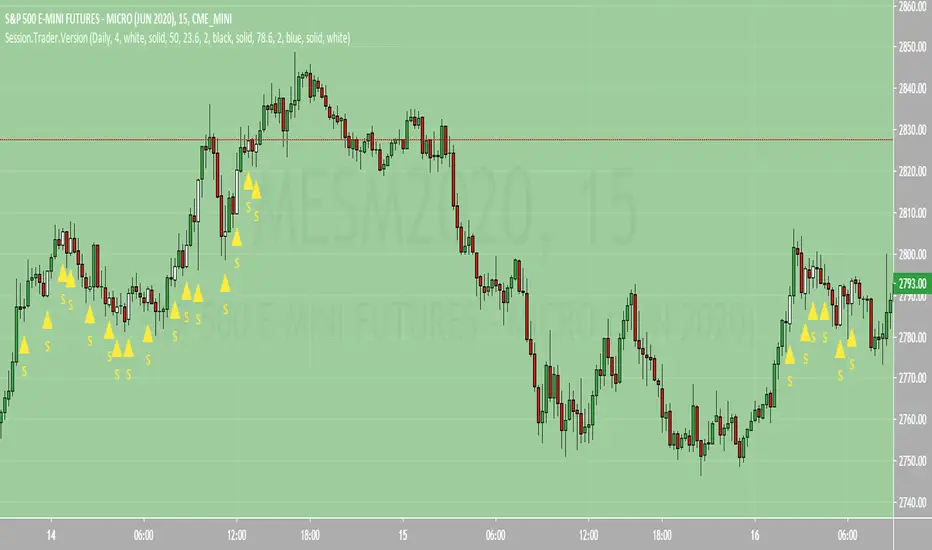
Show Profit Candles
Activating this option from indicator settings will automatically plot $ labels above candle highs that hit important resistance levels during uptrend and candle lows that hit important support levels during downtrend. This will help traders take out profits during trades based on their personal profit goals and realistic trade targets based on momentum/RSI/volatility etc.
Example chart of XAUUSD 1hr Gold chart showing both Long and Short trade Profit candles
Give a thumbs up or leave a comment if you like the script.
™TradeChartist Levels Generator V4"™TradeChartist Levels Generator" is an easy to use script that can be used by traders of all levels from beginners to advanced professionals.
What does the script do?
Plots the support and resistance levels automatically based on user preference of Local levels of Lower or Higher Timeframe from indicator settings.
Plots Fibonacci retracement levels between high and low based on 'Days' or 'Candles' lookback from indicator settings.
The script proves to be very effective when used with another indicator for trend confirmation like the ribbon (not included in this script) shown on chart.
What markets can this script be used on?
Forex
Stocks
Commodities
Cryptocurrencies
and almost any asset on Trading View
What is the difference between "Plot Levels" and "Plot Fibonacci Levels"?
"Plot Levels" plots support and resistance levels automatically without any input from the user other than preferred levels 'plot' from the indicator settings namely
Plot Local Levels for Higher TF - Plots all important Support/Resistance levels for mostly higher time frames (1hr or higher) - Short to Mid term outlook
Plot Local Levels for Lower TF - Plots all important Support/Resistance levels for mostly smaller time frames (can be used for up to 1hr in most cases) -
Recommended for Scalping/Swing Trading mostly dependent on volatility
"Plot Fibonacci Levels" plots all standard Fibonacci retracement levels - 0, 23.6%, 38.2%, 50%, 61.8%, 78.6% and 100% based on
"Days" Lookback - Fibonacci levels between High and Low based on number of days in the past, starting from the current day on any time frame chart
"Candles" Lookback - Fibonacci levels between High and Low based on number of candles in the past, starting from the current candle on any time frame chart
Can the Fibonacci levels be reversed?
Yes. The Fibonacci levels can be reversed by checking the "Reverse" checkbox from the indicator settings. This is very handy if the trend looks like there may be a support or resistance from one of the Fib levels and a possibility of a new high or a new low based on the price action.
What is the need for "Plot 1.272 Fibonacci Level" under "Plot Fibonacci Levels"?
1.272 is an important Fibonacci number as it is the square root of 1.618 and is the near support or resistance after 100% price retracement. Even though it keeps moving on the chart dependent on the new high or new low based on Days/Candles lookback, it serves as a 'nice to have' reference for any trader looking beyond 100% retracement for support/resistance .
Why do the 'local levels' lines' color changes between green and red?
The nearby levels lines change color based on price closing above or below them. This happens to only closest local levels for lower TF near price action and for top/bottom lines of the local levels for higher TF.
The line turns green when it becomes support as price closes above it.
The line turns red when it becomes resistance as price closes below it.
This is a free to use indicator. Give a thumbs up or leave a comment if you like the script.
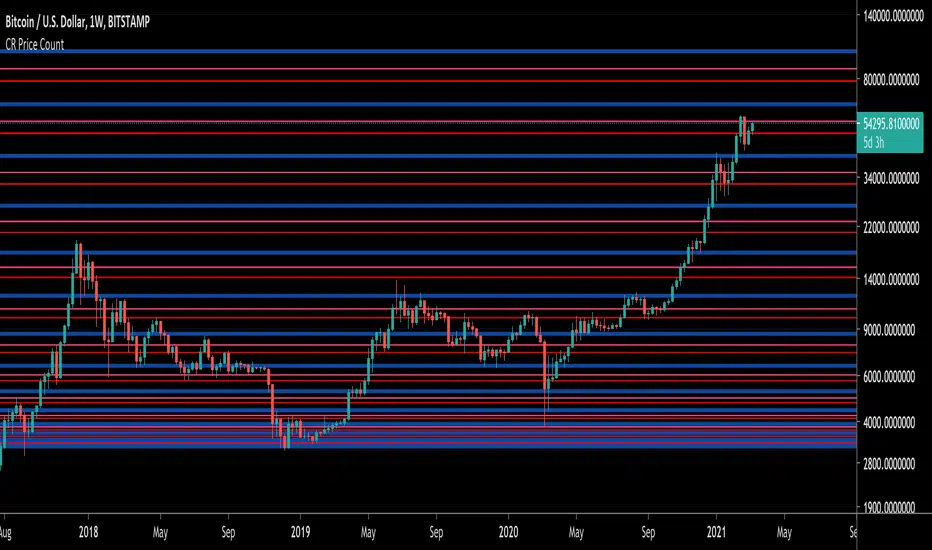
CR Price CountThis indicator calculates previous and upcoming S/R levels to predict potential targets and pivot points.
PipSniperThis is a script that trades a variety of instruments and can be configured for day trading stock index futures or swing trading FX pairs. The script focuses on the retrace trade using a proprietary Fibonacci setting to help identify the resumption of the trend. The script uses a variety of visual cues to identify trade signals quickly and efficiently. It's part of BK Forex member script library
cPOC [Plot]This is a point of control script based between the length of two different conditions and the last time they were true (barssince() or whatever)
Been wanting to make this for a while simply because volume doesn't care about time, so why would a session based POC matter with that logic mind?
Will be improving on this more in time, just happy with the results of this prototype for now and figured it may be the first script I've ever made people will find useful so why not release it
This is the plots version (utilizing plot() instead of line.new) for longer lines and for the color change. Laggy if utilizing all the levels but my preferred version.
P.S. Thanks, Showerhead. You're finally cool

cPOC [Line]This is a point of control script based between the length of two different conditions and the last time they were true (barssince() or whatever)
Been wanting to make this for a while simply because volume doesn't care about time, so why would a session based POC matter with that logic mind?
Will be improving on this more in time, just happy with the results of this prototype for now and figured it may be the first script I've ever made people will find useful so why not release it
This is the lines version (utilizing line.new instead of plot()) for people who want a less laggy chart. Sacrifices the color flip for minimal lag and lines are much shorter.
P.S. Thanks, @paaax for the color switcher

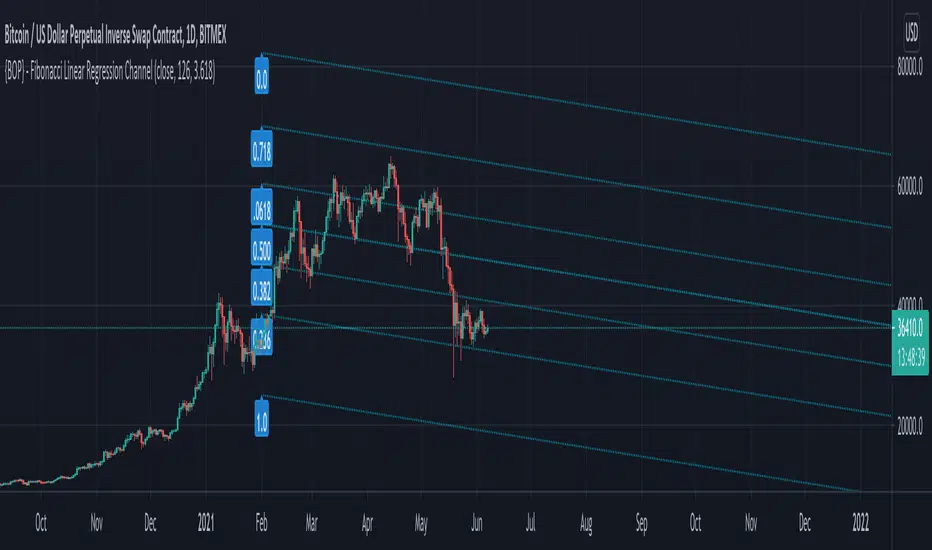
{BOP} - Fibonacci Linear Regression ChannelHere is a test model of a fibonacci linear regression channel. Have fun.
[RS][V4]ZigZag Percent Reversal - Helper - Retrace LevelsA helper script with multiple retrace level options.

Auto-fibsAutomatically plots Fibonacci Retracement levels.
Uses the all time high (ATH) for a specified number of days back, and the lowest value since the ATH, to plot the levels.

Previous Day Week Highs & LowsThis script plots the previous n day and week highs and lows (previous two days and previous week by default).
Here are some additional info about the script behavior:
Plots highs and/or lows
Plots for days and/or weeks
Day highs and lows are shown only on intraday timeframes
Week highs and lows are shown only on timeframes < weekly
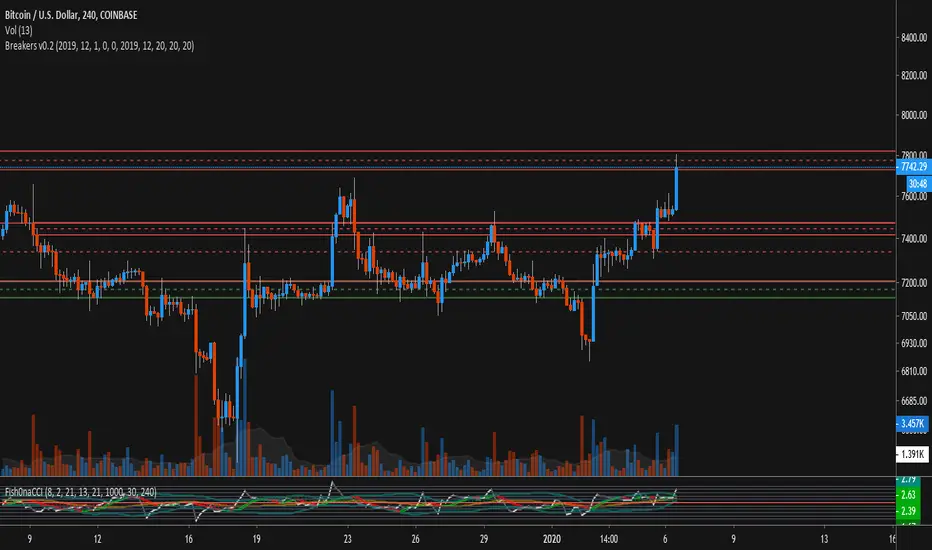
bg_Breakers_orderBlocks_detection (Breakers)Version 0.1
Using Pivots / Swing Point detection, this script plots the final swing candle's body span from top to bottom with an extended horizontal line, with a mid-channel point at 50% between open and close.
Once the trend changes, these zones serve as support and resistance zones, and can help identify breakouts from ranges and probable reversal points moving forward.
To avoid clutter, the script allows you to select a specific date-range (start / end date) which the rule will only apply and plot for.
Other customizable options are the length in bars of the pivot/swing point detection, which is defaulted at 20 bars for both highs and lows.
Works best on time-frames 4H, 1D, etc. with some luck to be had in occasionally shorter time-frames as shown above.
4H:
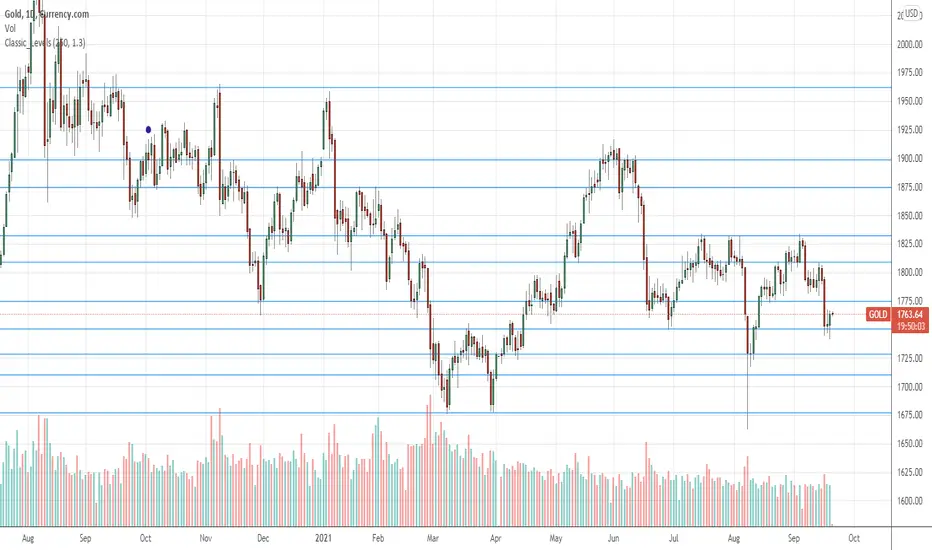
Classic_LevelsDisplays horizontal lines that represent support and resistance levels.
You can use it with any symbol and on any timeframe.
Parameter 'Time range' means number of candles in consideration. The beginning of the range is marked with a little violet circle.
The more 'Sensitivity' is, the more levels are displayed.
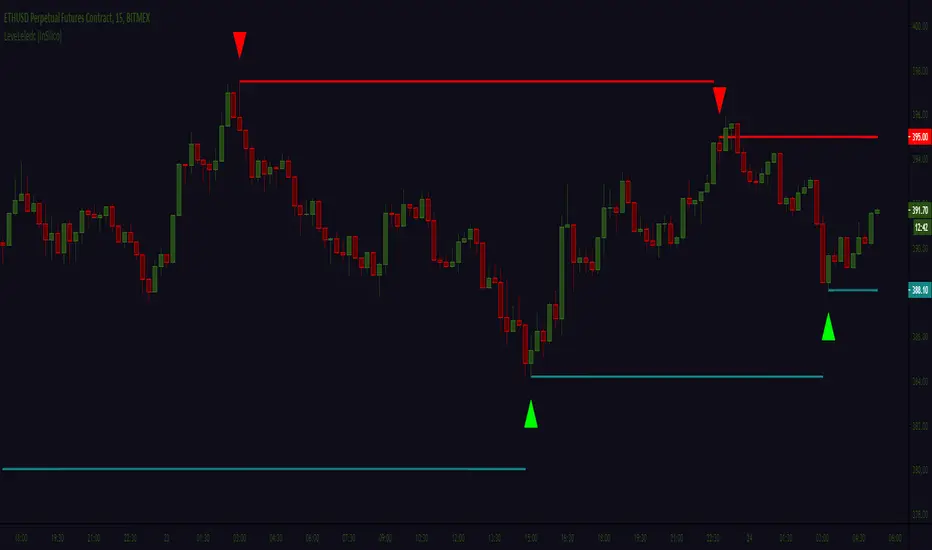
Leledc levels (IS) LeveLeledc - Exhaustion levels (InSilico)
Method for zero confirmation support/resistance level detection using Leledc Exhaustion Bars
Study is extension/mod of glaz script ,its implementing simple but unorthodox use-case for "Leledc Exhaustion Bars"
More information on core function in source scripts page ->
P.s Written quickly and spontaneously
BB-levels_MTFThis indicator draws Bollinger Bands- levels from higher timeframes on the chart's right border as a horizontal support/resistance lines. BB(20)- levels are shown from timeframes MN, 2W, 1W, 1D, 4H and 1H.
Levels are shown both for Standard Deviation 1 (dotted BB25- and BB75- lines) and STD 2 (solid BB0- and BB100- lines), as well as SMA20 (blue BB50- line).
You can choose if you want to see only the lines or the labels also. And you can modify the line's length and width, and the label's position on the screen also.

Simple EMA_Hull_RSI StrategyAnother simple strategy. Crossing EMA & Hull MA and the level of RSI (overbought/oversold) defines long or short.
Can be improved by varying the parameters and adding take profit / stop loss.
Backtest: ETHUSD (Bitmex): 5m

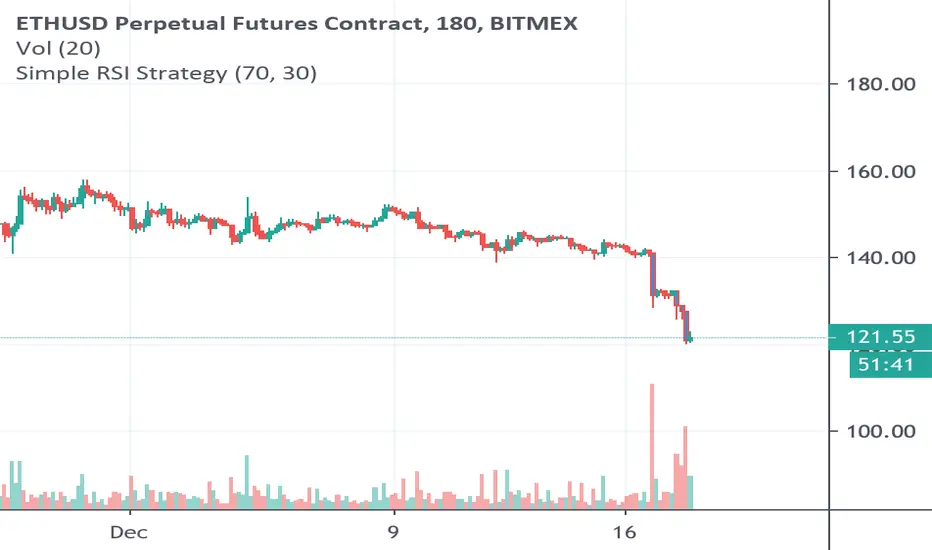
Simple RSI Strategy Buy/Sell at a certain levelSimple Strategy based on RSI, using overbought or oversold levels, defined by us, sell or buy an asset.
Backtest: ETHUSD (Bitmex) - 3h
[SignalFI] H0dl2100K HA Trailer [V1]Welcome! It's my pleasure to bring a fully customized indicator based on @h0dl2100K's HA candle trading system. Through concerted efforts to bring automated trading systems from some of the best technical traders around, SignalFI provides the following features that were approved by @h0dl2100K:
Background
This system is based on the popular HA candle system and using several key levels and indicators of price action that can help identify entry, exit, and trailing stop levels for trading any asset (crypto, stocks, etc). The system is built to be used with HA candles, and provides the following key abilities:
1) HA Candle Doji Detector - HA candles are notorious for their ability to identify trend direction and changes in momentum. One of the easiest ways to identify these trend changes is when HA candles print "Doji candles" or candles that have long wicks on either side of the candle body. This signifies indecision in the market, and after a sustained up or down trend, usually marks a reversal in momentum. The Doji Detector will print label tags identifying potential bull or bear doji's which can be used as entry and exit signals or for identifying confluence with other indicators.
2) MTF Trail Lines - Using previous close levels for higher time frame candles is a cornerstone of trading fundamentals. Levels from the daily timeframe are respected on lower timeframes and can provide key levels to watch for entry or exit conditions to be "just right." The Trail lines are enabled by default and provide static levels on the chart in accordance with the following timeframes (4H, 12H, 1D, 3D, 1W). Both HIGH and LOW values for each timeframe are provided on the chart for easy of determining trailing stop levels or Take Profit levels depending on your trading system and confluence with other indicators.
3) EMA 50/200 - We've also included the notorious EMA trend lines that govern market sentiment from both short- and long-term investors (50 EMA, 200 EMA). These lines change color based on the price being above or below these levels and the levels can be fine-tuned within the settings to your EMA levels of choice.
4) MACD Crosses - We've also included signal tags where default MACD crosses occur to ensure that the trend direction is always presented on one graph. MACD crosses represent a significant sentiment score for trading all assets, and taken with the EMA trend, the HA candle trend, and the MTF Trail Levels can give a very consistent view of where price may be heading.
5) Alerts – It wouldn’t be a system unless we provided alerts to use for ease of notification of the data coming out of the script. For that reason, we have built-in alerts for both the MACD crosses and the Doji Detector. In addition, each Trail level be selected and alerted on to receive updates of when these key levels are crossed above or crossed below.
The H0dl2100K system is the result of years of market analysis and is mean to be a tool for guiding trading decisions in unison with or independently of other indicators. It works remarkably well with IchiEMA, AO and RSI PRIME as they all provide confluence to trading decisions, especially when using HA candles.
SignalFI was created to help traders and investors to effectively analyze the market based on the Golden Mean Ratio (Fibonacci numbers), plan a trade and ultimately execute it. To help inform and educate market decisions we developed a set of Trading Indicators which are available on TradingView.
SignalFI indicators are just that, indicators. Our indicators are generally configured to use completely historical data (negating repaint), and we advise all alerts created with SignalFI indicators to be fired upon "close" of the current candle. Our indicators can provide valuable context and visualization support when performing market analysis and executing buy and sell decisions. However. we are not financial experts, and all information presented on this site or our other media outlets are for educational purposes only.

Combo Backtest 123 Reversal & Cueing Off Sup/Res Levels This is combo strategies for get a cumulative signal.
First strategy
This System was created from the Book "How I Tripled My Money In The
Futures Market" by Ulf Jensen, Page 183. This is reverse type of strategies.
The strategy buys at market, if close price is higher than the previous close
during 2 days and the meaning of 9-days Stochastic Slow Oscillator is lower than 50.
The strategy sells at market, if close price is lower than the previous close price
during 2 days and the meaning of 9-days Stochastic Fast Oscillator is higher than 50.
Second strategy
Cueing Off Support And Resistance Levels, by Thom Hartle
modified by HPotter for trade signals.
The related article is copyrighted material from Stocks & Commodities.
WARNING:
- For purpose educate only
- This script to change bars colors.

Combo Strategy 123 Reversal & Cueing Off Sup/Res Levels This is combo strategies for get a cumulative signal.
First strategy
This System was created from the Book "How I Tripled My Money In The
Futures Market" by Ulf Jensen, Page 183. This is reverse type of strategies.
The strategy buys at market, if close price is higher than the previous close
during 2 days and the meaning of 9-days Stochastic Slow Oscillator is lower than 50.
The strategy sells at market, if close price is lower than the previous close price
during 2 days and the meaning of 9-days Stochastic Fast Oscillator is higher than 50.
Second strategy
Cueing Off Support And Resistance Levels, by Thom Hartle
modified by HPotter for trade signals.
The related article is copyrighted material from Stocks & Commodities.
WARNING:
- For purpose educate only
- This script to change bars colors.
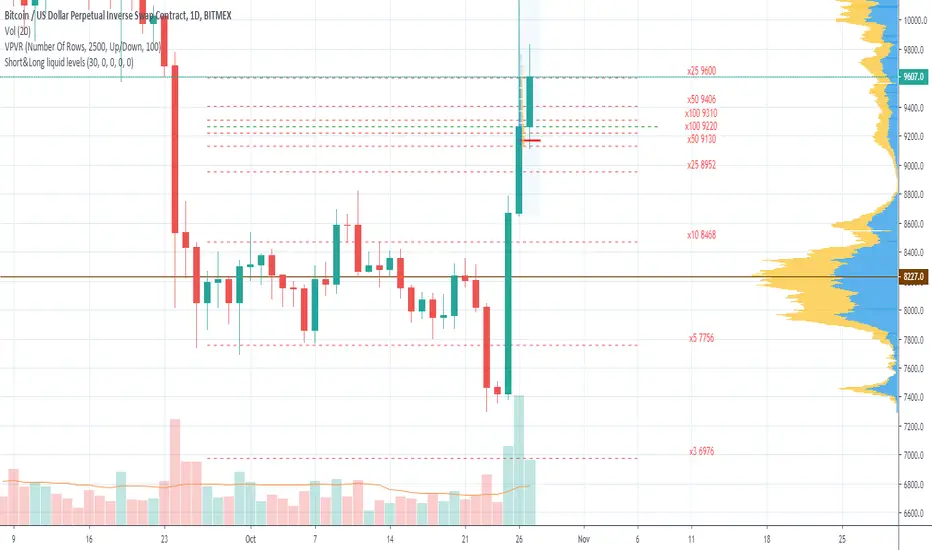
Short&Long liquid levels (XBT & ETH)Shows liquidation levels of marginal LONG and SHORT positions on BITMEX for XBTUSD and ETHUSD pairs.
Levels are calculated from the basis price, which you can change manually. The best choice is using the Volume Profile indicator in conjunction, so you can take POC for the basis price. As well, you can use significant horizontal levels or a middle line of a price channel. In order to prevent chart collapse, last candle open price is used by default.
Indicator presents x100, x50, x25, x10, x5, x3, x2 levels for XBTUSD and x50, x35, x25, x20, x10, x5, x3 for ETHUSD. Each level is marked with labels by default, and you can turn the labels off in the styles menu.
The indicator is only visible on XBTUSD, BTCUSD, BTCUSDT, ETHUSD, ETHUSDT pairs.
You can turn on/off Short or Long liquidation levels.
The basis price is the same for Longs and shorts by default, specify separate price for short if you need.
If you have any advice to improve the indicator or if you find any mistake, please leave your feedback.