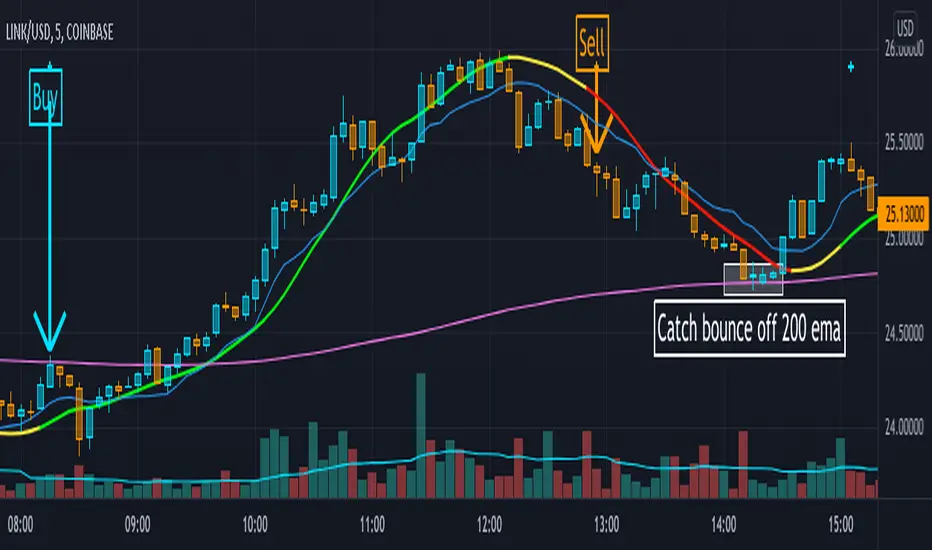
Interpolated Median Volatility LSMA | OttoThis indicator combines trend-following and volatility analysis by enhancing traditional LSMA with percentile-based linear interpolation applied to both the Least Squares Moving Average (LSMA) and standard deviation. Rather than relying on raw values, it uses the interpolated median (50th percentile) to smooth out noise while preserving sensitivity to significant price shifts. This approach produces a cleaner trend signal that remains responsive to real market changes, adapts to evolving volatility conditions, and improves the accuracy of breakout detection.
Core Concept
The indicator builds on these core components:
LSMA (Least Squares Moving Average): A linear regression-based moving average that fits line using user selected source over user defined period. It offers a smoother and more reactive trend signal compared to standard moving averages.
Standard Deviation shows how much price varies from the mean. In this indicator, it’s used to measure market volatility.
Volatility Bands: Instead of traditional Bollinger-style bands, this script calculates custom upper and lower bands using percentile-based linear interpolation on both the LSMA and standard deviation. This method produces smoother bands that filter out noise while remaining adaptive to meaningful price movements, making them more aligned with real market behavior and helping reduce false signals.
Percentile interpolation estimates a specific percentile (like the median — the 50th percentile) from a set of values — even when that percentile doesn't fall exactly on one data point. Instead of selecting a single nearest value, it calculates a smoothed value between nearby points. In this script, it’s used to find the median of past LSMA and standard deviation values, reducing the impact of outliers and smoothing the trend and volatility signals for more robust results.
Signal Logic: A long signal is identified when close price goes above the upper band, and a short signal when close price goes below the lower band.
⚙️ Inputs
Source: The price source used in calculations
LSMA Length: Period for calculating LSMA
Standard Deviation Length: Period for calculating volatility
Percentile Length: Period used for interpolating percentile values of LSMA and standard deviation
Multiplier: Controls the width of the bands by scaling the interpolated standard deviation
📈 Visual Output
Colored LSMA Line: Changes color based on signal (green for bullish, purple for bearish)
Upper & Lower Bands: Volatility bands calculated using interpolated values (green for bullish, purple for bearish)
Bar Coloring: Price bars are colored to reflect signal state (green for bullish, purple for bearish)
Optional Candlestick Overlay: Enhances visual context by coloring candles to match the signal state (green for bullish, purple for bearish)
How to Use
Add the indicator to your chart and look for signals when close price goes above or below the bands.
Long Signal: close Price goes above the upper band
Short Signal: close Price goes below the lower band
🔔 Alerts:
This script supports alert conditions for long and short signals. You can set alerts based on band crossovers to be notified of potential entries/exits.
⚠️ Disclaimer:
This indicator is intended for educational and informational purposes only. Trading/investing involves risk, and past performance does not guarantee future results. Always test and evaluate strategies before applying them in live markets. Use at your own risk.
Least Squares Moving Average (LSMA)

Normalized Linear Regression (LSMA) OscillatorNormalized Linear Regression (LSMA) Oscillator
By Nathan Farmer
The Normalized LSMA Oscillator is a trend-following indicator that enhances the classic Linear Regression (LSMA) by applying a range of normalization techniques. This indicator allows traders to smooth out and normalize LSMA signals for better trend detection and dynamic market adaptation.
Key Features:
Configurable Normalization Methods:
This indicator offers several normalization techniques, such as Z-Score, Min-Max, Mean Normalization, Robust Scaler, Logistic Function, and Quantile Transformation. Each method helps in refining LSMA outputs to improve clarity in both trending and ranging market conditions.
Smoothing Options:
Smoothing can be applied after normalization, helping to reduce noise in the signals, thus making trend-following strategies that use this indicator more effective.
Recommended Settings:
Logistic Function Normalization: Recommended length of around 12, based on my preferred signal frequency.
Z-Score Normalization: Medium period (close to the default of 50), based on my preferred signal frequency.
Min-Max Normalization: Medium period, based on my preferred signal frequency.
Mean Normalization: Medium period, based on my preferred signal frequency.
Robust Scaler: Medium period, based on my preferred signal frequency.
Quantile Transformation: Medium period, based on my preferred signal frequency.
Usage:
Designed primarily for trend-following strategies, this indicator adapts well to varying market conditions. Traders can experiment with the various normalization and smoothing settings to match the indicator to their specific needs and market preferences.
Recommendation before usage:
Always backtest the indicator for yourself with respect to how you intend to use it. Modify the parameters to suit your needs, over your preferred time frame, on your preferred asset. My preferences are for the assets I happened to be looking at when I made this indicator. Odds are, you're looking at something else, over a different time frame, in a different market environment than what my settings are tailored for.

Adaptive Volatility-Controlled LSMA [QuantAlgo]Adaptive Volatility-Controlled LSMA by QuantAlgo 📈💫
Introducing the Adaptive Volatility-Controlled LSMA (Least Squares Moving Average) , a powerful trend-following indicator that combines trend detection with dynamic volatility adjustments. This indicator is designed to help traders and investors identify market trends while accounting for price volatility, making it suitable for a wide range of assets and timeframes. By integrating LSMA for trend analysis and Average True Range (ATR) for volatility control, this tool provides clearer signals during both trending and volatile market conditions.
💡 Core Concept and Innovation
The Adaptive Volatility-Controlled LSMA leverages the precision of the LSMA to track market trends and combines it with the sensitivity of the ATR to account for market volatility. LSMA fits a linear regression line to price data, providing a smoothed trend line that is less reactive to short-term noise. The ATR, on the other hand, dynamically adjusts the volatility bands around the LSMA, allowing the indicator to filter out false signals and respond to significant price moves. This combination provides traders with a reliable tool to identify trend shifts while managing risk in volatile markets.
📊 Technical Breakdown and Calculations
The indicator consists of the following components:
1. Least Squares Moving Average (LSMA): The LSMA calculates a linear regression line over a defined period to smooth out price fluctuations and reveal the underlying trend. It is more reactive to recent data than traditional moving averages, allowing for quicker trend detection.
2. ATR-Based Volatility Bands: The Average True Range (ATR) measures market volatility and creates upper and lower bands around the LSMA. These bands expand and contract based on market conditions, helping traders identify when price movements are significant enough to indicate a new trend.
3. Volatility Extensions: To further account for rapid market changes, the bands are extended using additional volatility measures. This ensures that trend signals are generated when price movements exceed both the standard volatility range and the extended volatility range.
⚙️ Step-by-Step Calculation:
1. LSMA Calculation: The LSMA is computed using a least squares regression method over a user-defined length. This provides a trend line that adapts to recent price movements while smoothing out noise.
2. ATR and Volatility Bands: ATR is calculated over a user-defined length and is multiplied by a factor to create upper and lower bands around the LSMA. These bands help detect when price movements are substantial enough to signal a new trend.
3. Trend Detection: The price’s relationship to the LSMA and the volatility bands is used to determine trend direction. If the price crosses above the upper volatility band, a bullish trend is detected. Conversely, a cross below the lower band indicates a bearish trend.
✅ Customizable Inputs and Features:
The Adaptive Volatility-Controlled LSMA offers a variety of customizable options to suit different trading or investing styles:
📈 Trend Settings:
1. LSMA Length: Adjust the length of the LSMA to control its sensitivity to price changes. A shorter length reacts quickly to new data, while a longer length smooths the trend line.
2. Price Source: Choose the type of price (e.g., close, high, low) that the LSMA uses to calculate trends, allowing for different interpretations of price data.
🌊 Volatility Controls:
ATR Length and Multiplier: Adjust the length and sensitivity of the ATR to control how volatility is measured. A higher ATR multiplier widens the bands, making the trend detection less sensitive, while a lower multiplier tightens the bands, increasing sensitivity.
🎨 Visualization and Alerts:
1. Bar Coloring: Customize bar colors to visually distinguish between uptrends and downtrends.
2. Volatility Bands: Enable or disable the display of volatility bands on the chart. The bands provide visual cues about trend strength and volatility thresholds.
3. Alerts: Set alerts for when the price crosses the upper or lower volatility bands, signaling potential trend changes.
📈 Practical Applications
The Adaptive Volatility-Controlled LSMA is ideal for traders and investors looking to follow trends while accounting for market volatility. Its key use cases include:
Identifying Trend Reversals: The indicator detects when price movements break through volatility bands, signaling potential trend reversals.
Filtering Market Noise: By applying ATR-based volatility filtering, the indicator helps reduce false signals caused by short-term price fluctuations.
Managing Risk: The volatility bands adjust dynamically to account for market conditions, helping traders manage risk and improve the accuracy of their trend-following strategies.
⭐️ Summary
The Adaptive Volatility-Controlled LSMA by QuantAlgo offers a robust and flexible approach to trend detection and volatility management. Its combination of LSMA and ATR creates clearer, more reliable signals, making it a valuable tool for navigating trending and volatile markets. Whether you're detecting trend shifts or filtering market noise, this indicator provides the tools you need to enhance your trading and investing strategy.
Note: The Adaptive Volatility-Controlled LSMA is a tool to enhance market analysis. It should be used in conjunction with other analytical tools and should not be relied upon as the sole basis for trading or investment decisions. No signals or indicators constitute financial advice, and past performance is not indicative of future results.

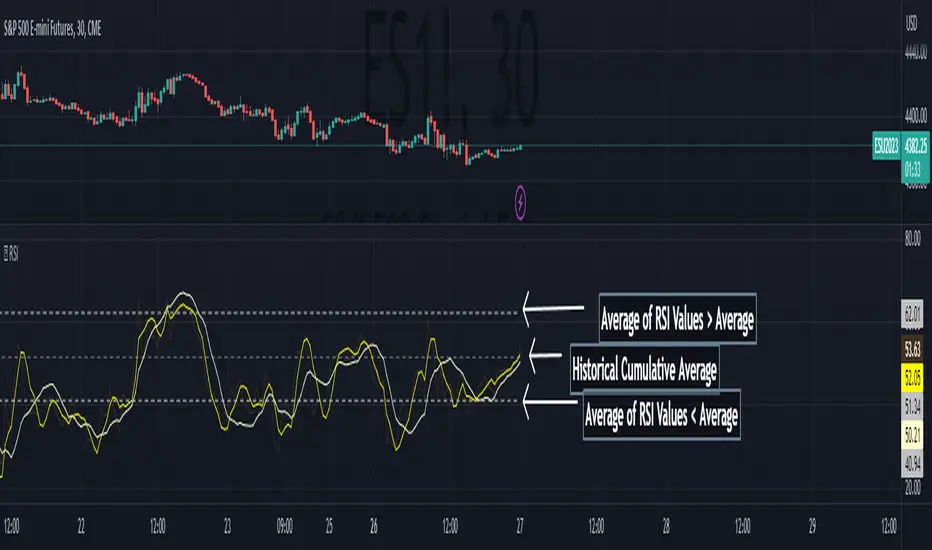
Multi-Length Stochastic Average [LuxAlgo]This indicator returns the average of stochastic oscillators with periods ranging from 4 to length . This allows for a slightly more reactive oscillator as well as having information regarding the position of the price relative to rolling maximums/minimums of different periods.
We introduce settings that allow for pre and post-smoothing, with selectable smoothing methods and periods for both steps.
Settings
Length: Period of the indicator, determine the maximum period of the stochastic oscillator used in the average
Source: Source input of the indicator
Pre-Smoothing (1st Input): Degree of smoothing applied to the source input
Pre-Smoothing (2nd Input): Pre-Smoothing Method
Post-Smoothing (1st Input): Degree of smoothing applied to the final oscillator output
Post-Smoothing (2nd Input): Post-Smoothing Method
Smoothing methods include a simple moving average, a triangular moving average, and a least-squares moving average (this method can induce overshoots during the post-smoothing step). The user can also select "None".
Usages
The "multi-length" aspect of technical indicators is something that hasn't been deeply explored yet such indicators can give us information regarding both short-term and long-term information which was the motivation for the creation of the indicator.
The Multi-length Stochastic Average allows us to quantify the price position relative to a multitude of highest/lowest levels.
In the example above the oscillator returns the average of stochastic oscillators with periods ranging from 4 to 20, as well as multiple rolling minimums with periods ranging from 4 to 20. We can see that when the price is equal to all rolling minimums the oscillator is equal to 0, the oscillator would return 100 if the price were equal to all rolling maximums with periods in that same range.
The oscillator can be interpreted like any scaled oscillator and can be used to estimate trend direction as well as trend strength.
Here we only make of use pre-smoothing by using a period 20 simple moving average. The indicator graphical elements such as colors/circles can help us determine potential directions trends might take.
Circles are displayed when the oscillator crosses over/under the 20/80 level. Such conditions offer better timing than waiting for the oscillator to be greater/lower than 50 and are less subjective to noise than simply looking at the direction taken by the oscillator. However, it can suffer from potential retracements in a trend more easily, this is illustrated in the chart above.

Versatile Moving Average StrategyVersatile Moving Average Strategy (VMAS)
Overview:
The Versatile Moving Average Strategy (VMAS) is designed to provide traders with a flexible approach to trend-following, utilizing multiple types of moving averages. This strategy allows for customization in choosing the moving average type and length, catering to various market conditions and trading styles.
Key Features:
- Multiple Moving Average Types: Choose from SMA, EMA, SMMA (RMA), WMA, VWMA, HULL, LSMA, and ALMA to best suit your trading needs.
- Customizable Inputs: Adjust the moving average length, source of price data, and stop-loss source to fine-tune the strategy.
- Target Percent: Set the percentage difference between successive profit targets to manage your risk and rewards effectively.
- Position Management: Enable or disable long and short positions, allowing for versatility in different market conditions.
- Commission and Slippage: The strategy includes realistic commission settings to ensure accurate backtesting results.
Strategy Logic:
1. Moving Average Calculation: The selected moving average is calculated based on user-defined parameters.
2. Entry Conditions:
- A long position is entered when the entry source crosses over the moving average, if long positions are enabled.
- A short position is entered when the entry source crosses under the moving average, if short positions are enabled.
3. Stop-Loss: Positions are closed if the stop-loss source crosses the moving average in the opposite direction.
4. Profit Targets: Multiple profit targets are defined, with each target set at an incremental percentage above (for long positions) or below (for short positions) the entry price.
Default Properties:
- Account Size: $10000
- Commission: 0.01% per trade
- Risk Management: Positions are sized to risk 80% of the equity per trade, because we get very tight stoploss when position is open.
- Sample Size: Backtesting has been conducted to ensure a sufficient sample size of trades, ideally more than 100 trades.
How to Use:
1. Configure Inputs: Set your preferred moving average type, length, and other input parameters.
2. Enable Positions: Choose whether to enable long, short, or both types of positions.
3. Backtest and Analyze: Run backtests with realistic settings and analyze the results to ensure the strategy aligns with your trading goals.
4. Deploy and Monitor: Once satisfied with the backtesting results, deploy the strategy in a live environment and monitor its performance.
This strategy is suitable for traders looking to leverage moving averages in a versatile and customizable manner. Adjust the parameters to match your trading style and market conditions for optimal results.
Note: Ensure the strategy settings used for publication are the same as those described here. Always conduct thorough backtesting before deploying any strategy in a live trading environment.

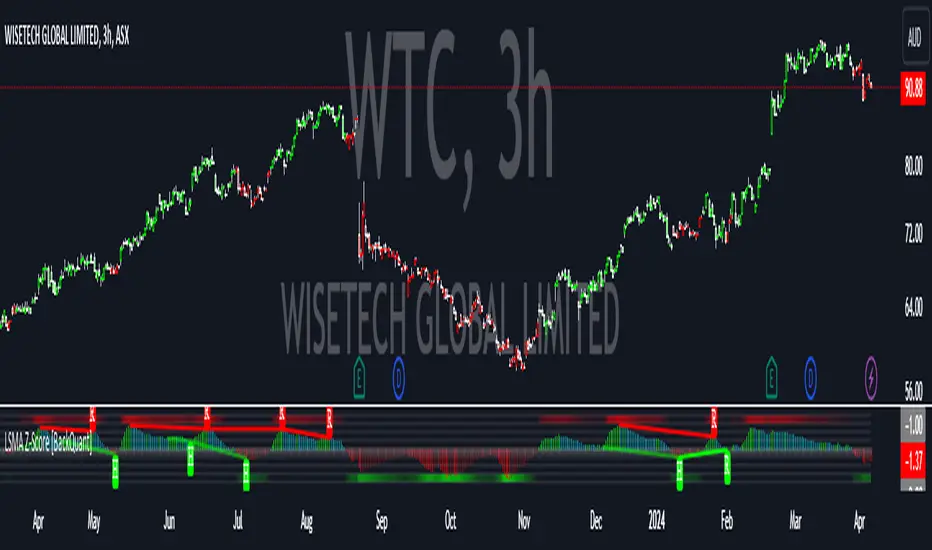
LSMA Z-Score [BackQuant]LSMA Z-Score
Main Features and Use in the Trading Strategy
- The indicator normalizes the LSMA into a detrended Z-Score, creating an oscillator with standard deviation levels to indicate trend strength.
- Adaptive coloring highlights the rate of change and potential reversals, with different colors for positive and negative changes above and below the midline.
- Extreme levels with adaptive coloring indicate the probability of a reversion, providing strategic entry or exit points.
- Alert conditions for crossing the midline or significant shifts in trend direction enhance its utility within a trading strategy.
1. What is an LSMA?
The Least Squares Moving Average (LSMA) is a technical indicator that smoothens price data to help identify trends. It uses the least squares regression method to fit a straight line through the selected price points over a specified period. This approach minimizes the sum of the squares of the distances between the line and the price points, providing a more statistically grounded moving average that can adapt more smoothly to price changes.
2. What is a Z-Score?
A Z-Score is a statistical measurement that describes a value's relationship to the mean of a group of values, measured in terms of standard deviations from the mean. If a Z-Score is 0, it indicates that the data point's score is identical to the mean score. A Z-Score helps in understanding if a data point is typical for a given data set or if it is atypical. In finance, a Z-Score is often used to measure how far a piece of data is from the average of a set, which can be helpful in identifying outliers or unusual data points.
3. Why Turning LSMA into a Z-Score is Innovative and Its Benefits
Converting LSMA into a Z-Score is innovative because it combines the trend identification capabilities of the LSMA with the statistical significance testing of Z-Scores. This transformation normalizes the LSMA, creating a detrended oscillator that oscillates around a mean (zero line), with standard deviation levels to show trend strength. This method offers several benefits:
Enhanced Trend Detection:
- By normalizing the LSMA, traders can more easily identify when the price is deviating significantly from its trend, which can signal potential trading opportunities.
Standardization:
- The Z-Score transformation allows for comparisons across different assets or time frames, as the score is standardized.
Objective Measurement of Trend Strength:
- The use of standard deviation levels provides an objective measure of trend strength and volatility.
4. How It Can Be Used in the Context of a Trading System
This indicator can serve as a versatile tool within a trading system for a range of things:
Trend Confirmation:
- A positive Z-Score can confirm an uptrend, while a negative Z-Score can confirm a downtrend, providing traders with signals to enter or exit trades.
Oversold/Overbought Conditions:
- Extreme Z-Score levels can indicate overbought or oversold conditions, suggesting potential reversals or pullbacks.
Volatility Assessment:
- The standard deviation levels can help traders assess market volatility, with wider bands indicating higher volatility.
5. How It Can Be Used for Trend Following
For trend following strategies, this indicator can be particularly useful:
Trend Strength Indicator:
- By monitoring the Z-Score's distance from zero, traders can gauge the strength of the current trend, with larger absolute values indicating stronger trends.
Directional Bias:
- Positive Z-Scores can be used to establish a bullish bias, while negative Z-Scores can establish a bearish bias, guiding trend following entries and exits.
Color-Coding for Trend Changes :
- The adaptive coloring of the indicator based on the rate of change and extreme levels provides visual cues for potential trend reversals or continuations.
Thus following all of the key points here are some sample backtests on the 1D Chart
Disclaimer: Backtests are based off past results, and are not indicative of the future.
This is using the Midline Crossover:
INDEX:BTCUSD
INDEX:ETHUSD
BINANCE:SOLUSD
Banana RSIBanana RSI is not just ap-PEAL-ing to the eyes!
This simple little indicator provides a New Approach to determining Overbought and Oversold levels, as well as taking advantage of a non-typical smoothing method for this type of indicator.
Banana RSI uses a Cumulative High and Low Average to draw the upper, lower, and midline.
The High and Low Averages use the data only from above or below the Cumulative Average to calculate their respective line.
In simpler terms:
The High average is an average of every value ABOVE the full average.
The Low average is an average of every value BELOW the full average.
This creates an automated method to determine overbought and oversold territory based on the charts historical movement.
Since every chart can be different, these levels change with the chart.
Banana RSI also uses a linear regression smoothing method , by taking advantage of the built-in Least Squares Moving Average, we are able to view a better reacting/less-lagging moving average.
Included are 2 Length-Adjustable LSMA lines to use however needed.
Using the Regression Lines along with the High & Low Averages provides a new view on the classic RSI indicator.
Enjoy!
Moving Average Lab - by InFinitoThe Moving Average Lab allows to create any possible combination of up to 3 given MAs. It is meant to help you find the perfect MA that fits your style, strategy and market type.
This script allows to average, weight, double and triple multiple types and lengths of Moving Averages
Currently supported MA types are:
SMA
EMA
VWMA
WMA
SMMA (RMA)
HMA
LSMA
DEMA
TEMA
Features:
- Double or Triple any type of Moving Average using the same logic used for calculating DEMAs and TEMAs:
In the following example you can see a normal, double and triple 200 VWMA
- Average 2 or 3 different types and lengths of Moving Average:
In the example you can see the average between a Double LSMA and a SMA
- Weight each MA manually:
The example shows the average of an HMA and a VWMA with the HMA having a weight of 2 and the VWMA having a weight of 1
- Average up to 3 personalized MAs:
The example shows the average of an EMA + a Double WMA + a Triple SMA with a 3:2:1 weighting
- Average different Moving Averages with different length each:
The example shows the average of an 800 SMA + a 400 VWMA + a 200 EMA

TOMMAR#TOMMAR #MultiMovingAverages #MMAR
Dear fellow traders, this is Tommy, and today I'd like to introduce you to the Multi-Moving Averages Ribbon (MMAR) indicator, which I believe to be one of the best MMAR indicators available on TradingView. Moving Averages is a popular technical analysis tool used to smooth out price data by creating an average of past price data points over a specified time period. They can be used to identify trends and provide a clearer view of price action, as well as generate buy and sell signals by observing crossovers between different moving average lines.
In the MMAR indicator, we have incorporated 12 different types of Moving Averages, including Simple Moving Averages (SMA), Exponential Moving Averages (EMA), Weighted Moving Averages (WMA), Hull Moving Averages (HMA), and Smoothed Moving Averages (SMMA), among others. This allows traders to choose the optimal type for their preferred trading commodities.
One common technique in technical analysis is using multiple Moving Averages with varying lengths, which provides a more comprehensive view of price action. By analyzing multiple Moving Averages with different timeframes, traders can better understand both short- and long-term trends and make more informed trading decisions. Some of the well-known combinations of multiple moving averages used by traders are (5, 9, 14, 21, 45), (6, 11, 16, 22, 51), [8, 13, 21, 55), (50, 100, 200), and (60, 120, 240).
Another way to gauge the strength of the market trend is to look for the arrangement of the Moving Averages. If they are in a sequential order, with the shortest on top and the longest on the bottom, it is most likely a bullish trend. On the other hand, if they are arranged in reverse order, with the shortest on the bottom and the longest on top, it is most likely a bearish trend. The 'Trend Light' in the indicator settings will automatically signal when the Moving Averages are in either an orderly or reverse arrangement.
Lastly, I have added a useful feature to the indicator: the 'MA Projection'. This feature projects and forecasts the Moving Averages in the future, allowing traders to easily identify confluence zones in future candlesticks. Please note that the projection levels may change in the case of extreme price action that significantly affects the Moving Averages.
This is free so any Tradingview users can use this indicator. Just search TOMMAR in the indicator section located on top of the chart.
#TOMMAR #MultiMovingAverages #MMAR
안녕하세요 트레이더 여러분, 토미입니다. 오늘 여러분들에게 소개드릴 지표는 다양한 길이의 이동평균선 조합을 사용할 수 있는 MMAR (Multiple Moving Averages Ribbon)입니다. 아마 제가 만든 MMAR 지표가 트레이딩뷰에서 가장 쓸만할 겁니다. 이동평균선, 줄여서 이평선은 말 그대로 특정 기간 범위 내의 주가들을 평균한 값들로 이루어진 선입니다. 제가 이평선 관련된 강의 자료는 예전에 올려드린 바 있으니 더 자세한 내용이 궁금하신 분들은 아래 링크/이미지 클릭하시길 바랍니다.
본 지표는 Simple Moving Averages (SMA), Exponential Moving Averages (EMA), Weighted Moving Averages (WMA), Hull Moving Averages (HMA), 그리고 Smoothed Moving Averages (SMMA) 등을 포함해 총 12개 종류의 이평선 지표를 사용할 수 있습니다. 또한 각 이평선의 길이들도 하나하나 일일이 설정하실 수 있습니다. 예를 들어 요즘에 자주 보이는 이평선들의 조합이 , , , , 그리고 등등이 존재하는데 여러분의 취향에 맞게 설정하여 사용하시면 됩니다.
몇 가지 주요 기능에 대해서 설명 드리겠습니다. 설정에서 ‘Trend Light’를 키면 이평선들의 정배열 혹은 역배열 여부를 쉽게 볼 수 있습니다. 이평선이 정배열일때는 맨 아래의 이평선에 초록불이, 역배열일때는 맨 위의 이평선에 빨간불이 켜지며 둘 다 아닐 땐 아무 불도 켜지지 않습니다. 또한 ‘MA Projection’을 키면 이평선들의 미래 예측 값들을 확장해줍니다. 당연히 가격 변동이 갑자기 크게 나오면 이평선 예측 확장 레벨들이 확 바뀌겠죠.
지표창에 TOMMAR 검색하시거나 아래 즐겨찾기 인디케이터에 넣기 클릭하시면 누구나 사용하실 수 있습니다~ 여러분의 구독, 좋아요, 댓글은 저에게 큰 힘이 됩니다.

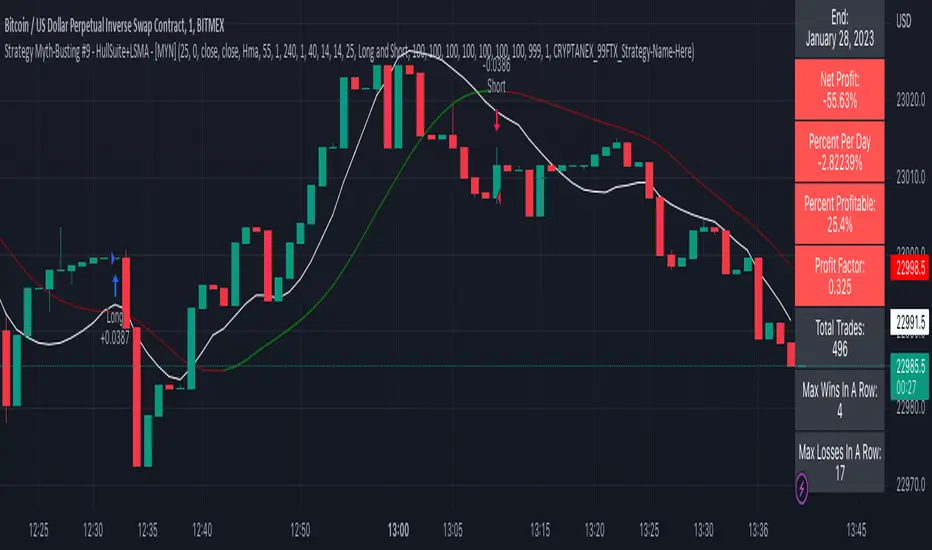
Strategy Myth-Busting #9 - HullSuite+LSMA - [MYN]This is part of a new series we are calling "Strategy Myth-Busting" where we take open public manual trading strategies and automate them. The goal is to not only validate the authenticity of the claims but to provide an automated version for traders who wish to trade autonomously.
Our 9th one is an automated version of the "I Tested The Best 1 Minute Scalping Strategy That Will Blow Your Mind 100 Times" strategy from "Profit Now" who claims to have achieved 36.7% profit scalping XRPUSDT on the 1 minute timeframe in only 15 days. As you can see from the backtest results below, I was unable to substantiate anything remotely close to that that claim on any timeframe or symbol. Myth 10000% busted.
This strategy uses a combination of 2 open-source public indicators: Hull Suite by InSilico and Least Squares Moving Average (LSMA)
The Hull Moving Average (HMA) is a faster version of the traditional moving average and is designed to reduce lag and improve the responsiveness of the average to price changes. In this strategy the HMA is used as a trend-following indicator, When the HMA is rising it is indicative of an upwards trend and when its falling its indicative of a downtrend.
The Least Squares Moving Average (LSMA) used in this strategy is similar to the HMA in that it is designed to reduce lag and improve the responsiveness of the average to price changes. In this strategy the LSMA is used to also not only identify trends but also confirm signals, it also is used to identify possible changes in the trend and market conditions.
When we use these together, the Hull Suite and LSMA indicators provide a complimentary confirmation of trend direction and trend swings. The Hull Suite helps to identify and confirm trends, while the LSMA aids to confirm signals and identify potential changes in market conditions.
The way this strategy is designed is when the Hull Suite HMA is trending up and the LSMA crosses above the HMA, we enter a long condition. When the Hull Suite is trending down and the LSMA crosses below the HMA we take a short position. Because of the low latency of these two indicators this strategy can be used on lower time frames down to 1 minute. On high volatility crypto on the lowest time frames, a 1:4 Risk Ratio should be used. A lower less risk ratio should be used on less volatile archetypes of securities.
If you know of or have a strategy you want to see myth-busted or just have an idea for one, please feel free to message me
Regression Fit Bollinger Bands [Spiritualhealer117]This indicator is best suited for mean reversion trading, shorting at the upper band and buying at the lower band, but it can be used in all the same ways as a standard bollinger band.
It differs from a normal bollinger band because it is centered around the linear regression line, as opposed to the moving average line, and uses the linear regression of the standard deviation as opposed to the standard deviation.
This script was an experiment with the new vertical gradient fill feature.

SUPER MULTI MOVING AVERAGE [Gabbo]📈 Moving Average Indicator Update - Version 2
🔹 New Features and Improvements:
1️⃣ Enhanced MA Selection for Table Lines:
Previously, the indicator did not allow users to choose a different Moving Average type for the table lines. Now, you can select the MA type for the table.
2️⃣ New Table Text Customization Inputs:
Added inputs to choose the table text color and size for a more personalized display.
3️⃣ Improved Input Visibility and Organization:
We’ve reorganized the inputs so that the most commonly used options are now placed at the beginning for quicker and more convenient configuration.
4️⃣ Bug Fixes and Code Improvements:
Minor bugs have been fixed, and the code has been optimized for improved stability and performance. The code is now cleaner and fully functional in version 6.
5️⃣ Cometreon Public Library Integration:
To lighten the code and improve modularity, we’ve integrated the Cometreon public library. This makes the code more efficient and reduces the need to duplicate common functions.
☄️ With this update, the Moving Average indicator becomes even more versatile and user-friendly, offering a refined table interface and enhanced customization options!

Channel SurfingThis is my Channel Surfing indicator. It fires Buy and Sell signals based on multiple conditions. You can use EMAs or LSMAs. You will have to check the box of which moving averages to use once you add it to the chart. It plots EMAs or LSMAs using the different sources Close, Low, and High as the channel to surf. It fires a Buy signal if price crosses the channel up and if there is a pullback into the channel followed by a breakout to the upside. It fires a Sell signal if price crosses the channel down and if there is a pullback into the channel followed buy a breakdown to the down side. I find it works great on the 5 minute SPY chart and the 1 minute chart of ES with the default settings when scalping. You are able to switch between 2 different channels using LSMAs or EMAs. The EMAs has an optional LSMA slope filter for getting rid of some false signals. Let me know if you guys find any other settings or ways to use this and as always I hope it helps.

MTF EMA Ribbon & Bands + BBMulti Timeframe Exponential Moving Average Ribbon & Bands + Boillinger Bands
I used the script "EMA Ribbon - low clutter, configurable " by adam24x, I made some color change and I added a few indicators (Boillinger Bands, EMA on multi timeframe and EMA bands from "34 EMA Bands " by VishvaP).
The script can display various EMA from the chart's timeframe but also EMA from other timeframes.
Bollinger Bands and EMA bands can also be added to the chart.

AMACD - All Moving Average Convergence DivergenceThis indicator displays the Moving Average Convergane and Divergence ( MACD ) of individually configured Fast, Slow and Signal Moving Averages. Buy and sell alerts can be set based on moving average crossovers, consecutive convergence/divergence of the moving averages, and directional changes in the histogram moving averages.
The Fast, Slow and Signal Moving Averages can be set to:
Exponential Moving Average ( EMA )
Volume-Weighted Moving Average ( VWMA )
Simple Moving Average ( SMA )
Weighted Moving Average ( WMA )
Hull Moving Average ( HMA )
Exponentially Weighted Moving Average (RMA) ( SMMA )
Symmetrically Weighted Moving Average ( SWMA )
Arnaud Legoux Moving Average ( ALMA )
Double EMA ( DEMA )
Double SMA (DSMA)
Double WMA (DWMA)
Double RMA ( DRMA )
Triple EMA ( TEMA )
Triple SMA (TSMA)
Triple WMA (TWMA)
Triple RMA (TRMA)
Linear regression curve Moving Average ( LSMA )
Variable Index Dynamic Average ( VIDYA )
Fractal Adaptive Moving Average ( FRAMA )
If you have a strategy that can buy based on External Indicators use 'Backtest Signal' which returns a 1 for a Buy and a 2 for a sell.
'Backtest Signal' is plotted to display.none, so change the Style Settings for the chart if you need to see it for testing.

Ratings AlgoThe ratings algo is my discount version of the many paid-for algorithms put out by numerous different companies. A technical "rating" (by default between -10 and 10) is produced for each candle, telling the user when to buy, sell, or hold. I took 11 of my personal favorite indicators to develop a rating system. They are:
50/200 SMA crossover
10/20 SMA crossover
10/20 LSMA crossover
10/20 EMA crossover
"Arnold" a rate-of-change analysis of a smoothed LSMA
PVT and OBV momentum
MACD
RSI
DMI
Fisher Transform
The ratings system is very basic (a more complex, detailed version will be coming in the future!) where each indicator returns -1, 0, or 1, and the MAs and Oscillators are stratified with a user-defined weighting. The total calculation is based on the function:
maweight * (average of MA ratings) + oscillator weight * (average of osc ratings)
If the total value > user-defined threshold, the bar is teal, and if > 2.5 * threshold, is green, and vice versa for orange/red respectively. Purple is given if the total value is close to zero.
"Strong" signals are printed if the bar changes to either green or red and exits are printed if the bars change from green/red to any other color.
A table is also produced showing what each indicator is indicating, either "Buy" "Sell" or "Hold.
Reversal Bands are printed, intended to be used as areas where a trade might be exited if the market is sideways. If a Strong Buy signal is produced, it may be a good idea to enter the trade, and hold until the price enters the reversal bands, then hold until a candle closes outside the band for the first time.
This indicator truly shines in trending markets (like most indicators), but with very fast-acting exit signals and reversal zones, will facilitate minimal losses and possibly even profits in sideways markets.

Find Best Performing MA For Price CrossoverHello!
This script calculates the average percentage gain/loss following a price crossover of a moving of any length, up until prices cross back under the MA.
The script calculates the average number of candles that the source (i.e. close, open, low, ohlc4) remains above the moving average until crossing back under, in addition to the number of crosses. Performance is listed from best to worst; descending order. Also listed is the HIGHEST cumulative gains of ALL tested moving averages.
The moving average length can be changed to any number, so long as there are enough data points, on ANY timeframe and the script will recalculate.

Find Best Performing MA For Golden CrossHello!
This script calculates the performance of any asset following a golden cross of two moving averages of any length!
The calculated moving averages are: SMA, EMA, HMA, VWMA, WMA, LSMA, and ALMA
The best performing moving average for the selected data series is listed first, followed by a descending order.
The indicator works on any timeframe, any asset, and can even be used on indicators such as RSI, %b, %k, etc.
The Moving Average Length and Source Are Customizable!
The Moving Averages Can Be Plotted on Most Data Series, Such As:
Close, Open, Low, hlc3, RSI, %B, %K, Etc.
The Script Will Recalculate for the Timeframe (1m, 5m, D, etc.)!
The (XX Candles) Indicates the Average Number of
Sessions the Shorter Ma Remains Above the Longer Ma Following an Upside Cross!
The Percentages (XX.XX%) Indicate the Average
Percentage Price Gain/Loss Following a Golden Cross,
Until the Shorter Ma Crosses Back Under the Longer Ma!
In This Example I Am Using a 63 Session Length for the
Shorter Ma for All Listed Ma Types for Closing Prices, and a 196 Candle Length for the Longer Ma!

BUY/SELL SIGNALS from LSMA/ALMA/HMAThis indicator uses the Least Squares Moving Average (LSMA) in tandem with the Arnaud Legoux Moving Average (ALMA) and Hull Moving Average (HMA) to generate buy-sell signals, represented by the light blue and orange crosses respectively.
The yellow lines produced by the indicator show periods of market uncertainty and possible reversal, and a modified, user-defined VWAP is given along with a 200 EMA. The point of this indicator was to create a smoother, more visually appealing moving-average, price action-based indicator when compared to the trend-step and simple moving average indicators available. This indicator uses a fast (25 period) LSMA coupled with a slower (50 period) HMA and ALMA in order to make signals both smooth and fast.
This indicator will work on all markets, except the modified VWAP will naturally not function if the volume is unpublished for that market. Use of this indicator will be very strong in trending markets, as the yellow line will spot possible reversals quite early, meaning the trader can be ready early for the buy/sell signal to appear. Use of this indicator in sideways market conditions will be limited, as it is for all moving average-based indicators, but the damage will be minimal as bad trades will be quickly realized by the indicator and the color will switch to yellow, this is possible because of the settings differences between the period lengths of the LSMA vs the ALMA + HMA.
MA VisualizerThe MA Visualizer is made up of 5 Moving Averages (MA)
All MA change color when the price closes above or below the MA line.
The background between the MA line and price will also change color, this creates the Visualizer.
When two or more MA are selected the two visualizer's will combine and create a gradient effect.
Each MA can be adjusted with 6 source selection's to choose from (SMA , EMA , WMA , HMA , RMA , WVMA).
The Visualizer can be turned off while leaving the MA lines turned on and vice versa.
Their is also a MA Cross indicator built-in.

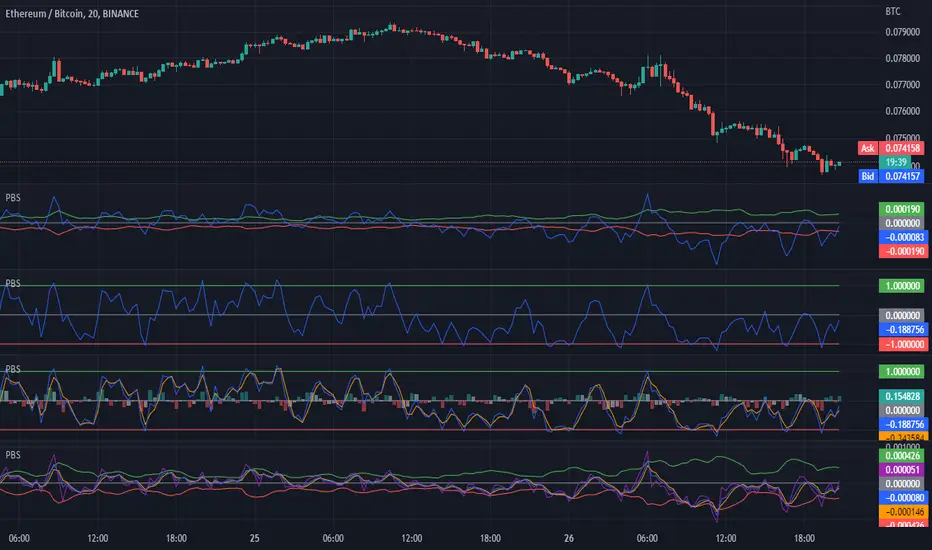
H/L Price Band with Signal Line (PBS)This indicator centers a moving average around the hl2 of the price. This is calculated as the difference of two moving averages. The upper band is a 9 period exponential moving average, the lower band is a 7 period moving average and the center line is the average between the two. The "Fast Line" is our signal line in this oscillator. When the price is hovering around the center of the band this indicates that a trend is pausing or reversing. When the fast line exits the band this could be a buy or sell signal. It could also indicate a very strong trend in that direction. To get the optimal entry and exit you might want to wait for the price to return to the center line. In addition to the basic functionality of this indicator I have added some bonus features. You can enable the "Slow Line" or the "Long Line" to enhance your signals. When the fast line is above the slow/long line you are in an up trend and inversely when the fast line is below the slow/long line you are in a down trend. The crossing of these lines can indicate a reversal. I have also included a "J" style amplification line. This works by enhancing the difference between the Fast and Slow/Long line to make it more visually apparent. You can also configure the "J" line to be calculated between either the slow or long line. Finally I have added the feature to amplify the band width by the standard deviation. This is set to 1 by default but you can also get a more responsive signal by setting this to 0.
This indicator works in most markets. There is a tool tip for every aspect of this indicator explaining how everything works. I hope you are very profitable with this one!
If you find this indicator is useful to you, Star it, Follow, Donate, Like and Share.
Your support is a highly motivation for me.
Keltner Channel With User Selectable Moving AvgKeltner Channel with user options to calculate the moving average basis and envelopes from a variety of different moving averages.
The user selects their choice of moving average, and the envelopes automatically adjust. The user may select a MA that reacts faster to volatility or slower/smoother.
Added additional options to color the envelopes or basis based on the current trend and alternate candle colors for envelope touches. The script has a rainbow gradient by default based on RSI.
Options (generally from slower/smoother to faster/more responsive to volatility):
SMMA,
SMA,
Donchian, (Note: Selecting Donchian will just convert this indicator to a regular Donchian Channel)
Tillson T3,
EMA,
VWMA,
WMA,
EHMA,
ALMA,
LSMA,
HMA,
TEMA
Value Added:
Allows Keltner Channel to be calculated from a variety of moving averages other than EMA/SMA, including ones that are well liked by traders such as Tillson T3, ALMA, Hull MA, and TEMA.
Glossary:
The Hull Moving Average ( HMA ), developed by Alan Hull, is an extremely fast and smooth moving average . In fact, the HMA almost eliminates lag altogether and manages to improve smoothing at the same time.
The Exponential Hull Moving Average is similar to the standard Hull MA, but with superior smoothing. The standard Hull Moving Average is derived from the weighted moving average ( WMA ). As other moving average built from weighted moving averages it has a tendency to exaggerate price movement.
Weighted Moving Average: A Weighted Moving Average ( WMA ) is similar to the simple moving average ( SMA ), except the WMA adds significance to more recent data points.
Arnaud Legoux Moving Average: ALMA removes small price fluctuations and enhances the trend by applying a moving average twice, once from left to right, and once from right to left. At the end of this process the phase shift (price lag) commonly associated with moving averages is significantly reduced. Zero-phase digital filtering reduces noise in the signal. Conventional filtering reduces noise in the signal, but adds a delay.
Least Squares: Based on sum of least squares method to find a straight line that best fits data for the selected period. The end point of the line is plotted and the process is repeated on each succeeding period.
Triple EMA (TEMA) : The triple exponential moving average (TEMA) was designed to smooth price fluctuations, thereby making it easier to identify trends without the lag associated with traditional moving averages (MA). It does this by taking multiple exponential moving averages (EMA) of the original EMA and subtracting out some of the lag.
Running (SMoothed) Moving Average: A Modified Moving Average (MMA) (otherwise known as the Running Moving Average (RMA), or SMoothed Moving Average (SMMA)) is an indicator that shows the average value of a security's price over a period of time. It works very similar to the Exponential Moving Average, they are equivalent but for different periods (e.g., the MMA value for a 14-day period will be the same as EMA-value for a 27-days period).
Volume-Weighted Moving Average: The Volume-weighted Moving Average (VWMA) emphasizes volume by weighing prices based on the amount of trading activity in a given period of time. Users can set the length, the source and an offset. Prices with heavy trading activity get more weight than prices with light trading activity.
Tillson T3: The Tillson moving average a.k.a. the Tillson T3 indicator is one of the smoothest moving averages and is both composite and adaptive.

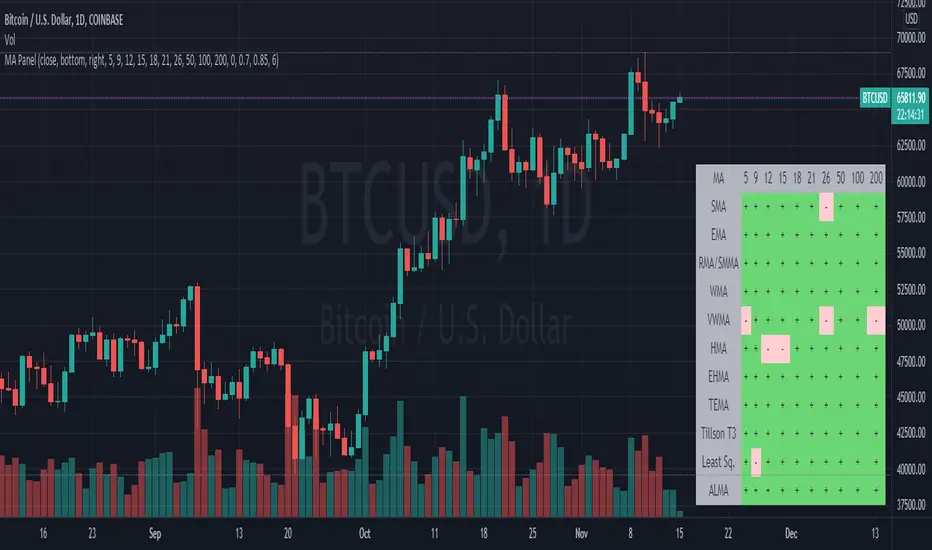
Moving Average PanelThis indicator calculates many different moving averages and displays whether they are increasing or decreasing as a panel/table instead of a plot. Rows/columns can be removed from the table as needed in the options menu, there is also a mobile friendly/compact option as well as a location option.
Note: This script is large and may take a few moments to load.
Note: If there is not enough data, will default to bearish/decreasing.
Value Added
This is the most complete and transparent moving average panel/table indicator. Unlike things such as the Technical Ratings, you can see what components are increasing or decreasing.
There may be some advantage in judging if a trend is likely to reverse or not based on the MA's with less lag.
Good for quick screening of charts.
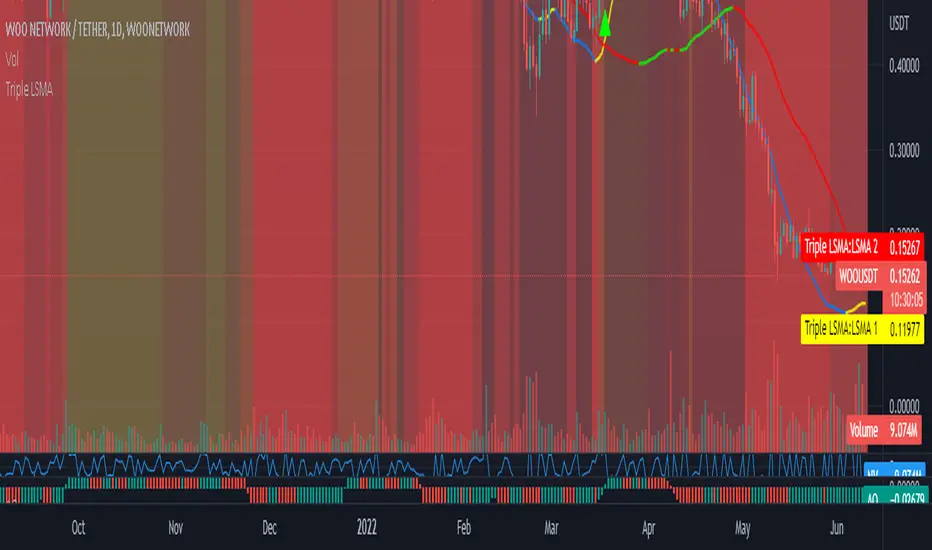
Triple Colored Least Squares Moving Average + Crossover AlertsThis script is forked from the ‘ Double Colored Least Squares Moving Average + Crossover Alerts ‘ from @IronKnightmare.
First release & notes : 2021-11-03.
Overview:
The Least Squares Moving Average is used mainly as a crossover signal to identify bullish or bearish trends. When a shorter duration line cross a longer one a trend can be identified. When multiple lines or the price action cross a longterm trend the confirmation can be further validated. Tradingview contains already some indicators with 1 or two LSMA trendlines that can be configured and toggled.
The original script that I forked had two LSMA lines that could be plotted with other valuable functions, I added a third for further confirmation as some trading systems will use three lines or some combination of those for validation.
Usage:
In inputs
- You will see LSMA 1, LSMA 2 & LSMA 3. The default values are 40, 100 & 400 representing the number of periods plotted by that line : fast, medium and slow changing trendlines will be plotted. The offset value and source are standard for most scripts.
In Style
- You can toggle LSMA 1, 2 or 3 and any combination of those. There are much more possibilities this way.
- For each LSMA, Color 0 & Color 1 are for coloring the slope of the trendline,
- Color 0 for rising slope,
- Color 1 for descending slope.
- The script will automatically color the rise or fall of the trendline accordingly. You can also set one identical color in both slopes for one unique color.
- The ‘ Long Crossover 1 on 2 ’ is a signal for when the LSMA 1 cross over the LSMA 2, usually a shorter periods trendline, more volatile, climbing over the medium term one. A Signal will be traced on the chart at that crossing, you can configure this. The ‘Short Crossover 1 on 2’ is when the LSMA 1 cross under the LSMA 2, a signal will be traced on the chart accordingly.
- The Long Crossover 1 on 3 & Short Crossover 1 on 3 act on the same principle, although the crossing of the fast LSMA on the long / slow LSMA are used. Both can be toggled.
- The ‘ Background Coloring Line 1 : 0-Neutral, 1-Up, 2-Down ’ is an optional background coloring for the LSMA1 line. This can provide additional information at a quick glance, especially if you combine the two other lines backgrounds, the partial transparency will compound.