Linear Regression Curve - AverageIdea is that the average of price has something to do with sudden changes in trend. Finding trend shifts in mundane.
Least Squares Moving Average (LSMA)
General Filter Estimator-An Experiment on Estimating EverythingIntroduction
The last indicators i posted where about estimating the least squares moving average, the task of estimating a filter is a funny one because its always a challenge and it require to be really creative. After the last publication of the 1LC-LSMA , who estimate the lsma with 1 line of code and only 3 functions i felt like i could maybe make something more flexible and less complex with the ability to approximate any filter output. Its possible, but the methods to do so are not something that pinescript can do, we have to use another base for our estimation using coefficients, so i inspired myself from the alpha-beta filter and i started writing the code.
Calculation and The Estimation Coefficients
Simplicity is the key word, its also my signature style, if i want something good it should be simple enough, so my code look like that :
p = length/beta
a = close - nz(b ,close)
b = nz(b ,close) + a/p*gamma
3 line, 2 function, its a good start, we could put everything in one line of code but its easier to see it this way. length control the smoothing amount of the filter, for any filter f(Period) Period should be equal to length and f(Period) = p , it would be inconvenient to have to use a different length period than the one used in the filter we want to estimate (imagine our estimation with length = 50 estimating an ema with period = 100) , this is where the first coefficients beta will be useful, it will allow us to leave length as it is. In general beta will be greater than 1, the greater it will be the less lag the filter will have, this coefficient will be useful to estimate low lagging filters, gamma however is the coefficient who will estimate lagging filters, in general it will range around .
We can get loose easily with those coefficients estimation but i will leave a coefficients table in the code for estimating popular filters, and some comparison below.
Estimating a Simple Moving Average
Of course, the boxcar filter, the running mean, the simple moving average, its an easy filter to use and calculate.
For an SMA use the following coefficients :
beta = 2
gamma = 0.5
Our filter is in red and the moving average in white with both length at 50 (This goes for every comparison we will do)
Its a bit imprecise but its a simple moving average, not the most interesting thing to estimate.
Estimating an Exponential Moving Average
The ema is a great filter because its length times more computing efficient than a simple moving average. For the EMA use the following coefficients :
beta = 3
gamma = 0.4
N.B : The EMA is rougher than the SMA, so it filter less, this is why its faster and closer to the price
Estimating The Hull Moving Average
Its a good filter for technical analysis with tons of use, lets try to estimate it ! For the HMA use the following coefficients :
beta = 4
gamma = 0.85
Looks ok, of course if you find better coefficients i will test them and actualize the coefficient table, i will also put a thank message.
Estimating a LSMA
Of course i was gonna estimate it, but this time this estimation does not have anything a lsma have, no moving average, no standard deviation, no correlation coefficient, lets do it.
For the LSMA use the following coefficients :
beta = 3.5
gamma = 0.9
Its far from being the best estimation, but its more efficient than any other i previously made.
Estimating the Quadratic Least Square Moving Average
I doubted about this one but it can be approximated as well. For the QLSMA use the following coefficients :
beta = 5.25
gamma = 1
Another ok estimate, the estimate filter a bit more than needed but its ok.
Jurik Moving Average
Its far from being a filter that i like and its a bit old. For the comparison i will use the JMA provided by @everget described in this article : c.mql5.com
For the JMA use the following coefficients :
for phase = 0
beta = pow*2 (pow is a parameter in the Jma)
gamma = 0.5
Here length = 50, phase = 0, pow = 5 so beta = 10
Looks pretty good considering the fact that the Jma use an adaptive architecture.
Discussion
I let you the task to judge if the estimation is good or not, my motivation was to estimate such filters using the less amount of calculations as possible, in itself i think that the code is quite elegant like all the codes of IIR filters (IIR Filters = Infinite Impulse Response : Filters using recursion) .
It could be possible to have a better estimate of the coefficients using optimization methods like the gradient descent. This is not feasible in pinescript but i could think about it using python or R.
Coefficients should be dependant of length but this would lead to a massive work, the variation of the estimation using fixed coefficients when using different length periods is just ok if we can allow some errors of precision.
I dont think it should be possible to estimate adaptive filter relying a lot on their adaptive parameter/smoothing constant except by making our coefficients adaptive (gamma could be)
So at the end ? What make a filter truly unique ? From my point of sight the architecture of a filter and the problem he is trying to solve is what make him unique rather than its output result. If you become a signal, hide yourself into noise, then look at the filters trying to find you, what a challenging game, this is why we need filters.
Conclusion
I wanted to give a simple filter estimator relying on two coefficients in order to estimate both lagging and low-lagging filters. I will try to give more precise estimate and update the indicator with new coefficients.
Thanks for reading !
1LC-LSMA (1 line code lsma with 3 functions)Even Shorter Estimation
I know that i'am insistent with the lsma but i really like it and i'm happy to deconstruct it like a mad pinescript user. But if you have an idea about some kind of indicator then dont hesitate to contact me, i would be happy to help you if its feasible.
My motivation for such indicator was to use back the correlation function (that i had putted aside in the ligh-lsma code) and provide a shorter code than the estimation using the line rescaling method (see : Approximating A Least Square Moving Average In Pine) .
The Method
Fairly simple, lets name y our estimation, we calculate it as follow:
y = x̄ + r*o*1.7
where x̄ is the price moving average, r the correlation between the price and a line (or n) and o the standard deviation. If plotted against a classic lsma the difference would be meaningless at first glance so lets plot the absolute value between the difference of the lsma and our estimation of both period 100.
The difference is under 0.0000 on eurusd, its really low.
In general the longer the period of the estimation, the lower the difference between a normal lsma, but when using shorter period they can differ a little bit.
Why 1.7 ?
We need to multiply the standard deviation by a constant in order to match the overshoot and the rise-time of the original lsma. The constant 1.7 is one that work well but actually this constant should be dependant of the length period of the filter to make the estimation more accurate.
More About Step-Response
Most of the time when a filter have less lag, it mean that he induce overshoot in order to decrease the rise-time . Rise-time is the time the output take to match the target input, its related to the lag. Overshoot mean that the output exceed the target input, you can clearly see those concept in the image above.
Conclusion
I've showed that its possible to be even more concise about the code it take to estimate an lsma. I've also briefly explained the concept of rise-time and overshoot, concepts really important to signal processing and particularly in filter design. I'm sure that it can be even more simplified and i have some ideas for such estimate.
Thanks for reading !
Light LSMAEstimating the LSMA Without Classics Parameters
I already mentioned various methods in order to estimate the LSMA in the idea i published. The parameter who still appeared on both the previous estimation and the classic LSMA was the sample correlation coefficient. This indicator will use an estimate of the correlation coefficient using the standard score thus providing a totally different approach in the estimation of the LSMA. My motivation for such indicator was to provide a different way to estimate a LSMA.
Standardization
The standard score is a statistical tool used to measure at how many standard deviations o a data point is bellow or above its mean. It can also be used to rescale variables, this conversion process is called standardizing or normalizing and it will be the basis of our estimation.
Calculation : (x - x̄)/o where x̄ is the moving average of x and o the standard deviation.
Estimating the Correlation Coefficient
We will use standardization to estimate the correlation coefficient r . 1 > r > -1 so in (y - x̄)/o we want to find y such that y is always above or below 1 standard deviation of x̄ , i had for first idea to pass the price through a band-stop filter but i found it was better to just use a moving average of period/2 .
Estimating the LSMA
We finally rescale a line through the price like mentioned in my previous idea, for that we standardize a line and we multiply the result by our correlation estimation, next we multiply the previous calculation by the price standard deviation, then we sum this calculation to the price moving average.
Comparison of our estimate in white with a LSMA in red with both period 50 :
Working With Different Independents Variables
Here the independent variable is a line n (which represent the number of data point and thus create a straight line) but a classic LSMA can work with other independent variables, for exemple if a LSMA use the volume as independent variable we need to change our correlation estimate with (ȳ - x̄)/ô where ȳ is the moving average of period length/2 of y, y is equal to : change(close,length)*change(volume,length) , x̄ is the moving average of y of period length , and ô is the standard deviation of y. This is quite rudimentary and if our goal is to provide a easier way to calculate correlation then the product-moment correlation coefficient would be more adapted (but less reactive than the sample correlation) .
Conclusion
I showed a way to estimate the correlation coefficient, of course some tweaking could provide a better estimate but i find the result still quite close to the LSMA.
Least Squares Moving Average with BackColorLeast Squares Moving Average.
This indicator change the back color to the LSMA slope.
Function for Least Squares Moving AverageThank you to alexgrover for putting me wide to this, after putting up with long conversations and stupid questions. Follow him and behold: www.tradingview.com
What is this?
This is simply the function for a Least Squares Moving Average. You can render this on the chart by using the linreg() function in Pine.
Personally I like to use the slope of the LSMA to help determine what direction to take a trade in, but I'm sure there are other, more exotic ways of using it and, if you know how to get your fingers dirty with Pine, you can create more exotic versions of it by modifying the function provided.
Want to learn?
If you'd like the opportunity to learn Pine but you have difficulty finding resources to guide you, take a look at this rudimentary list: docs.google.com
The list will be updated in the future as more people share the resources that have helped, or continue to help, them. Follow me on Twitter to keep up-to-date with the growing list of resources.
Suggestions or Questions?
Don't even kinda hesitate to forward them to me. My (metaphorical) door is always open.
Adaptive Least SquaresAn adaptive filtering technique allowing permanent re-evaluation of the filter parameters according to price volatility. The construction of this filter is based on the formula of moving ordinary least squares or lsma , the period parameter is estimated by dividing the true range with its highest. The filter will react faster during high volatility periods and slower during low volatility ones.
High smooth parameter will create smoother results, values inferior to 3 are recommended.
You can easily replace the parameter estimation method as long as the one used fluctuate in a range of , for example you can use the efficiency ratio
ER = abs(change(close,length))/sum(abs(change(close)),length)
Or the Fractal Dimension Index , in fact any values will work as long as they are rescaled (stoch(value,value,value,length)/100)
For any suggestions/questions feel free to send me a message :)
CMF+CMF+ is a CMF study enhanced with a linear regression moving average.
Default Settings:
CMF: 13
Linear Regression of CMF: 34
Activate Vertical Bar Highlights and/or Signal Flags for:
- CMF Oversold/Overbought. (Default: Highlight Bar)
- CMF Extended Oversold/Overbought. (Default: Highlight Bar)
- CMF crossing its Linear Regression . (Default: Signal Flag)
Users can also do extra tuning in Style Section of Format options.
To use this indicator we need to observe the market's behaviour and identify which settings are fit for the timeframe and type market you trading.
Recommended suggested settings
CMF: 13/14
Linear Regression of CMF: 34/21
The market behaves differently when the pacing changes, volatility change and, when it trends or when it ranges. Develop an understanding of it with the help of this study.
Avoid risking more than 1% per trade. Be responsible for always making a priority about protecting capital and managing risk.
All Moving averagesI have added an option to turn on or off any Moving average by choice and if needed, Heikin-ashi used as source (instead of close)
List of Moving Averages which you can use
T3 - Tillson Moving Average
DEMA - Double Exponential Moving Average
ALMA - Arnaud Legoux moving average
LSMA - Least Squares Moving Average
MA - Simple Moving Average
EMA - Exponential Moving Average
WMA - Weighted Moving Average
SMMA -The Smoothed Moving Average
TEMA - triple exponential moving average
HMA - The Hull Moving Average
AMA - Adaptive Moving Average
FAMA - Fractal Adaptive Moving Average
VIDYA - Variable Index Dynamic Average
TRIMA - Triangular Moving Average
Consider a tip in ETH to
0xac290B4A721f5ef75b0971F1102e01E1942A4578
Thank you and have a nice day
CryptoJoncis
Major Moving AveragesThis script includes the 100 & 200 SMA, EMA, WMA, VWMA, RMA, HMA, LSMA. You can turn off the one's you don't want under Style.
Major LSMAAdds the 25, 50, 100, 150, 200 LSMA in one indicator. Price shows incredible reactions to these on all timeframes.
Least Squares Guppy Multiple Moving Average名前のとおり
GMMAの説明は自分でお探しくだいさい
As the name implies
Please explain GMMA by yourself
Godmode3.2+LSMAThis script has been based on ProwdClown's instructions of usage.
GM settings 9, 6, 3 should be used, LSMA 25, 0 has been implemented.
Original author for main script: LazyBear, xSilas and Ni6HTH4wK, modified By sco77m4r7in and oh92, later modified By scilentor.
Auto-FilterA least squares filter using the Auto line as source, practical for noise removal without higher phase shift.
Its possible to create another parameter for the auto-line length, just add a parameter Period or whatever you want.
r = round(close/round)*round
dev = stdev(close,Period)
Hope you enjoy :)
DepthHouse - Trend & Reversal CandlesticksDepth House Trend and Reversal Candlestick Indicato r is a custom trading tool designed to help traders determine trend direction, and possible trend reversal points.
Here is a video which I give a brief overview and show it in action:
youtu.be
How it works:
Based on the default settings, there are 5 primary colors that each have their own possible signal.
The colors are:
Green - Trending upwards
Red – Trending downwards
Lime –Trending upwards with a chance of reversal
Orange – Trending downwards with a chance of reversal
Grey – General trend is unknown
Please Note: There are NOT trading signals. Each colored candle represents nothing other than a possibility of which way the trend may go. Be sure to use your own adequate analysis. Use at your own financial risk.
How to get:
As you can see this is an invite only script. In the coming months this indicator, along with many others will become pay to use only. (website on my profile page)
However all my indicators will be FREE until May 1, 2018 . So please try them out!
To take advantage of this FREE trial:
1. Subscribe to my YouTube channel. I have many more videos to come! Maybe even leave a comment of what you would like to see next!
2. Comment on this indicator post! Maybe even give me a follow :D
I hope you all enjoy!!
Indicator website: depthhouse.com
Kozlod - Yet Another Moving Average Cross Alerts (9 MA types)You can choose one of these MA types in params:
Simple Moving Average ( SMA )
Exponential Moving Average ( EMA )
Weighted Moving Average ( WMA )
Arnaud Legoux Moving Average ( ALMA )
Hull Moving Average ( HMA )
Volume-weighted Moving Average ( VWMA )
Least Square Moving Average ( LSMA )
Smoothed Moving Average ( SMMA )
Double Exponential Moving Average ( DEMA )
Also you can select SL/PT % levels.
There are 4 alerts available: LONG/SHORT/EXIT LONG/EXIT SHORT
Same script as strategy:
Multi-Bollinger [DW]This is an experimental study designed to visualize trend activity and volatility using a set of two Bollinger Bands calculated with a basis moving average type of your choice.
The available moving averages in this script are:
-Exponential Moving Average
-Simple Moving Average
-Weighted Moving Average
-Volume Weighted Moving Average
-Hull Moving Average
-Least Squares Moving Average
-Arnaud Legoux Moving Average
-Coefficient of Variation Weighted Moving Average
-Fractal Adaptive Moving Average
-Kaufman's Adaptive Moving Average
In addition, a middle filter is calculated by taking the median of the two basis lines.
Multi-Timeframe functionality is included. You can choose any timeframe that Tradingview supports as the basis resolution for the bands.
Custom bar color scheme is included with four options to choose from.
Squeeze Box [DW]This is an experimental study designed using data from Bollinger Bands to determine price squeeze ranges and active levels of support and resistance.
First, a set of Bollinger Bands using a Coefficient of Variation weighted moving average as the basis is calculated.
Then, the relative percentage of current bandwidth to maximum bandwidth over the specified sampling period determines the relative squeeze.
The box is outlined by drawing the current highest and lowest source value over the sampling period whenever a squeeze is active.
I've included the COVWMA in the visualization for additional confirmation of price activity.
Custom Bar color scheme is included.
Ultra MACD [DW]This is a variation of Gerald Appel's MACD with seven moving average source types to choose from.
The MA types I've included in this script are:
- Kaufman's Adaptive Moving Average
- Geometric Moving Average
- Hull Moving Average
- Volume Weighted Moving Average
- Least Squares Moving Average
- Arnaud Legoux Moving Average
- Exponential Moving Average
Custom bar color scheme is included with two different colorization methods - one based on the MACD, and the other based on the histogram.
Moving Average Range Channels [DW]This study is an experiment based off the concept used in my Dynamic Range Channel indicator.
Rather than using a McGinley Dynamic, a moving average of your choice is used in this calculation.
There are eight different moving average types to choose from in this script:
- Kaufman's Adaptive Moving Average
- Geometric Moving Average
- Hull Moving Average
- Volume Weighted Moving Average
- Least Squares Moving Average
- Arnaud Legoux Moving Average
- Exponential Moving Average
- Simple Moving Average
For a more refined picture of volatility, I've added upper and lower extension channels. They are calculated by adding the upper half range to the channel high, and subtracting the lower half range from the channel low.
The new custom bar color scheme indicates trends, midline crosses, MA crosses, and overbought and oversold conditions.
Idō Heikin Ichimoku [DW]This is an experimental study inspired by Goichi Hosoda's Ichimoku Kinkō Hyō.
In this study, a McGinley Dynamic replaces the Tenkan-Sen and Kaufman's Adaptive Moving Average replaces the Kijun-Sen.
The cloud is calculated by taking the mean of the highest high and lowest low, adding a golden mean standard deviation above and below, and offsetting it over the specified period.
The lagging span is calculated by offsetting the closing price by the same amount as the cloud period.
Fibonacci Time Moving Average Ribbons [DW]This is an experimental study that takes a moving average of price, then offsets the average by up to 11 consecutive Fibonacci numbers from 1 to 144.
Choose between Kaufman's Adaptive Moving Average, Hull Moving Average, Fractal Adaptive Moving Average, Geometric Moving Average, or Exponential Moving Average.
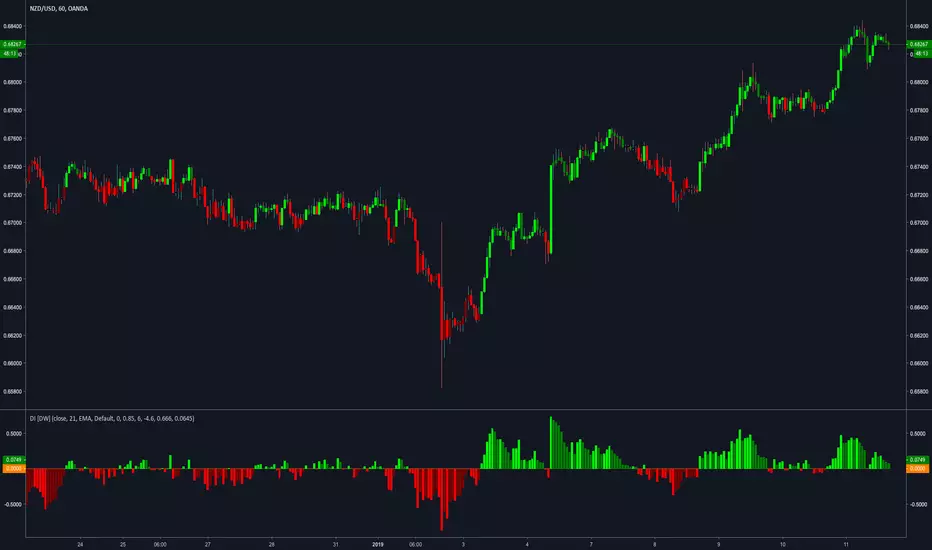
Disparity Index [DW]This is an iteration of Steve Nison's Disparity Index that includes 5 different moving average types to choose from.