Market

Initial Balance Markets Time ZonesThe below script is based on Initial Balance.
Initial Balance is based on the highest and lowest points of Price Action (PA) within the first 60 minutes of trading. There is so much information available online, reference Initial Balance, that I have not provided a reference.
Most indicators I have seen have been solely based on UTC 0000 Initial Balance. My aim with this indicator was to be able to visualize how other time zones market openings Initial Balance affect PA.
The three market openings I chose to code in are:
London 0800 to 0900
New York 1430 to 1530
Asia 0000 to 0100
Within the script I have given the user the option to select to see with a green or red background when PA is above all zones Initial Balance high (green) or PA is below all zones Initial Balance low (red).
Alerts are also coded in, to prompt the user that PA has gone above or below as per above.
The Initial Balance high and lows also offer another form of areas of confluence.
Below are some examples of IB in action:
LTC
NULS
UNFI
DEXE

TradiKator 02 S&P500 Market BreadthTradiKator 02 S&P500 Market Breadth (MB 02 by TK) is a visual indicator that plots S&P500 Market Breadth ( the percentage of S&P500 securities that is above a certain SMA line ).
Market breadth indicates the wave-induced motion of the whole market.
Q&A
Function and Setting
1. 11 sectors for the S&P500's securities
You can open this indicator by multi times to check the different settings with "above ? SMA" in same time like the picture shows "above 50 days , above 20 days and above 20 days plot in lines"
Also, it is possible to combine this indicator with multiple setting to give the sum of the different "above? SMA"'s the result.
2. 6 choices for above ? SMA
Above 5 days, Above 20 days, Above 50 days, Above 100 days, Above 150 days or Above 200 days,
3. 2 methods to visualize the study result
Colorful grid, Green = more securities above ? SMA , Red = more securities below ? SMA
Line plot, High = more securities above ? SMA , Low = more securities below ? SMA
TradiKator is Traders' indicator.
Please visit TraiKator for more free scripts.
We also support the Chinese.
Happy new year!
Wishing you a great and successful journey in the Chinese Zodiac Bull Year.
This script is a revised version of jchang274's Multi-Sub script.
Thanks to jchang274's contribution.

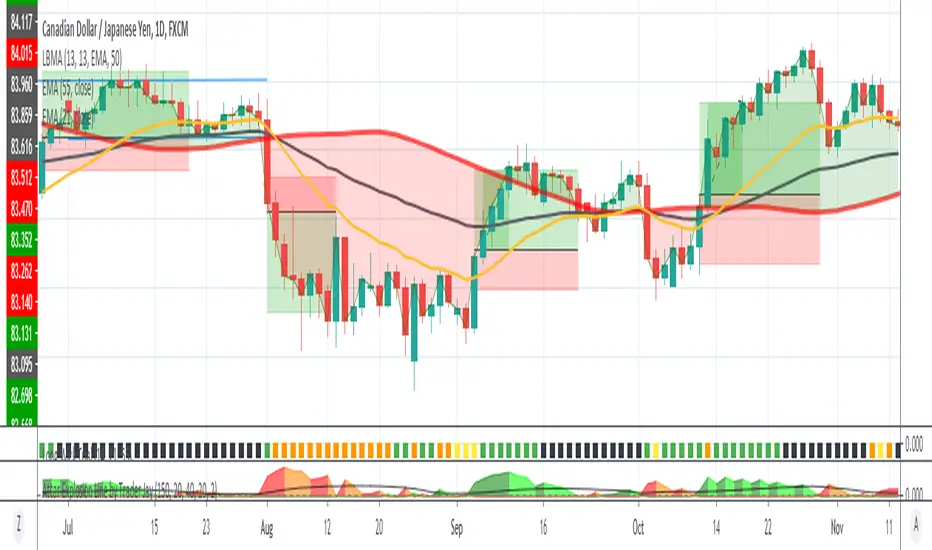
Pre and Market OpeningsPre and Market Openings is to enable you to quickly visualize the opening markets and how they could influence trading.
The below script has used the market time data from the below links:
Tokyo/Asia www.tradinghours.com
London www.tradinghours.com
New York www.tradinghours.com
The below script aims to plot:
Daily Asia Open
Weekly Asia Open
Daily London Open
Weekly London Open
Daily New York Open
Weekly New York Open
Using background colour it also shows market sessions (pre-market) for London and New York and regular for London, New York and Asia.
There is also plotted text for days of the week and sessions.
As you can see from the picture below that these market openings can act as support and resistance:
BTC
ETH

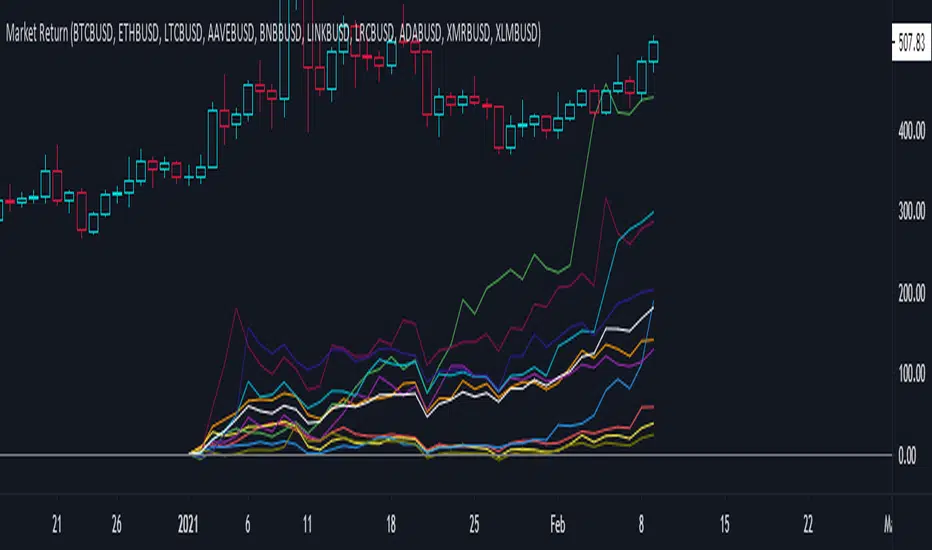
Market ReturnThis script calculates the market return for a specific period. It consists of two calculations which are:
1. Calculate market return of each asset - formula => (final value - initial value)/initial value
2. Calculate the aggregate average market return of chosen assets
The purpose of this script to see how much you would gain if you buy and hold the asset for a specific period.
Fundamental Metric to MarketThis script is supposed to be a quite basic way to find, from a fundamental standpoint, overvalue or undervalued stocks.
The script shows either Book to Market (inverse of P/B), EV /EBITDA, Earnings Yield (inverse of P/E) or Sales to Market (inverse of P/S).
For example, P/B is calculated as Close price / Book Value per share. As a contrarian investor you generally want to buy low P/B stocks and sell high P/B stocks. The problem is when a company has a negative Book Value. This might be the case when a company has written of a large amount of goodwill, which in turn wiped out their Book Value.
Instead you can use Book to Market, which is simply the inverse of P/B. It is calculated as Book Value per share / Close price. When using Book to Market you, generally, want to buy shares with high Book to Market values and sell those with low values. Because of the calculation, companies with negative Book Value will have negative Book to Market values and is therefore easy to identify.
The Fundamental Metric to Market indicator shows a colored background between the highest / lowest point of earlier values and the current value. When the background is mainly green the stock is probably undervalued, and the opposite is true when the background is red.
THIS IS NOT TRADING ADVICE, AND YOU SHOULD ALWAYS DO YOUR OWN RESEARCH
GOOD LUCK AND HAPPY TRADING

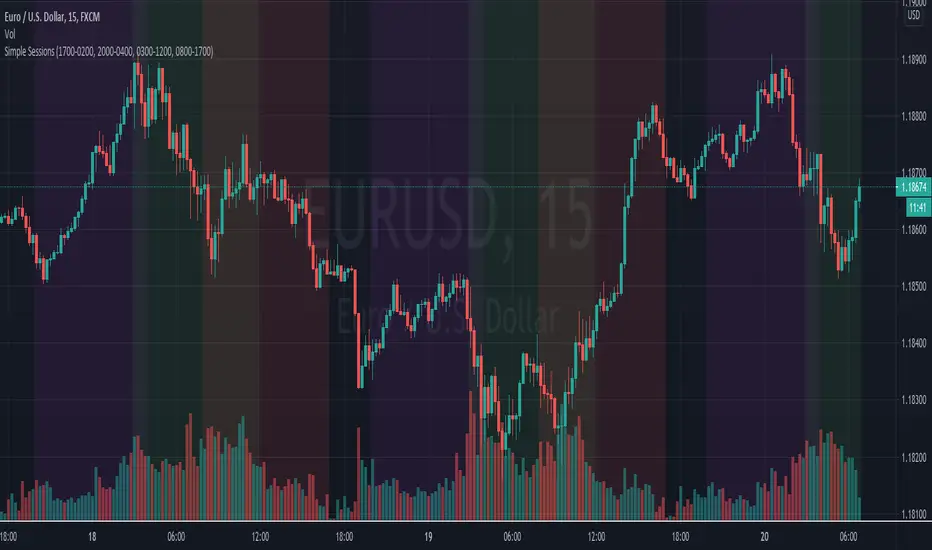
Simple Sessions## Background ##
Simple Sessions is based on the very awesome "Sessions on Chart" by Aurocks_AIF.
I really liked how the background colours worked but wanted to simplify it by removing some parts that I didn't use. I then simplified much of the code, put it into my standard template format and re-published. Hopefully the code is a bit cleaner and easier to read now.
## Usage ##
The default indicator shows the following sessions:
* Sydney in Navy
* Tokyo in Purple
* London in Green
* New York in Red
The good news is that using Green and Red for London and New York, gives a nice distinct yellow for the overlapping sessions. Sydney and Tokyo are by in similar colors by design.
By default, only London and New York show, but you may turn on Sydney and Tokyo in the settings.
## Use, Share, Like, etc #
Have fun!
-- chilts
Automated - Fibs with Market ordersThis script was recently shared for limit only orders here:
This version does not worry about keeping orders in the books and moving them around, instead it will simply market in and out.
I am sharing this to reveal the difference between the 2 setups.

Bitcoin Correlated Market DirectionIdentifies which major market is "controlling" Bitcoin and what direction that market is moving in.
Helps to identify confluence of trend or potential turning points for Bitcoin.
Blue = stocks in control and bullish
Purple = stocks in control and bearish
Orange = gold in control and bullish
Red = gold in control and bearish

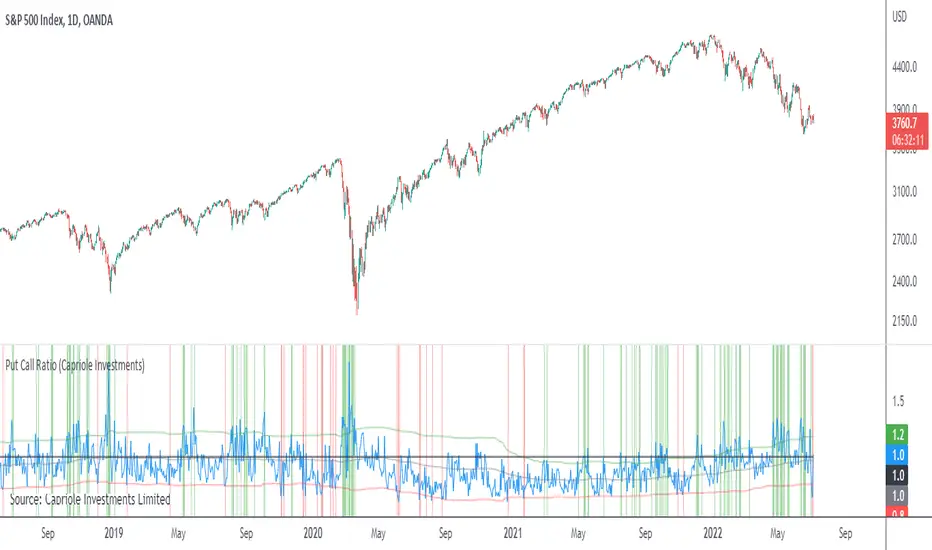
Put Call RatioPlots the CBOE Put Call Ratio and marks up locations of extremities.
Useful as a factor of confluence in identifying extremities in the market.
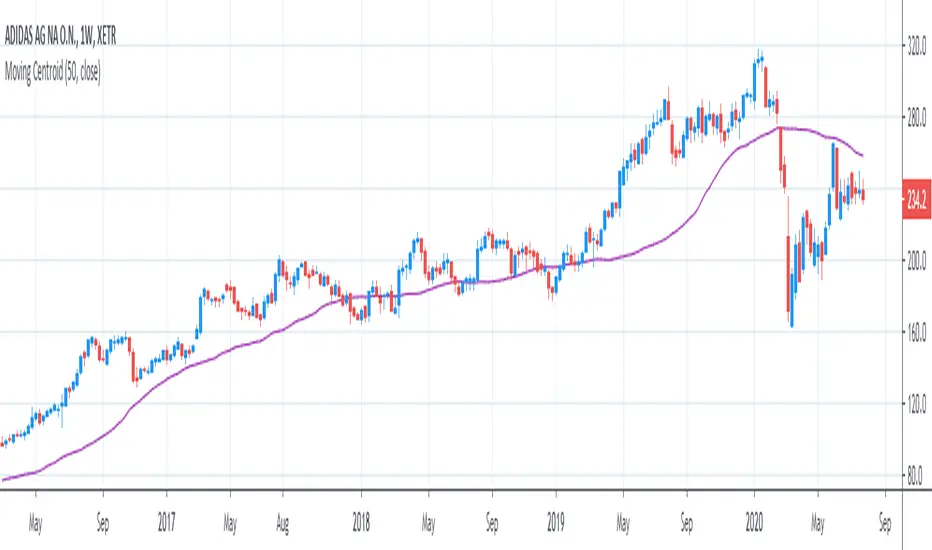
[R&D] Moving CentroidThis script utilizes this concept. Instead of weighting by volume, it weights by amount of price action on every close price of the rolling window. I assume it can be used as an additional reference point for price mode and price antimode.
it is directly connected with Market (not volume) profile, or TPO charts.
The algorithm:
1) takes a rolling window of, for example, 50 data points of close prices:
2) for each of this closing prices, the algorithm will check how many bars touched this close price.
3) then: sum of datapoints * weights/sum of weights
Since the logic is implemented in pretty non-efficient way, the script sometimes can take time to make calculations. Moreover, it calculates the centroid taking into account only close prices, not every tick. of a given rolling window That's why it's still experimental.
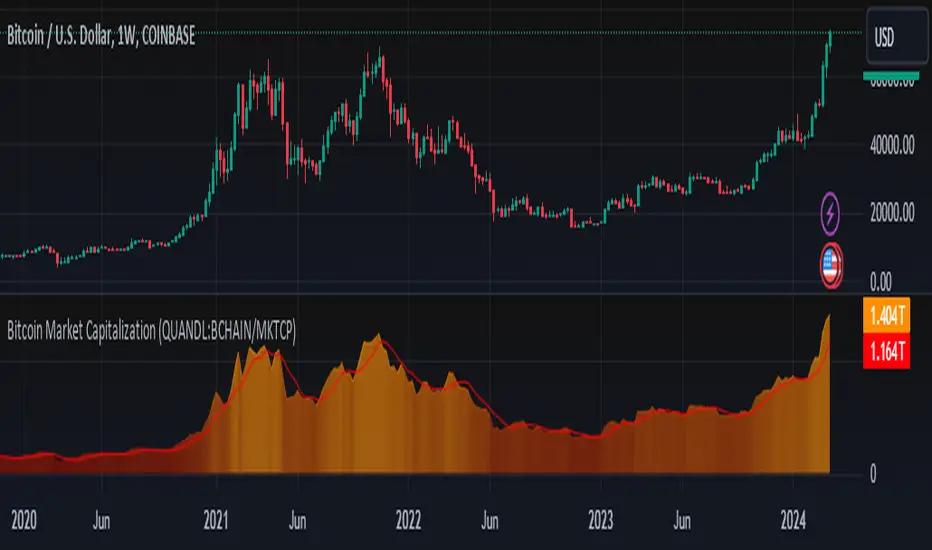
Bitcoin Market Capitalization (QUANDL:BCHAIN/MKTCP)Simple script that graphically represents the Bitcoin Market Capitalization
Blockchain data made available at QUANDL .
Its logic is simple, search the data in the QUANDL database and plot it on the chart.
Crypto Trading Hours UTC based on Berlin time (UTC +2)Although crypto markets trade 24/7, there are spikes in volume according to the general hours at which different parts of the world do the majority of their trading.
This Script highlights the US, European and Asian markets when they are most active. The normal market hours are always from 08:00 to 16:30 local time.
US market opens at 8:00 Silicon Valley local time, and closes at 16:30 New York local time.
European market opens at 8:00 London local time, and closes at 16:30 Frankfurt local time.
Asian market opens at 8:00 Hong Kong local time, and closes at 16:30 Sydney local time.

Mass Thrust OscillatorThis is a custom indicator that turns my Mass Thrust Indicator into an oscillator which is loosely based on Tushar S. Chande's Market Thrust Oscillator (Stocks & Commodities V. 10:8 (347-350))
Let me know if you would like a custom script or if you want to see me publish any other indicators!

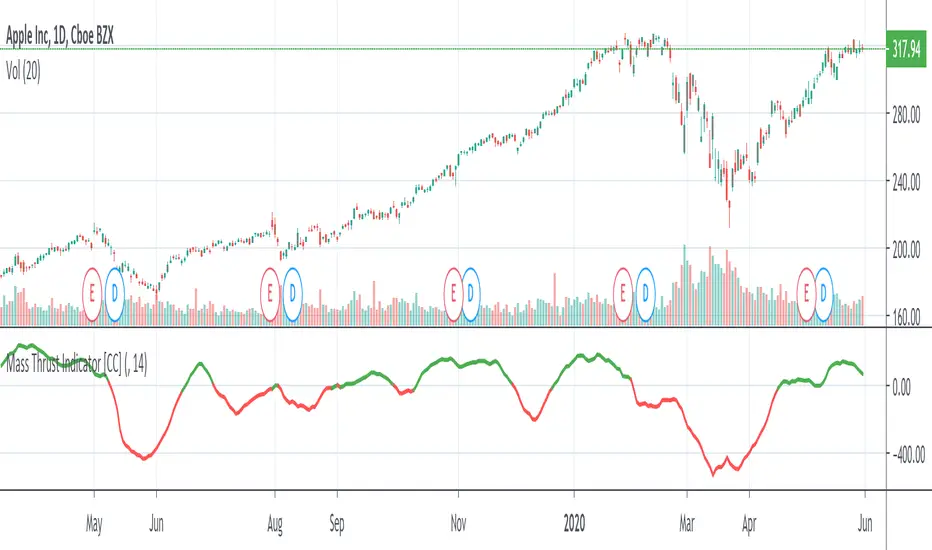
Mass Thrust IndicatorThis is a custom indicator of mine that I based loosely on Tushar S. Chande's Market Thrust Indicator (Stocks & Commodities V. 10:8 (347-350)). Buy the stock if the indicator is green and sell when it turns red.
Let me know if you would like to see more scripts or if you have custom requests!
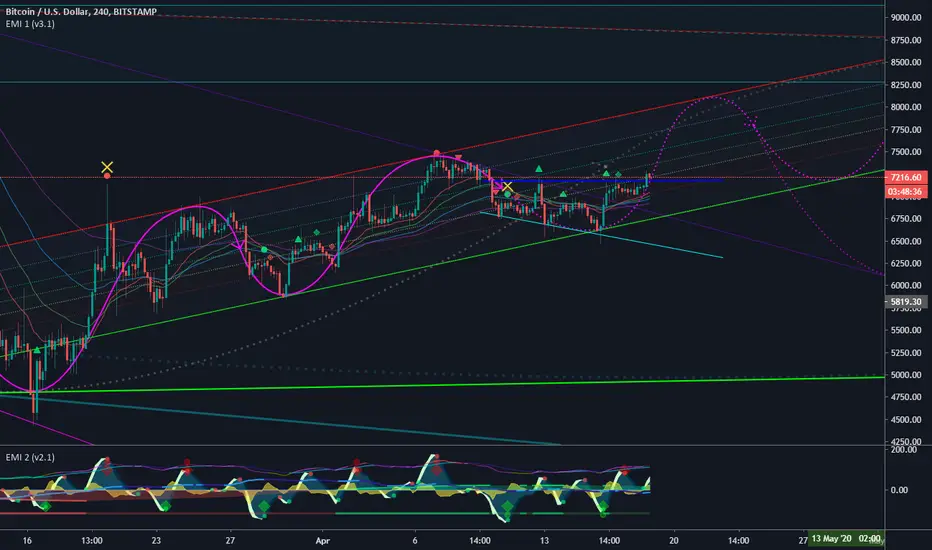
EMI 1 (v3.1)After months and months of back-testing. I finally decided to release this update. Would also like to give out a special thanks to TradingView for making it possible to create scripts and share this with the community. I have acquired a lot of information in this community. I believe that when you take, you should also share. That’s why I am sharing this wonderful indicator for free. Remember, knowledge and experience is the most valuable things in life.
EMI, short for Epic Market Indicator:
60-80% theoretically profitable trades, depending on the time period. However if you use EMI blindly, the percentage might even go lower. Nevertheless, there should be enough presenting opportunities, if you use her wisely. Remember, like any instrument, 'practice makes perfect'.
EMI 1 is actually a combination of diverse indicators:
Tesla EMA/SMA Ribbon: Periods based upon Nikola Tesla's favorite numbers; 3, 6, 9. (Disabled by default)
Fibonacci EMA Ribbon: Periods based upon Fibonacci frequency; 21, 34, 55, 89. (Enabled by default)
Regular EMA/SMA Ribbon: Periods based upon Standard frequency; 10, 20, 100, 200. (Disable by default)
Pivots (Disabled by default).
Bollinger bands (Disabled by default).
Bar trend color (Disabled by default).
Buy & Sell signals, which makes EMI a unique indicator: Based upon diverse indicators & oscillators buy or sell signals. Not predictions, but high probabilities.(Enabled by default, obviously ^^ )
Red symbols are sell or short signals / Green symbols are buy or long signals.
Dots represents possible price action trend reversals and the diamond symbols could be a possible confirmation and the big X is even a stronger confirmation signal. (A top or bottom, not THE bottom or top). These signals are based upon certain buy & sell conditions by a diversity of indicators known by most traders. Think for example, crossing EMA’s, Stochastic RSI , MACD , oversold and overbought territories.
New v3.1:
Modified to even more accurate buy & sell signals
Yellow X
Bar trend colors based on Money Flow Velocity or Money Flow
The signal conditions are based on different oscillators, known by many traders. ALWAYS wait for the candle to close and preferring even more confirmations before taking any consideration nor actions. No signals means most of the time trend continuation. EMI 2 in combination with EMI 1 and traditional authentic pattern formations with a darkened theme is recommended. For more explanation please ask my on streams or join my academy once it's online!
Good luck fellow traders and don't forget to tap the like & follow button. Thanks in advance.
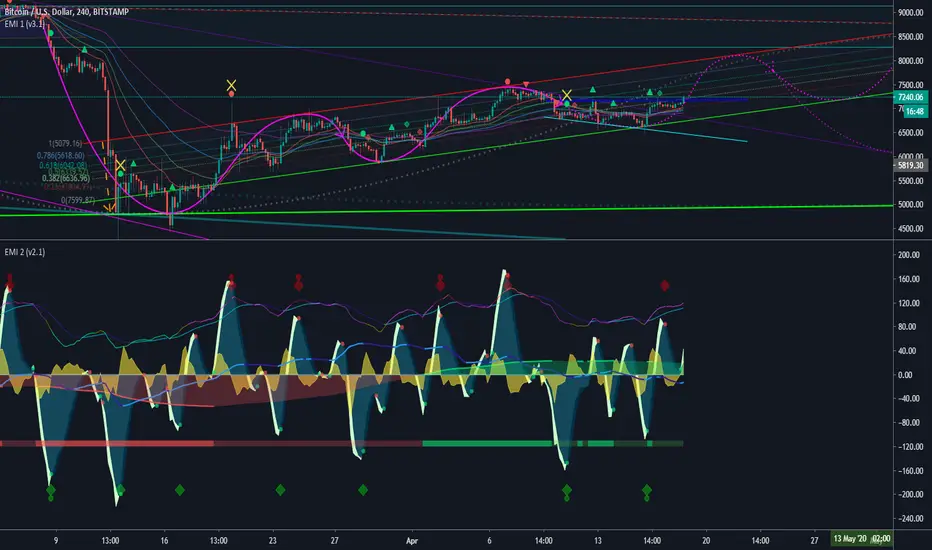
EMI 2 (v2.1)After months and months of back-testing. I finally decided to release this update. Would also like to give out a special thanks to TradingView for making it possible to create scripts and share this with the community. I have acquired a lot of information in this community. I believe that when you take, you should also share. That’s why I am sharing this wonderful indicator for free. Remember, knowledge and experience is the most valuable things in life.
EMI, short for Epic Market Indicator:
60-80% theoretically profitable trades, depending on the time period. However if you use EMI blindly, the percentage might even go lower. Nevertheless, there should be enough presenting opportunities, if you use her wisely. Remember, like any instrument, 'practice makes perfect'.
This indicator is a combination of different oscillators:
Common:
MACD
VWAP
RSI
Stochastic
Money Flow
Money Flow Velocity
Buy & Sell signals
Bottom & Top signals
Volume Flow heat map
New v2.1:
Money Flow Velocity
RSI added level 1 & 2 over-bought or -sold territories
Modified Top & Bottom conditions
Modified algorithms for even more accurate analysis
Modified Money Flow settings
RSI turns green or red when entering overbought or oversold territories.
Dots on wave crossings are buy or sell signals.
Diamonds above are possible bottoms and tops.
Green = Possible Bull/Bottom signals
Red = Possible Sell/Top signals
The signal conditions are based on different oscillators, known by many traders. ALWAYS wait for the candle to close and preferring even more confirmations before taking any consideration nor actions. No signals means most of the time trend continuation. EMI 2 in combination with EMI 1 and traditional authentic pattern formations with a darkened theme is recommended.
Good luck fellow traders and don't forget to tap the like & follow button. Thanks in advance.
Long Wick TrialI've created this as a confirmation indicator to help know when market conditions are favorable to enter a trade. It measures volume, volatility, and ATR. It is not intended to tell you when to enter/exit the market, but use it with another indicator such as the mirror macd to filter out many losses and avoid entering the market during low volume or excessive volatility that may trip your stop loss.
Green = Favorable Market conditions
Yellow = Enter with caution, the market is moving sideways but is slightly trending
Orange = Enter with caution, the market is trending but extremely volatile and may trip stop loss early
Black = Shouldn't enter market here, market is moving sideways and volume is also low.
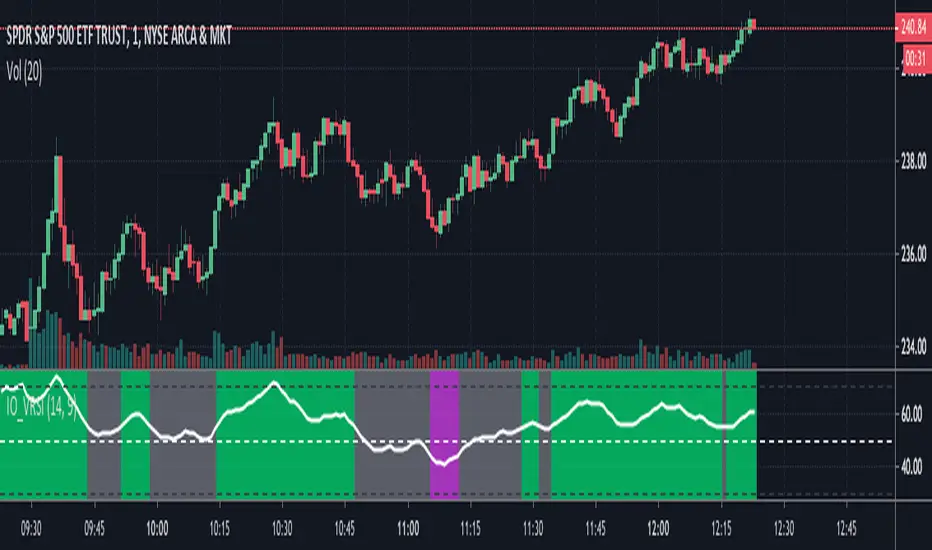
IO_VRSIOriginal Idea by Invsto
In this indicator, I explore the core concepts of RSI and extend it with smoothening to determine volatility.
Usage:
LIME/GREEN : High Volatility and BULLISH trend
RED/FUCHSIA : High Volatility and BEARISH trend
GRAY: Low volatility/Potential Chop Zone
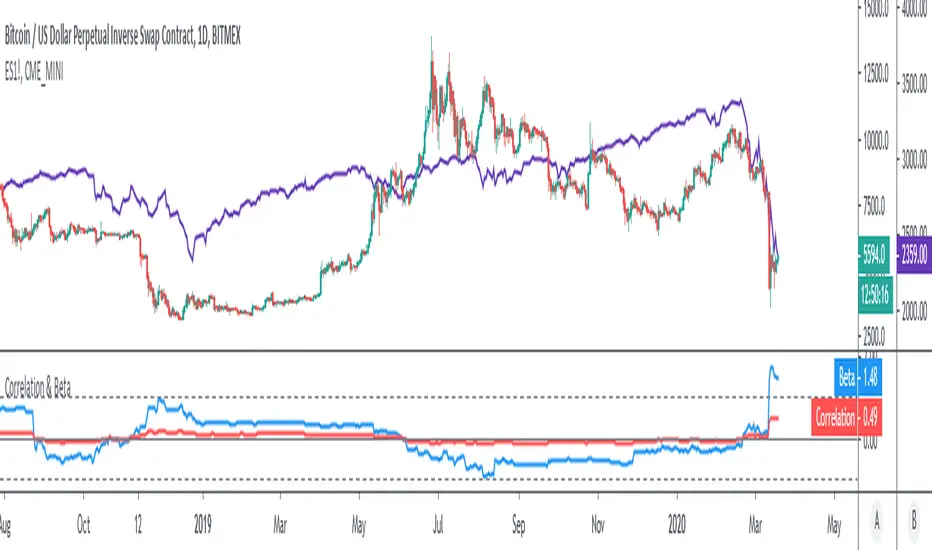
Correlation & BetaDisplay the correlation coefficient and/or Beta of an asset to a specified market.
Options to:
- Specify market (S&P500 futures by default)
- Display one or other metrics
- Modify assessment period (200 bars by default)
- Calculate on price, returns or log-returns
Yield Curve Inversion MonitorIdentifies when the US Treasury Yield Curve inverts (2 and 10 year bond rates).
When they ‘invert’ long-term bonds have a lower interest rate than short-term bonds. In other words, the bond market is pricing in a significant drop in future interest rates (which might be caused by the US Fed fighting off a recession in the future).
In the last 50 years, every time the US treasury yield curve inverted a recession followed within 3 years. On average the S&P500 gained 19.1% following the inversion and peaked 13 months later. In other words, as far as investors are concerned, the recession began roughly one year later.
However, once the market peaks, it then drops 37.6% on average, wiping out all those gains and more.
...Looks like 2020 is shaping up to be another prime example.

[JOHN] KNIFE CUThEY HELLO PEOPLE, THIS IS KNIFE CUT
This indicator work in sync with SUPER BOSS , check it.
KNIFE CUT
You can consider this as "BUY THE DIP" that is the best part of it. "BUY WHEN THE AREA IS BACK TO GREEN".
Is a special indicator with 2 metrics you can use for be a better trade and stop losing money entering useless positions.
This indicator can:
The Area in the center measure "Market cycles" check below, and "BUY PRESSURE", check the reaction with the price action, impressive? i know.
About the bars green or red, are trend bars, compare it to the price action and you can see that these bars catched all uptrends and downtrends.
(you can change also resolutions of background bars, current H4 resolution if you watch lower timeframes.)
*BUY PRESSURE / TREND BACKGROUND BARS
*MARKET CYCLES
This script work with every exchange and pairs, also forex.
See price history.
You not believe? i believe.

Cracking Cryptocurrency - Bottom FeederThe Bottom Feeder
The Bottom Feeder is designed to algorithmically detect significantly oversold conditions in price that represent profitable buying opportunities. Combining this with it’s unique Stop and Target System, the Bottom Feeder is designed to return consistent return with minimal draw down. Whether used as a Market Bottom Detector or as a system for executing safe, profitable mean reversion trades, the Bottom Feeder is a powerful tool in any trader’s arsenal.
Bottom Feeder was designed to be used on BTCUSD , however it is also effective on other USD/USDT pairs. One will have to check the individual pair they wish to trade with the Strategy Tester to simulate performance.
Options
Let’s go through the input options one by one, so that you are able to comfortably navigate all that this indicator has to offer. The link below will display a picture of the layout of the settings for your convenience.
For the sake of simplicity, let’s note now that all settings marked **Conservative Mode** will not work in Aggressive Mode.
Mode: Determines how aggressively Bottom Feeder generates a buy signal. In Conservative Mode, trades can only be opened once per candle and the stop and target will update as new signals appear. In Aggressive Mode, a separate trade is opened each time Bottom Feeder signals, which may be multiple times within one Daily candle.
Plot Target and Stop Loss: Toggles on/off the visualized take profit and stop losses on the chart.
**Conservative Mode** TP Multiplier: This is an input box, it requires a float value. That is, it can accept either a whole number integer or a number with a decimal. This number will determine your Take Profit target. It will take whatever number is entered into this box and multiply the Average True Range against it to determine your Take Profit.
**Conservative Mode** SL Multiplier: See above - this will modify your Stop Loss Value.
**Conservative Mode** Average or Median True Range: This is a drop-down option, the two options are Average True Range or Median True Range. If Average True Range is selected, then this indicator will use the Average True Range calculation, that is, the average of a historical set of True Range values to determine the Average True Range value for Target and Stop Loss calculation. If Median True Range is selected, it will not take an average and will instead take the Median value of your historical look back period.
**Conservative Mode** True Range Length: This is an input that requires an integer. This will represent your historical look back period for Average/Median True Range calculation.
**Conservative Mode** True Range Smoothing: This is a drop-down with the following options: Exponential Moving Average ( EMA ), Simple Moving Average ( SMA ), Weighted Moving Average ( WMA ), Relative Moving Average (RMA). This will determine the smoothing type for calculating the Average True Range if it is selected. Note: if Median True Range is selected above, this option will not have any effect as there is no smoothing for a Median value.
**Conservative Mode** Custom True Range Value?: This is a true/false option that is false by default. If enabled, it will override the Average/Median True Range calculation in favor of a users custom True Range value to be input below.
**Conservative Mode** Custom True Range Value: This is an input box that requires a float value. If Custom True Range is enabled this is where a user will input their desired custom True Range value for Target and Stop Loss calculation.
Stop and Target Description
Because Bottom Feeder is designed only to scalp the various market bottoms that can appear over time in the market and not to identify trends or to trade ranges, it’s imperative that the indicator notify us not just to when to enter our trades, but when to exit! In the service of that, CC Bottom Feeder has a built in Stop and Target system that tracks and displays the stop loss and take profit levels of each individual open trade, whether in Aggressive or Conservative Mode.
Conservative Mode Targeting: In Conservative Mode, Bottom Feeder signals are aggregated into a compound trade. The signal will appear as a green label pointing up below a candle, and will appear upon a candle close. If Bottom Feeder then generates another signal the stop loss and target price will be updated. The process will continue until the aggregated trade completes in either direction. On a trade with multiple signals, a larger position is slowly entered into upon each buy signal.
Aggressive Mode Targeting: In Aggressive Mode, Bottom Feeder signals are individually displayed as they are generated, regardless of how many signals are generated on any single candle. If Bottom Feeder continues to signal, each individual open trade will have their own stop loss and target that will be displayed on the chart until the individual trade completes in either direction. As opposed to a large compound position, aggressive mode represents a higher number of independent signals with their own stop and target levels.
Stop losses and targets are designed to be hard, not soft. That is, they are intended to be stop market orders, not mental stop losses. If price wicks through the target or stop, it will activate.
