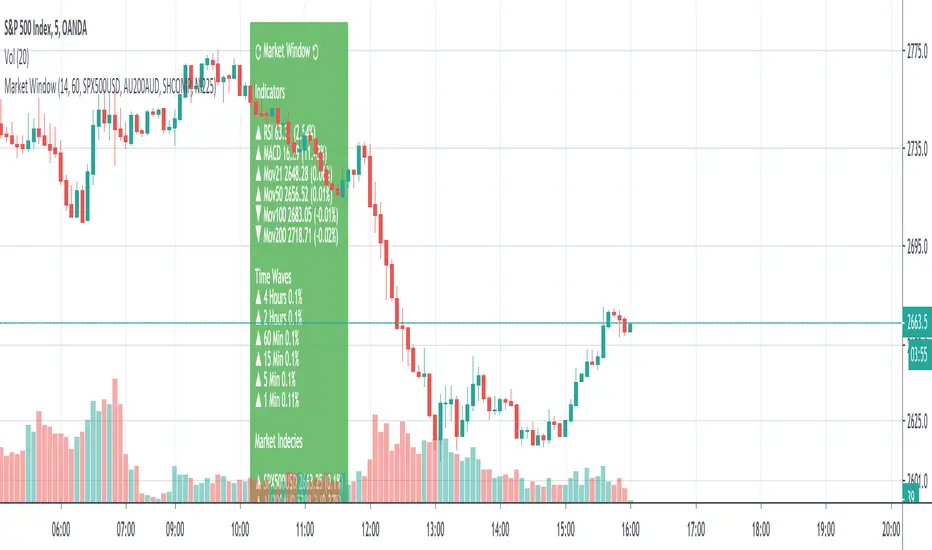
SMU Market Window with Price WavesSMU Market Window is a standalone panel of major indices, indicators, and, most importantly, the status of all timeframes 1 minute, 5 minutes, etc. all in one window.
Market window can be used on its own or in conjunction with the new version of Quantum Thermoballs Turbo Charged (to be released soon).
Since this scripts queries multiple time frames and multiple incendies, it takes 1-2 seconds to load. Once loaded it works like a clock.
Enjoy and always share knowledge so our Pine TV community can grow and reac a new high.
Market
Zahorchak MeasureCreator: Michael G. Zahorchak.
References:
The Art of Low Risk Investing by Michael G. Zahorchak, 1977. Unfortunately, it's all but impossible to find a copy these days.
The Complete Guide to Market Breadth Indicators by Gregory L. Morris, 2006. A fantastic resource for those interested in Technical Analysis or creating their own trend based system.
Two articles by Greg Morris on the Zahorchak Measure. I can't link to them under the House Rules, but they are easily searchable.
The Zahorchak Measure (ZM) is designed to give you a market bias (either uptrend or downtrend) which you can use to determine a trade bias for ETF's or stocks.
ZM works by taking multiple moving averages of the NYSE Composite, a moving average of the NYSE advance decline line, and examining the relationship between those elements. Broadly, the market is considered to be in a uptrend when ZM is above zero, and a downtrend when below. However, there are many ways to interpret the indicator.
The version created by Greg Morris is more akin to a binary indicator in that ZM jumps from number to number. This version is smoothed to create an oscillator as it reduces whipsaws (at the expense of lag). You can set the EMA Length to 1 to go back to the original.
Some notes:
Michael Zahorchak called it the "Zahorchak Method", whereas Greg Morris uses the term "Measure". I'm not totally clear on the change, but Mr. Morris made some changes (covered below), so that may explain the altered name.
The original indicator used moving averages of 5, 15, and 40 weeks. I have converted these to daily numbers as that's the time frame I most commonly trade. You can convert the numbers back by dividing by 5.
The original indicator used the Dow Industrials for the moving averages, however Greg Morris switched to the NYSE Composite due to the advance decline line being based on the NYSE.
Greg Morris removed the 5 period moving average of the NYSE Composite, as it created increased volatility at market tops and bottoms. I tested ZM with the 5 period MA added back in, and I believe removing it creates a superior indicator.
I've added both Multi Time Frame functionality, and the ability to alter moving average lengths. Play around and see what you can come up with.
ZM oscillates between -10 and +10. There are some interesting levels creating between these two numbers (apart from the obvious zero level) - see what you can come up with.
All credit goes to Michael Zahorchak and Greg Morris for the indicator creation. I have simply reproduced their work for the TradingView community as this great indicator wasn't available.
Any queries let me know in the comments or PM me.
DD.

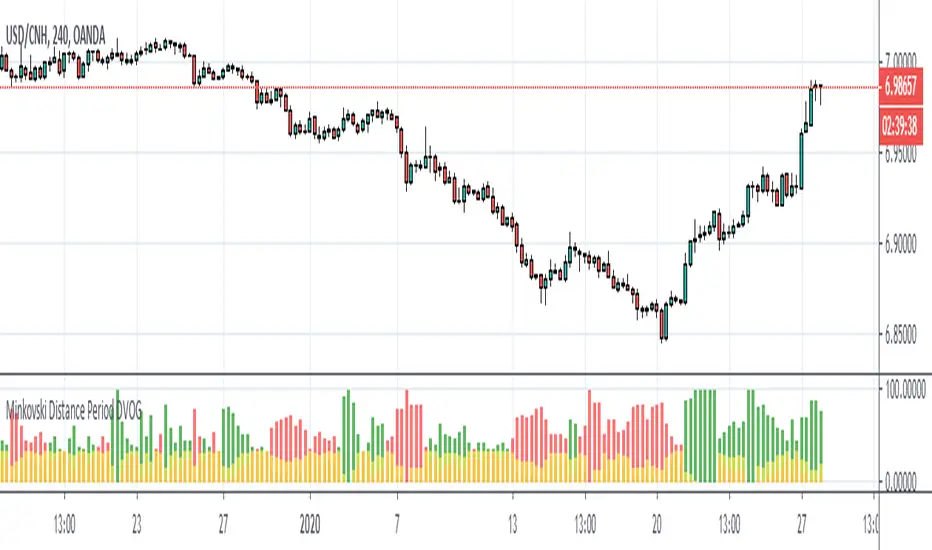
Minkovski Distance Period DVOGThis script was created by building my Dependent Variable Odd Generator script on the Minkovski Distance Adaptive Period.
I have tried this on MACD before.
Script related to MACD :
I used an older version that does not use Dow Factor to suit multi timeframe analysis.
In this way, market situations provide the opportunity to see histograms in an adaptive period as a Multi Timeframe.
Minkowski Distance Function Original Script by RicardoSantos :
Regards.
Market StructureMarket Structure
The Market Structure is important to be able to establish areas of rejection or possible break,
to determine channels, points of possible reversals or trend breaks.
So we can use them as support and resistance zones for stoploss and take profit.
- This indicator will automatically show the market structure.
- Allows you to calculate the levels with the closing of the candles as well as with the highs and lows
- You can change the number of levels on the screen with the intensity adjustment
- Extended levels are shown as well as at the end of the graph to avoid noise when making technical analysis
- Visually you can modify the style, color, thickness of the level lines
- This indicator is multi-time, so you can check the structure of other temporalities, for example see the levels corresponding to 1D while the graph is H4
- Green lines are the resitance levels and red lines are support levels, these will automatically change color according to the current price
BTC 1W
EURUSD 1W
ETHUSDT 1D

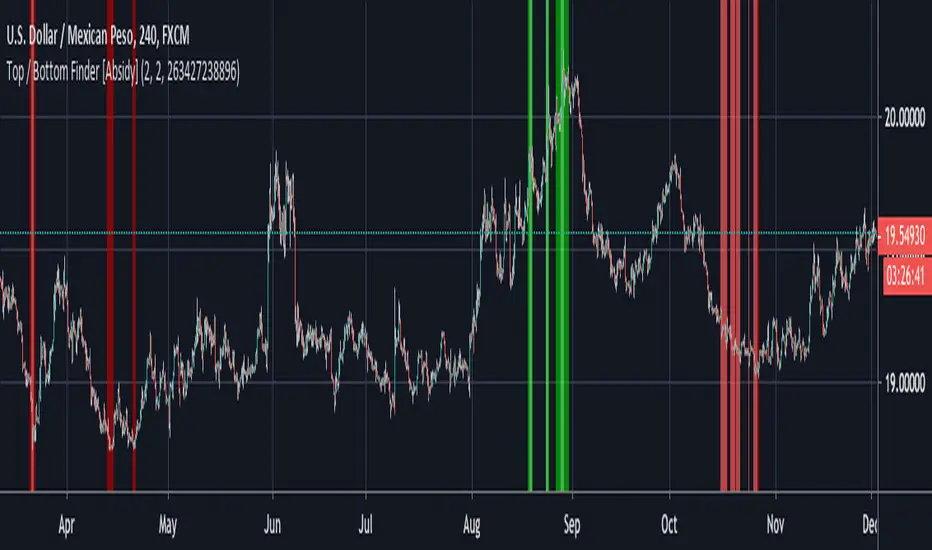
Top / Bottom Finder The Top/Bottom Finder is a unique indicator that looks for market tops and market bottoms in real time without repainting or lagging! When this indicator suspects that a market top is forming it changes the background of the chart to bright green. When this indicator suspects that a market bottom is forming it changes the background of the chart to bright red. This is a great confluent signal for other indicators and strategies that focus their trading styles on entries and exits in the top or bottom of the market. There are two settings that you can change depending on what markets you are in and your trading style. If you are looking for very quick scalping opportunities it is best to set the sensitivity setting very low to look for quick changes, but if you are looking for long term market peaks you can turn the sensitivity up. Since this indicator works independently from the time frame it's best to check out different setting on different time frames to see how they agree. For example, if you are looking for a lot of trades on the 4 hour charts you can set the sensitively very low, but this might give similar information if you set the sensitivity very high on the 5 minute charts. The next setting that you can change is the signal quality. The tops and bottoms of trending and ranging markets look very different, to account for this you can change how this indicator responds in both types of market by setting the signal quality very high for tending markets and very low for ranging markets, or somewhere in between for potential break out markets.
This indicator works by a proprietary recursive filtering technique that tries to gauge if a top or bottom is forming in real time.
To start your free four day trial please see the link below to receive access and free tutorials for this indicator!
Market Thrust IndicatorThe Market Thrust indicator is a powerful measure of the stock market's internal strength or weakness. There are four components to this indicator:
1-Advancing Issues on the New York Stock Exchange (NYSE) – $ADV
2-Advancing Volume on the NYSE – $UVOL
3-Declining Issues on the NYSE – $DECL
4-Declining Volume on the NYSE – $DVOL
The formula for Market Thrust is given below:
($ADV x $UVOL)-($DECL x $DVOL)
When used for day-trading, the trend of the Market Thrust indicator is what is most important.
Rising Market Thrust Indicator: Considered a bullish sign; can act as a confirmation signal when combined with a rising stock, index ETF, or stock index future's price.
Falling Market Thrust Indicator: Considered a bearish sign; can act as a confirmation signal of a decreasing market price.
The Market Thrust indicator could be used for detecting divergences in trends. Divergences occur when:
- Price is trending higher, but the Market Thrust indicator is not moving higher or is even going down.
- Price is trending lower, however, the Market Thrust technical analysis tool is not trending lower, it is either not trending or is trending higher.
Add a fully configurable trend line over MTI.
Read more at: commodity.com

Market Profile for Futures with Session and After Hours SplitAdapted existing Market Profile scripts to be move suitable for Futures Markets with Session and After Hours split
Script Provides split Market Profiles for Session and After Hours
Users can customize the Session and AH hours inputs to suit any ticker and their interpretation of prime and non-prime hours

BTC Bear Market Identifier [ChuckBanger]I have never find a use case for Line Break chart before. But I stumbled on the fact that if bitcoin dumps below the low of a big down move. It is very likely Bitcoin is heading for a new bear market. So this script is based on that idea and developed to this. It is intended to be used as a bear market identifier only with Line Break daily or higher time frame chart. If someone find a different use case for this script let me know
2014:
2018:

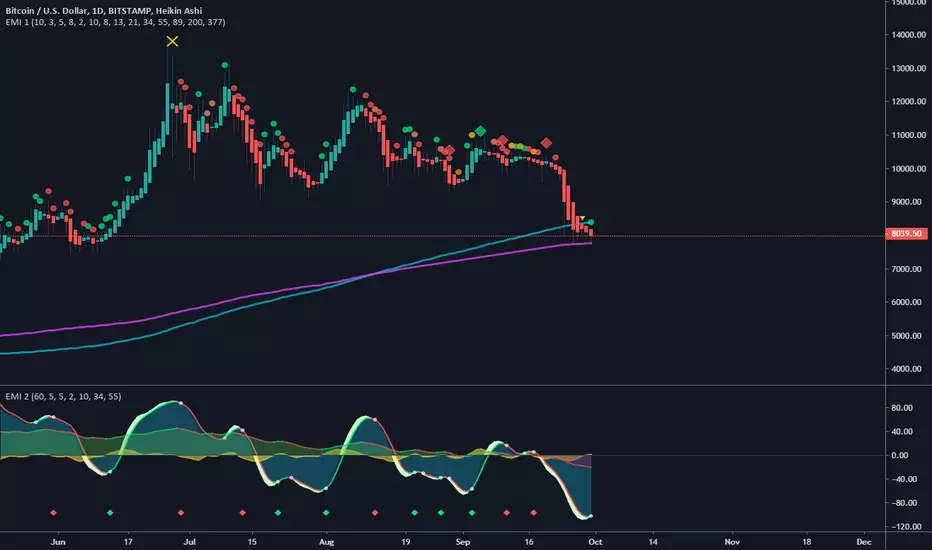
(EMI 1) Epic Market Indicator v2.2Had to release a new version, due to house rules.
This indicator is usable for every market and I do suggest to use it in combination with EMI 2.
Green = buy/long, Red = sell/short
Orange = Price action divergence/convergence.
Yellow X = Manipulation, you might to be careful when you see this, most of the time dumps happens afterwards.
Always wait for the candle/bar to close and if possible wait for another confirmation. No confirmation most of the time means, trend continuation.
Diamonds are the strongest signal, you might want to to buy/long or sell/short when you see this signals.
Cirles/Dots are trend continuation, shows which way the trend. More of the same color in a row the stronger the prediction. But once you see an orange colored signal then it's possibly going to diverge.
Longer the term/period the more accurate prediction signals will be.
You can enable/disable other tools in the settings:
EMA's, SMA , Bollinger Bands and Pivots .
But also trend colors
Setup your own configurations the way you like. I recommend using Fibonacci seq . Keep in mind, sooner the prediction signals become the more riskier.
update:
- Added bollinger bands with trend color. You can disable or enable this in the settings.
- Modified manipulation conditions.
- Modified buy and sell conditions.
(EMI 2)Epic Market Indicator 2, v1.1Had to do a lot of research and gain more experience. If you take, you should also give. That's why I'm honored to present this new version of EMI 2 to the community. After so many modifications I decided to release a new version; EMI 2 v1.1.
Symbols:
Green Diamond = A possible bottom
Red Diamond = A possible top
update:
-Modified Top & Bottom conditions
-Modified Volume/Money Flow equations
-Modified Up & Down trend conditions
-Modified colors for better oversight
-tip: Use color theme 'Dark'
For full potential usage of this indicator, is knowledge about MACD is recommended. Last advice before using these indicators, 'practice makes perfect'.

(EMI 2)Epic Market Indicator 2Finally it's here, Epic Market Indicator 2.
This is basically a pimped up version of the MACD indicator.
Use it wisely and it will present you enough opportunities
Green diamond is a possible bottom
Red diamond is a possible top
Tip: Use in combination with EMI 1

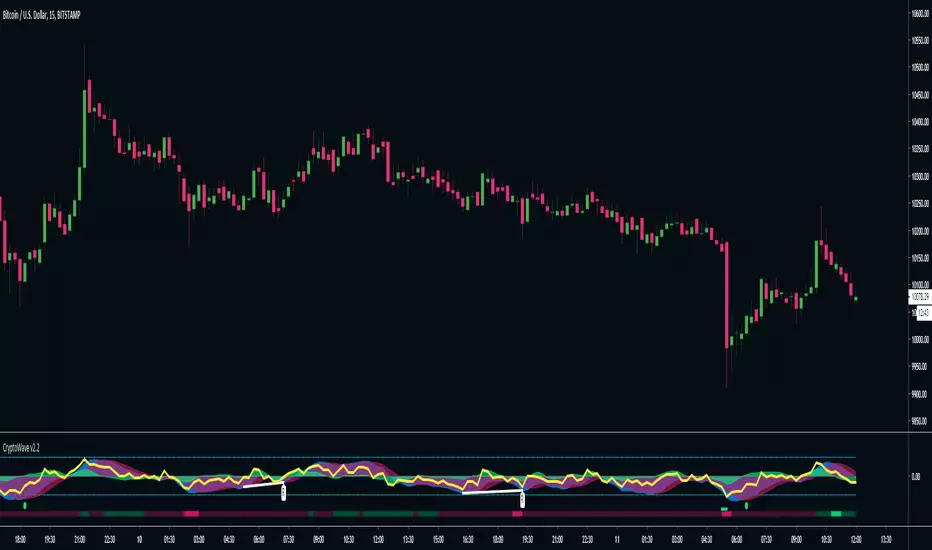
CryptoWave Pro v2CryptoWave Pro v2 delivers the same great wave algorithm as the previous version, but offers more customisation options to allow power users to fine tune every last piece of the puzzle.
In addition to the wave you'll now see the following :
Yellow line = RSI
Red and Green lines (above and below the waves dots) = RSI OB and OS
White lines + labels = Wave Divergence indicator - Showing Regular and Hidden divergences
Coloured Bar at bottom = Money Flow - Bright Red = OS, Bright Green = OB
Super clean and easy to read at a glance, CryptoWave Pro v2 is the upgrade you've been waiting for!
Indicador MPB Meu Primeiro BitcoinIndicador para comprar e vender Bitcoins!
Criado para auxiliar em sua decisoes de compra ou vende da moeda!
Simples, fácil e muito util para seus trades!

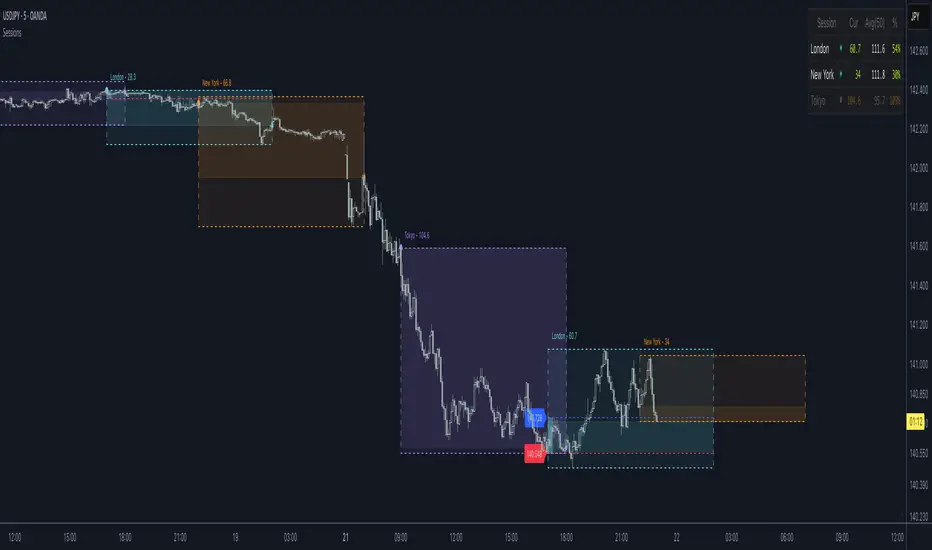
Kill Zone Box ASIA LONDRES NYCBox of good time zones to make trade in each session of the market, I can set the time, colors. Mark the high and low of the day and leave the mark to review the day after.

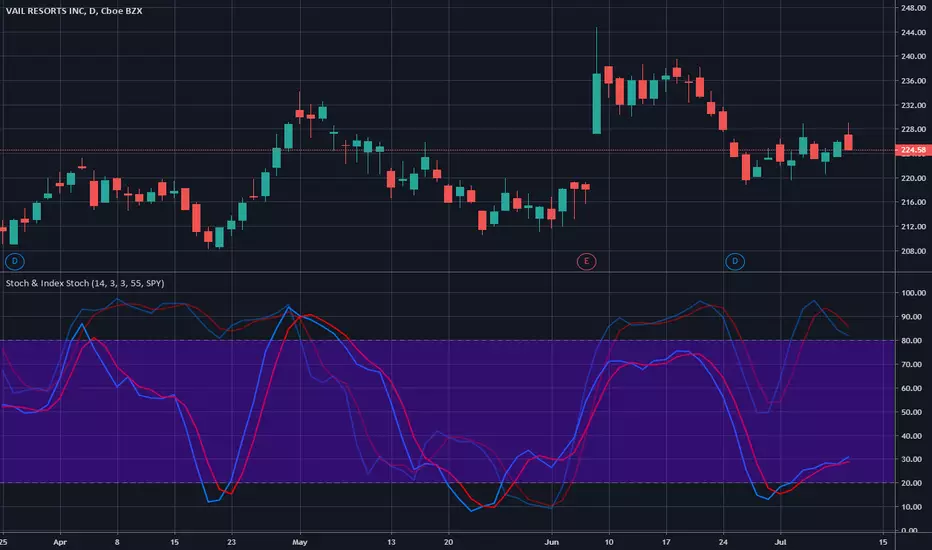
Stochastic & Index StochasticUsing this indicator you will be able to use the standard stochastic of a stock ticker as well as the stochastic of a stock market index simultaneously and without changing charts - both stochastics combined in only one indicator.
The stock market index stochastic can be changed in the indicator settings and is displayed with higher transparency. The degree of transparency and default color settings can also be adjusted.
For special analysis purposes, it is possible to display only the stochastic of the selected stock ticker or only the stochastic of the selected stock market index.
If you would like to test or use this indicator please drop me a line and send a request for it.
Boring Indicator [ALERTS] [Pretty cool tho]Umm, it's pretty boring indicator, you just buy/long when you see buy and you sell/short when you see sell.
Kinda it's like Market God indicator except that it's better and it took me like 10 minutes to figure it out.
Does it repaints?
I mean... kinda yes and kinda not, signal may start blinking but usually it stays in same place, so even if it disappers for few seconds it should come back.
If you want to be 100% sure, wait for close of candle where it appears.
* Works best on Heikin Ashi candles, so try them.
* Alerts are fine, just set them, probably you will figure out how.
* Should work on crypto mostly, probably stocks too (though remember that they are slower so try on 1day? up to you)
* Should work on any timeframe but 45m BITMEX:ETHUSD is nice for me and I trade there, consider that market doesn't moves 1435236 dollars every candle so well, its better if you wait on longer candle than try to trade on 1m.
Enjoy.
If you want to give me some more money for energy drinks and pizza:
BTC address: 3BMEXhXUAFj39D799zzfU1UAhx4NYSqCog
Oh and share it to friends and family.

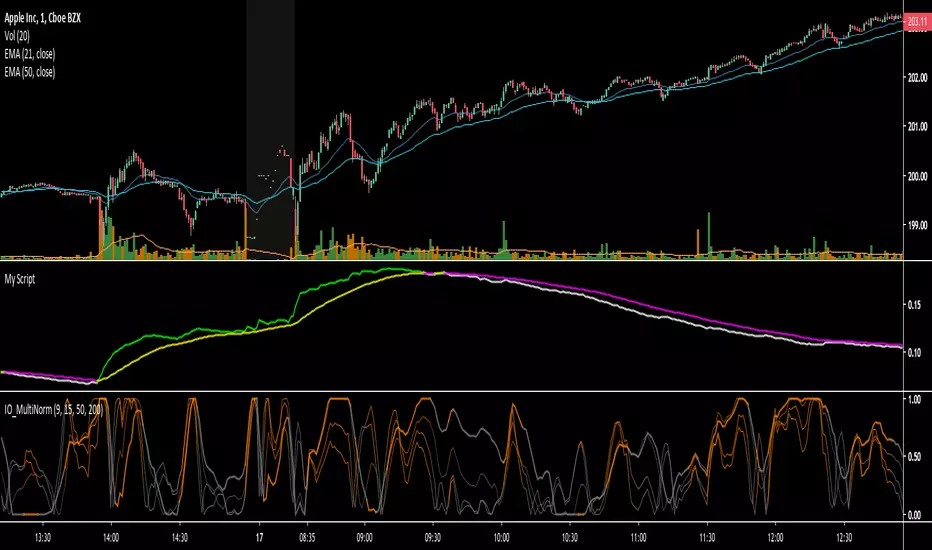
IO_MultiNormMultiNorm is an oscillator used for trend and volatility analysis.
Original Idea by Invsto.
Fx220 Market Sessions IndicatorFx220 NATION! Welcome. Here's a script to add the Market Sessions without altering any settings! Enjoy - Brian

Market Type IdentifierHelps to evaluate if a market is crypto, forex or stocks. Useful if you want to use specific Ichimoku settings or certain moving averages without having to manually change the settings. This is mostly provided for other Pinescript coders, so will not be useful as a standalone indicator

AG Market QualityGiven that we are primarily focussed on trend-following, we built this indicator in a quest to assess the "quality" of a market. It was adapted primarily from methods that trading coach Dr. Van Tharp popularised, namely to do with his SQN.
This indicator has 5 zones that act to classify the market:
Strong Bull - Dark Green
Bull - Green
Neutral - Grey
Bear - Red
Strong Bear - Dark Red
The black line is an SMA(20) of Market Quality (indicating average quality over a period).
The simplistic theory is to look for long trades when the quality is indicating bull or strong bull conditions (green or dark green), and look for short trades when the quality is indicating bear or strong bear conditions (red or dark red). When the quality is in neutral territory (grey bars), the market is choppy/sideways/rangebound, and it's generally best to stay out in these conditions (for trend-followers).
We like to look for long trades when the quality is bull or strong bull, and above the average quality (black line), and look for short trades when the quality is bear or strong bear, and below the average quality.
So, not only does this indicator help you decide when to get in the market, it also tells you when to stay out of the market - really handy!
You can change the periods of the Market Quality, and also the SMA measuring average quality.

USD Coin Market CapThis is USD Coin (USDC) Market Cap with some additional features.
What is included
Dynamic market capitalization chart
Customizable SMA of the market capitalization
Crossovers highlighting
You can set alerts for crossovers with SMA
Alert for the specified positive % change
Alert for the specified negative % change
NOTE: The word "Dynamic" means that I didn't use any kind of the scalar values.
