Funamental and financialsEarnings and Quarterly reporting and fundamental data at a glance.
A study of the financial data available by the "financial" functions in pinescript/tradingview
As far as I know, this script is unique. I found very few public examples of scripts using the fundamental data. and none that attempt to make the data available in a useful form
as an indicator / chart data. The only fitting category when publishing would be "trend analysis" We are going to look at the trend of the quarterly reports.
The intent is to create an indicator that instantly show the financial health of a company, and the trends in debt, cash and earnings
Normal settings displays all information on a per share basis, and should be viewed on a Daily chart
Percentage of market valuation can be used to compare fundamentals to current share price.
And actual to show the full numbers for verification with quarterly reporting and debuggging (actual is divided by 1.000.000 to keep numbers readable)
Credits to research study by Alex Orekhov (everget) for the Symbol Info Helper script
without it this would still be an unpublished mess, the use of textboxes allow me to remove many squiggly plot lines of fundamental data
Known problems and annoyances
1. Takes a long time to load. probably the amount of financial calls is the culprit. AFAIK not something i can to anything about in the script.
2. Textboxes crowd each other. dirty fix with hardcoded offsets. perhaps a few label offset options in the settings would do?
3. Only a faint idea of how to put text boxes on every quarter. Need time... (pun intended)
Have fun, and if you make significant improvements on this, please publish, or atleast leave a comment or message so I can consider adding it to this script.
© sjakk 2020-june-08
Marketcap

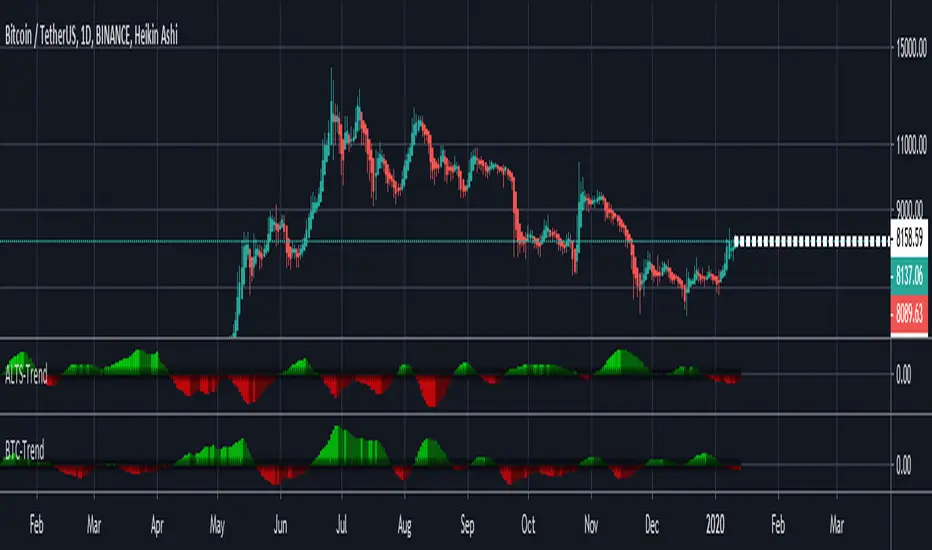
ALTS-Trend
ALTS-Trend
Altcoins-Trend is a technique that shows how much Altcoins is dominating the Marketcap and it's effect over the whole Crypto Market ,and that will show you alts season in each time frame because trend is relative .
*** Features
* Color grading to show you the Increase of domination effect (Green).
* Color grading to show you the Decrease of domination effect (Red) .
* Better understanding to the market ,and that will help you with a very good timed trades at the best trading times for altcoins .
/////////////////////////////////////////////
*Note
Special thanks for Lazybear for his momentum algorithm .
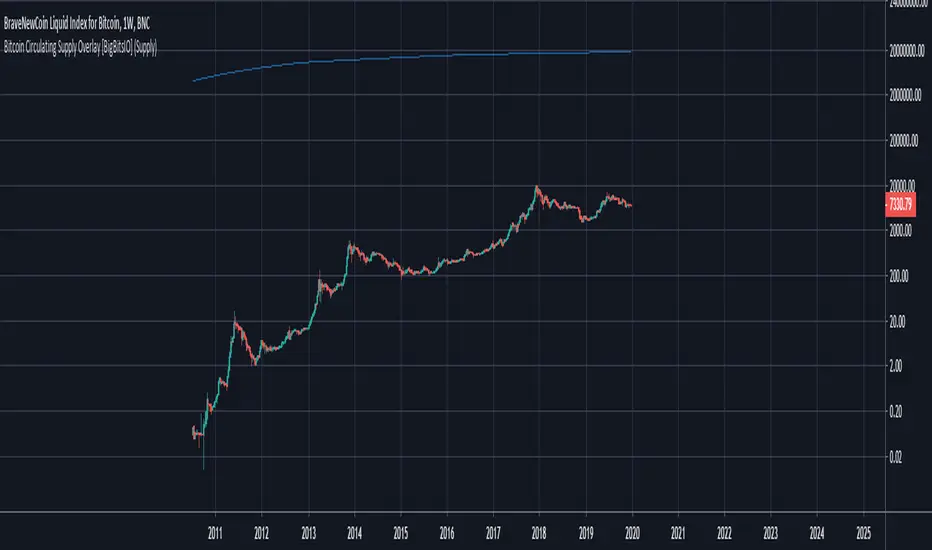
Bitcoin Circulating Supply Overlay [BigBitsIO]This script shows the estimated circulating supply of Bitcoin on any given day.
Features:
- Estimated Bitcoin circulating supply calculated daily
- Uses the Bitcoin reward schedule, past halving dates, and the next upcoming halving estimated date to calculate the current estimated supply.
- Optionally includes an option to use "Log Reduction" on the chart
*** DISCLAIMER: For educational and entertainment purposes only. Nothing in this content should be interpreted as financial advice or a recommendation to buy or sell any sort of security or investment including all types of crypto. DYOR, TYOB. ***
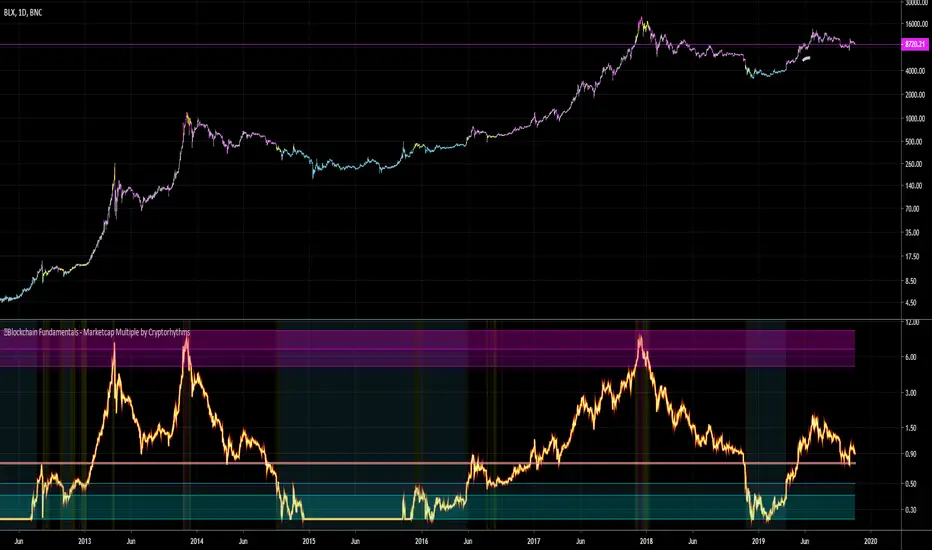
🔗Blockchain Fundamentals - Marketcap Multiple by Cryptorhythms🔗Blockchain Fundamentals - Marketcap Multiple by Cryptorhythms
Intro
A brand new original indicator to judge long term bitcoin accumulation and distribution zones. Created by myself - theheirophant.
I love the way the indicator MVRV (market value to realized value) works, but there's no way to replicate it on tradingview as it uses outside data not available in the TV ecosystem. Then while looking at various marketcap alternatives, and idea was plain in front of my face!
Looking at marketcap + top cap + average cap creates a bounded area of price as seen here
Description
So I created an oscillator that shows marketcap's relation to top cap as the upper bound, and average cap as the lower bound. It then is rescaled from 0.25 to 10.
It should be viewed on a logrithmic scale and only works on the daily timeframe. You can enable/disable bar coloration and background highlighting from options.
It can be interpreted as times to accumulate and distribute on a long term basis. It would work well for trading spot markets.
The line at 0.75 acts as a sentiment indicator (above it is bullish, below it is bearish).
👍 Enjoying this indicator or find it useful? Please give me a like and follow (dont forget twitter also)! I post crypto analysis, price action strategies and free indicators regularly.
💬 Questions? Comments? Want to get access to an entire suite of proven trading indicators? Come visit us on telegram and chat. We make timely posts about the market, news, and strategy everyday. Our community isn't open only to subscribers - everyone is welcome to join. (check my sig)
Wasabi Tool+: BTC Dominance & Market Cap (Top 12 Coins)Wasabi Tool+: BTC Dominance & Market Cap (Top 12 Coins)
This indicator is to show the valid and correct bitcoin dominance (in the form of candle bars , not like the previous line style)among the top 12 coins except stable coins as well as the total market cap of the top 12 coins without stable coins .
The line in orange, shown in the chart above, is the original BTC dominance provided by TradingView whereas the candle bar chart is what this indicator illustrates as a correct and valid BTC dominance by default. You can go to the settings to show the top 12 coins market cap as well.
As of now, it looks like the TradingView's BTC dominance is showing some strange and invalid bars probably due to TOTAL2 with some corrupted bars.
* Chart setup:
For the bitcoin dominance, it is strongly recommended for you to apply this indicator to the BTC.D(bitcoin dominance) daily or weekly non-log chart. For the top 12 non-Stable market cap, you can apply it to either TOTAL, BTC, ETH, or XRP daily or weekly chart. For you not to be confused with the T.V.'s chart, please go to the settings and change the default candle chart to line style.
* This indicator will provide a vital information for investors to assess the current market situation.
Here's the list of all top 15 coins included in the calculation:
BTC
ETH
XRP
BCH
EOS
LTC
BNB
BSV
XLM
ADA
TRX
XMR
This indicator won't be shared.
-----
"Korean"
Wasabi Tool+: BTC Dom. + Market Cap (Top 12 Coins w/o Stables)
와사비 툴+: 비트 도미넌스 + 시총 (스테이블 제외 상위 12개 코인)
이전 발표한 시총순위 15개 도미넌스 지표가 캔들바가 아닌 실선이어서 캔들이용자에게 다소 해석의 어려움이 있었는데,
현 지표는 비트 도미넌스와 시총을 선택 표시 가능하고, 실선이 아니라, 캔들로 표시하는 새로운 지표입니다.
현 지표는 스테이블 코인을 제외한 시총순위로 12개의 코인을 선별해서, 스테이블코인을 제외한 비트코인의 도미넌스와 시총순위 12개 총시총을 정확하게 계산해서 캔들 바의 형태로 보여주는 지표입니다.
위의 차트상에 오렌지색선은 트레이딩뷰 제공 비트코인 도미넌스이고, 캔들바 차트가 이 지표가 제공하는 정확한 비트코인 도미넌스 입니다. 셋팅에서 스테이블제외 시총순위 12개 코인 시총을 표시하도록 변경 가능합니다.
현재, 트레이딩뷰의 비트코인 도미넌스는 TOTAL2의 왜곡된 값에 의해 도미넌스 정보도 왜곡된 값을 보여 주고 있는 것 같습니다.
현 지표는 현재 마켓 상황을 판단하는데 도움을 주는 중요한 정보를 정확하게 제공합니다.
* 차트적용
비트코인 도미넌스를 보기 위해서는, 가급적, BTC.D(비트코인 도미넌스) 일봉이나 주봉차트(로그 비적용)에 적용하셔야 합니다. 만일, 12개 시총을 보기위해서는 TOTAL, BTC, ETH, or XRP 일봉이나 주봉 (로그 비적용)을 추천합니다.
* 총 시총에 포함된 12개 탑 코인은 아래와 같습니다.
BTC
ETH
XRP
BCH
EOS
LTC
BNB
BSV
XLM
ADA
TRX
XMR
현 지표는 비공개. 비공유합니다. 가끔 지표시황 공개시 참고하세요.

🔗Blockchain Fundamentals - Average Cap & Top Cap -Cryptorhythms🔗Blockchain Fundamentals - Average Cap & Top Cap (Marketcap Alternatives)
Intro
Last one for a couple days but then I will be back! Here are the marketcap alternatives Average Cap (created by Renato Shirakashi) and Top Cap (created by Willy Woo).
Descriptions
Average Cap
This is the "forever" moving average of Market Cap. The cumulative sum of daily Market Cap values divided by the age of the market in days.
Top Cap
Willy Woo: "I found historically 35x Average Cap picks the market top. This 'Top Cap' together with Delta Cap creates a 'Valuation Bollinger Band'. Top Cap helps us estimate the next top, I would guess at $90k as a minimum (on the early trajectory). Top Cap is very experimental."
👍 Enjoying this indicator or find it useful? Please give me a like and follow! I post crypto analysis, price action strategies and free indicators regularly.
💬 Questions? Comments? Want to get access to an entire suite of proven trading indicators? Come visit us on telegram and chat, or just soak up some knowledge. We make timely posts about the market, news, and strategy everyday. Our community isn't open only to subscribers - everyone is welcome to join.
For Trialers & Chat: t.me

🔗 Blockchain Fundamentals - Thermocap by Cryptorhythms🔗 Blockchain Fundamentals - Thermocap (Marketcap Alternative) by Cryptorhythms
Description
Market capitalization is an indicator for assessing the value of equity in companies. Crypto has inherited the metric from stocks and is having a hard time trying to get rid of it. Problems here are:
Market Cap takes into account all coins distributed so far, not distinguishing lost coins within the circulating supply (or coins intended to be hodled for long periods).
The point is: if a cryptocurrency has a market cap of $1 billion, it doesn’t mean that $1 billion has flown into that asset. One can create a billion coins; sell 2 of them for $2; and thus pump into CoinMarketCap an excess of $999.999.998 in relation to the actual amount that asset has been traded for.
A more appropriate measure of network value was recently put forth by Nic Carter. Remember capital flows in crypto generally do not come in via exchanges (miners notably like to sell OTC). Every buy in an exchange is matched by a sell. Money that comes in = money that goes out.
True inflows (in Bitcoin, at least) are the aggregate of resources spent by miners. And a good proxy for that is the amount these folks are earning back from networks they support in return for their investments. That’s aggregate security spend (or Thermocap): what was actually paid out to miners (coinbase transactions * their price in USD at the time they were mined).
What does it portray?
A more effective measure of wealth in illiquid markets. How much the network has been worth to its maintainers, in cash flows.

USD Coin Market CapThis is USD Coin (USDC) Market Cap with some additional features.
What is included
Dynamic market capitalization chart
Customizable SMA of the market capitalization
Crossovers highlighting
You can set alerts for crossovers with SMA
Alert for the specified positive % change
Alert for the specified negative % change
NOTE: The word "Dynamic" means that I didn't use any kind of the scalar values.

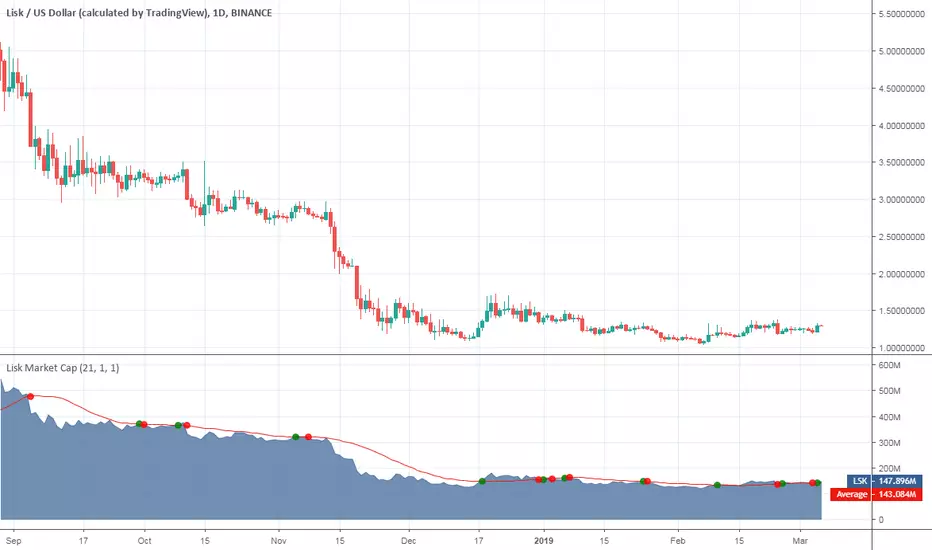
Lisk Market CapThis is Lisk (LSK) Market Cap with some additional features.
What is included
Dynamic market capitalization chart
Customizable SMA of the market capitalization
Crossovers highlighting
You can set alerts for crossovers with SMA
Alert for the specified positive % change
Alert for the specified negative % change
NOTE: The word "Dynamic" means that I didn't use any kind of the scalar values.
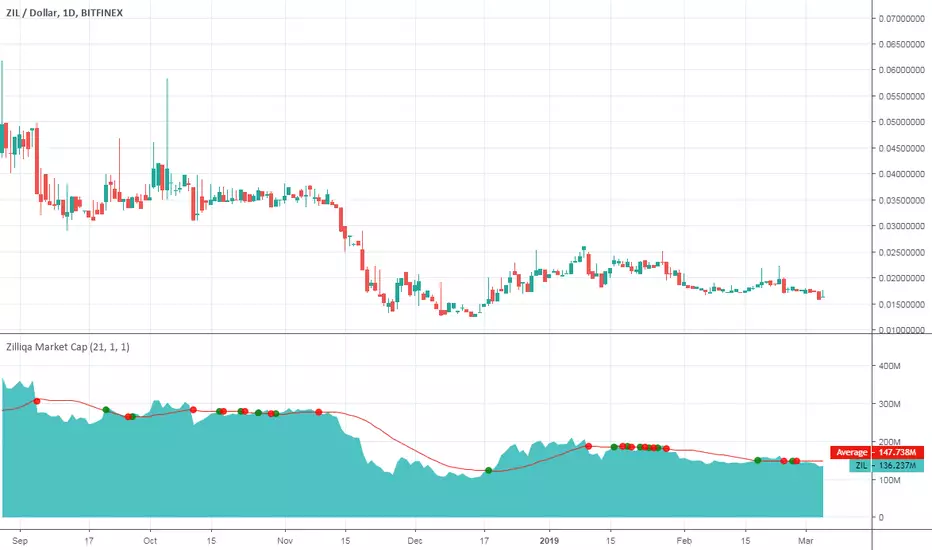
Zilliqa Market CapThis is Zilliqa (ZIL) Market Cap with some additional features.
What is included
Dynamic market capitalization chart
Customizable SMA of the market capitalization
Crossovers highlighting
You can set alerts for crossovers with SMA
Alert for the specified positive % change
Alert for the specified negative % change
NOTE: The word "Dynamic" means that I didn't use any kind of the scalar values.
0x Market CapThis is 0x ("Zero X", ZRX) Market Cap with some additional features.
What is included
Dynamic market capitalization chart
Customizable SMA of the market capitalization
Crossovers highlighting
You can set alerts for crossovers with SMA
Alert for the specified positive % change
Alert for the specified negative % change
NOTE: The word "Dynamic" means that I didn't use any kind of the scalar values.

Augur Market CapThis is Augur (REP) Market Cap with some additional features.
What is included
Dynamic market capitalization chart
Customizable SMA of the market capitalization
Crossovers highlighting
You can set alerts for crossovers with SMA
Alert for the specified positive % change
Alert for the specified negative % change
NOTE: The word "Dynamic" means that I didn't use any kind of the scalar values.

VeChain Market CapThis is VeChain (VET) Market Cap with some additional features.
What is included
Dynamic market capitalization chart
Customizable SMA of the market capitalization
Crossovers highlighting
You can set alerts for crossovers with SMA
Alert for the specified positive % change
Alert for the specified negative % change
NOTE: The word "Dynamic" means that I didn't use any kind of the scalar values.

Ontology Market CapThis is Ontology (ONT) Market Cap with some additional features.
What is included
Dynamic market capitalization chart
Customizable SMA of the market capitalization
Crossovers highlighting
You can set alerts for crossovers with SMA
Alert for the specified positive % change
Alert for the specified negative % change
NOTE: The word "Dynamic" means that I didn't use any kind of the scalar values.

Ethereum Classic Market CapThis is Ethereum Classic (ETC) Market Cap with some additional features.
What is included
Dynamic market capitalization chart
Customizable SMA of the market capitalization
Crossovers highlighting
You can set alerts for crossovers with SMA
Alert for the specified positive % change
Alert for the specified negative % change
NOTE: The word "Dynamic" means that I didn't use any kind of the scalar values.

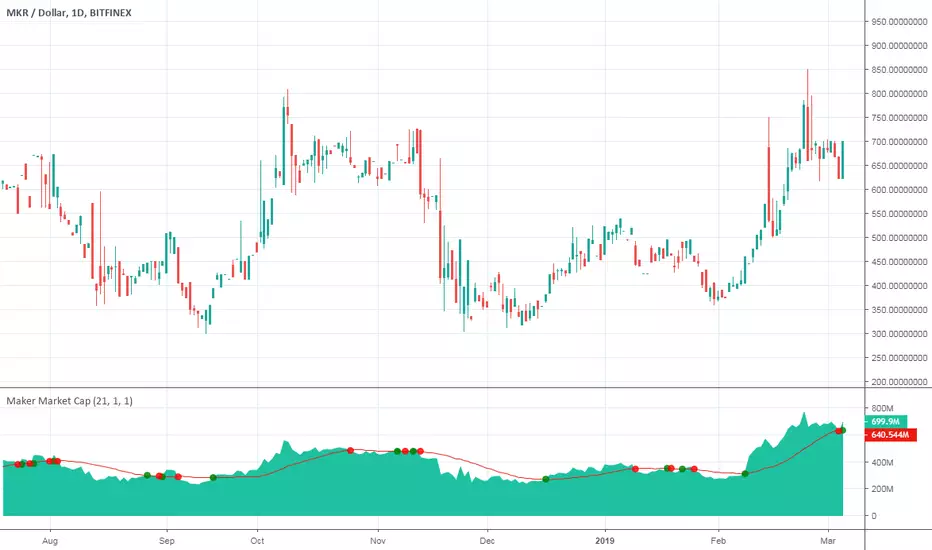
Maker Market CapThis is a dynamic market cap chart of Maker (MKR) cryptocurrency with some additional features.
What is included
Dynamic market capitalization chart
Customizable SMA of the market capitalization
Crossovers highlighting
You can set alerts for crossovers with SMA
Alert for the specified positive % change
Alert for the specified negative % change
NOTE: The word "Dynamic" means that I didn't use any kind of the scalar values.
Coinmarketcap - Live CryptoMarketCap TOP 20Hello everyone,
I hope you are fine.
Today an other important indicator : the TOP 20 crypto market cap !
It's better if you use it on BTC/USD to have more historical data.
Next cryptocurrencies have been used for this indicator :
BTC
ETH
XRP
EOS
BCH
LTC
USDT
TRX
XLM
BSV
ADA
BNB
XMR
IOTA
DASH
NEO
ETC
XEM
USDC
ZEC
Thank you and have a good day :)

SSABU TOTAL / BTC / ETH / USDT Dominance
✅ TOTAL / BTC / ETH / USDT Dominance (total market cap / beat / ethernet / share) indicator.
This indicator is a supplementary indicator for the market share of TOTAL Market Cap / BTC / ETH / USDT.
You can check the above occupation rate in real time through the check box of the input. By default, only the dominance of the bit is set to come out.
If you want to see a different share of the bit, check the check box in the input box.
The above screen shot shows only the dominance of the default setting bit.
✅ TOTAL / BTC / ETH / USDT Dominance (총 마캣캡 / 비트 / 이더 / 유에스디티 점유율) 지표입니다.
본 지표는 TOTAL Market Cap / BTC / ETH / USDT의 점유율을 확인 할 수 있는 보조지표 입니다.
인풋의 체크박스를 통하여 위의 점유율을 실시간으로 확인 할 수 있고 기본으로는 비트의 도미넌스만 나오도록 설정하였습니다.
비트 외의 다른 점유율을 보고 싶으시면 인풋에서 체크박스 체크해주시면 확인 가능합니다.
위의 스크린샷은 기본설정인 비트의 도미넌스만 적용한 모습입니다.
✅ 매매에 도움되는 다른 보조지표
Basel ver 2.21

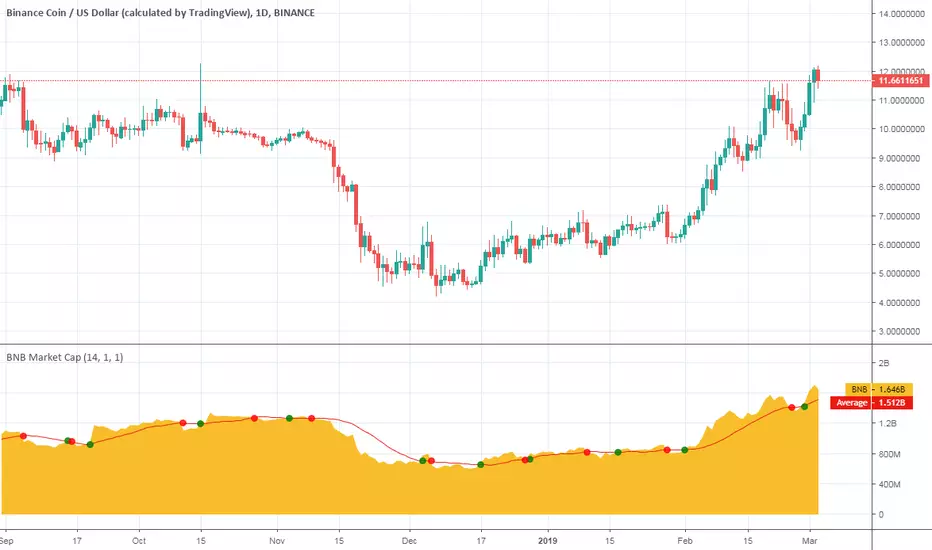
Binance Coin Market CapHey there!
This is Binance Coin market cap with some additional features.
Consider it as my Christmas gift to the community.
What is included
Dynamic market capitalization chart
Customizable SMA of the market capitalization
Crossovers highlighting
You can set alerts for crossovers
Alert for the specified positive % change
Alert for the specified negative % change
NOTE : The word "Dynamic" means that I did not hardcode the supply of the presented coin. You can check it over time.
Good luck and happy trading!
Waltonchain Market CapHey there!
This is Waltonchain market cap with some additional features.
Consider it as my Christmas gift to the community.
What is included
Dynamic market capitalization chart
Customizable SMA of the market capitalization
Crossovers highlighting
You can set alerts for crossovers
Alert for the specified positive % change
Alert for the specified negative % change
NOTE : The word "Dynamic" means that I did not hardcode the supply of the presented coin. You can check it over time.
Good luck and happy trading!

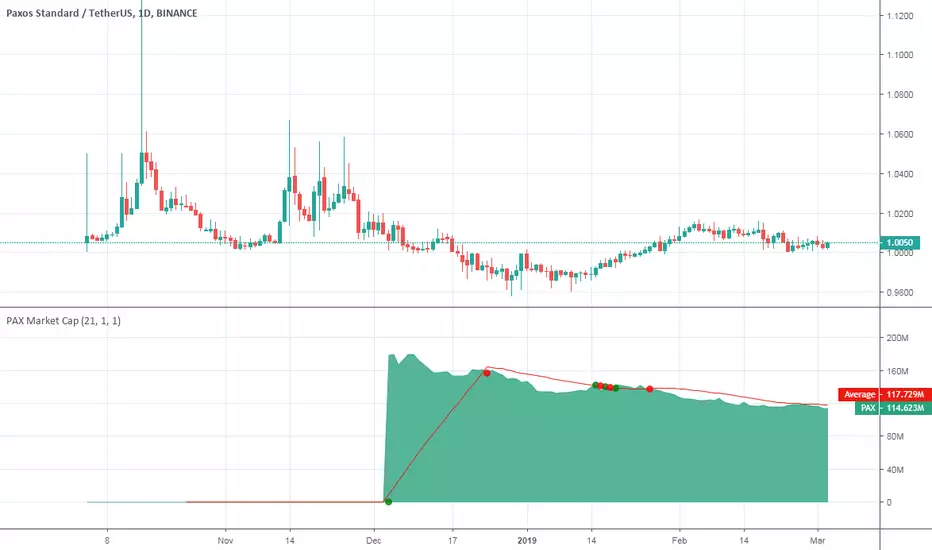
Paxos Standard Token Market CapHey there!
This is Paxos Standard Token market cap with some additional features.
Consider it as my Christmas gift to the community.
What is included
Dynamic market capitalization chart
Customizable SMA of the market capitalization
Crossovers highlighting
You can set alerts for crossovers
Alert for the specified positive % change
Alert for the specified negative % change
NOTE : The word "Dynamic" means that I did not hardcode the supply of the presented stablecoin. You can check it over time.
Good luck and happy trading!
TrueUSD Market CapHey there!
This is TrueUSD (TUSD) market cap with some additional features.
Consider it as my Christmas gift to the community.
What is included
Dynamic market capitalization chart
Customizable SMA of the market capitalization
Crossovers highlighting
You can set alerts for crossovers
Alert for the specified positive % change
Alert for the specified negative % change
NOTE : The word "Dynamic" means that I did not hardcode the supply of the presented stablecoin. You can check it over time.
Good luck and happy trading!

Crypto Mineable vs Not Mineable (Market Caps Ratio)Hello traders!
This indicator shows you the ratio between market capitalizations of the mineable and not mineable cryptocurrencies from TOP-20 (excluding Bitcoin Cash).
NOTE : The market capitalizations are calculated dynamically . The word "dynamically" means that I did not hardcode supplies for presented cryptocurrencies.
What else is included
Alert for the specified positive % change
Alert for the specified negative % change
How to get access
Buy for only 25$ to get lifetime access to this indicator
Like and follow for more cool indicators!
Happy Trading!
