Rolling Log Returns [BackQuant]Rolling Log Returns
The Rolling Log Returns indicator is a versatile tool designed to help traders, quants, and data-driven analysts evaluate the dynamics of price changes using logarithmic return analysis. Widely adopted in quantitative finance, log returns offer several mathematical and statistical advantages over simple returns, making them ideal for backtesting, portfolio optimization, volatility modeling, and risk management.
What Are Log Returns?
In quantitative finance, logarithmic returns are defined as:
ln(Pₜ / Pₜ₋₁)
or for rolling periods:
ln(Pₜ / Pₜ₋ₙ)
where P represents price and n is the rolling lookback window.
Log returns are preferred because:
They are time additive : returns over multiple periods can be summed.
They allow for easier statistical modeling , especially when assuming normally distributed returns.
They behave symmetrically for gains and losses, unlike arithmetic returns.
They normalize percentage changes, making cross-asset or cross-timeframe comparisons more consistent.
Indicator Overview
The Rolling Log Returns indicator computes log returns either on a standard (1-period) basis or using a rolling lookback period , allowing users to adapt it to short-term trading or long-term trend analysis.
It also supports a comparison series , enabling traders to compare the return structure of the main charted asset to another instrument (e.g., SPY, BTC, etc.).
Core Features
✅ Return Modes :
Normal Log Returns : Measures ln(price / price ), ideal for day-to-day return analysis.
Rolling Log Returns : Measures ln(price / price ), highlighting price drift over longer horizons.
✅ Comparison Support :
Compare log returns of the primary instrument to another symbol (like an index or ETF).
Useful for relative performance and market regime analysis .
✅ Moving Averages of Returns :
Smooth noisy return series with customizable MA types: SMA, EMA, WMA, RMA, and Linear Regression.
Applicable to both primary and comparison series.
✅ Conditional Coloring :
Returns > 0 are colored green ; returns < 0 are red .
Comparison series gets its own unique color scheme.
✅ Extreme Return Detection :
Highlight unusually large price moves using upper/lower thresholds.
Visually flags abnormal volatility events such as earnings surprises or macroeconomic shocks.
Quantitative Use Cases
🔍 Return Distribution Analysis :
Gain insight into the statistical properties of asset returns (e.g., skewness, kurtosis, tail behavior).
📉 Risk Management :
Use historical return outliers to define drawdown expectations, stress tests, or VaR simulations.
🔁 Strategy Backtesting :
Apply rolling log returns to momentum or mean-reversion models where compounding and consistent scaling matter.
📊 Market Regime Detection :
Identify periods of consistent overperformance/underperformance relative to a benchmark asset.
📈 Signal Engineering :
Incorporate return deltas, moving average crossover of returns, or threshold-based triggers into machine learning pipelines or rule-based systems.
Recommended Settings
Use Normal mode for high-frequency trading signals.
Use Rolling mode for swing or trend-following strategies.
Compare vs. a broad market index (e.g., SPY or QQQ ) to extract relative strength insights.
Set upper and lower thresholds around ±5% for spotting major volatility days.
Conclusion
The Rolling Log Returns indicator transforms raw price action into a statistically sound return series—equipping traders with a professional-grade lens into market behavior. Whether you're conducting exploratory data analysis, building factor models, or visually scanning for outliers, this indicator integrates seamlessly into a modern quant's toolbox.
Mathematics

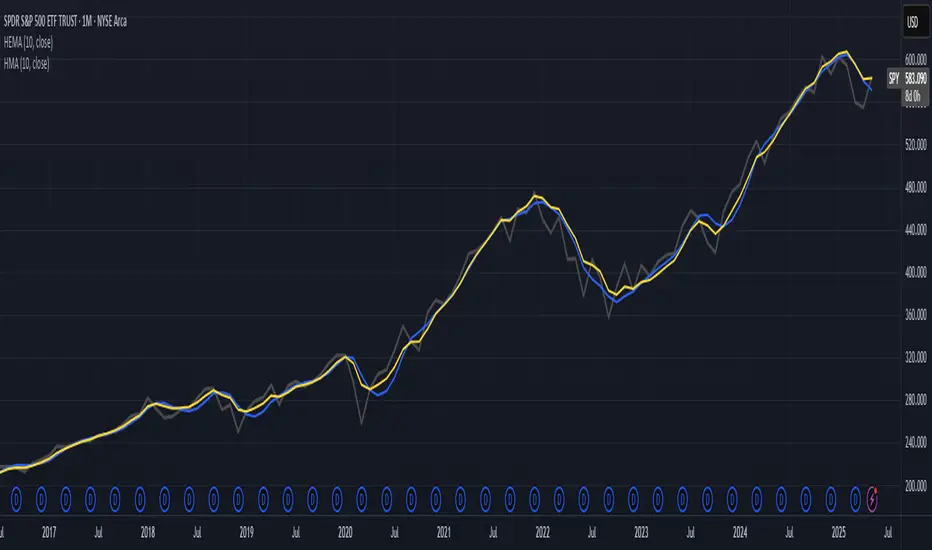
Hull-Exponential Moving Average (HEMA)The Hull Exponential Moving Average (HEMA) is an experimental technical indicator that uses a sequence of Exponential Moving Averages (EMAs) with the same logic as HMA - except with EMAs and not WMAs. It aims to create a responsive yet smooth trend indicator than HMA.
HEMA applies a multi-stage EMA process. Initial EMAs are calculated using alphas derived from logarithmic relationships and the input period. Their outputs are then combined in a de-lagging step, which itself uses a logarithmically derived ratio. A final EMA smoothing pass is then applied to this de-lagged series. This creates a moving average that responds quickly to genuine price changes while maintaining effective noise filtering. The specific alpha calculations and the de-lagging formula contribute to its balance between responsiveness and smoothness.
▶️ **Core Concepts**
Logarithmically-derived alphas: Alpha values for the three EMA stages are derived using natural logarithms and specific formulas related to the input period **N**.
Three-stage EMA process: The calculation involves:
An initial EMA (using **αS**) on the source data.
A second EMA (using **αF**) also on the source data.
A de-lagging step that combines the outputs of the first two EMAs using a specific ratio **r**.
A final EMA (using **αFin**) applied to the de-lagged series.
Specific de-lagging formula: Utilizes a constant ratio **r = ln(2.0) / (1.0 + ln(2.0))** to combine the outputs of the first two EMAs, aiming to reduce lag.
Optimized final smoothing: The alpha for the final EMA (**αFin**) is calculated based on the square root of the period **N**.
Warmup compensation: The internal EMA calculations include a warmup mechanism to provide more accurate values from the initial bars. This involves tracking decay factors (**eS**, **eF**, **eFin**) and applying a compensation factor **1.0 / (1.0 - e_decay)** during the warmup period. A shared warmup duration is determined by the smallest alpha among the three stages.
HEMA achieves its characteristics through this multi-stage EMA process, where the specific alpha calculations and the de-lagging step are key to its responsiveness and smoothness.
▶️ **Common Settings and Parameters**
Period (**N**): Default: 10 | Base lookback period for all alpha calculations | When to Adjust: Increase for longer-term trends and more smoothness, decrease for shorter-term signals and more responsiveness
Source: Default: Close | Data point used for calculation | When to Adjust: Change to HL2, HLC3, or OHLC4 for different price representations
Pro Tip: The HEMA's behavior is sensitive to the **Period** setting due to the non-linear relationships in its alpha calculations. Experiment with values around your typical MA periods. Small changes in **N** can have a noticeable impact, especially for smaller **N** values.
▶️ **Calculation and Mathematical Foundation**
Simplified explanation:
HEMA calculates its value through a sequence of three Exponential Moving Averages (EMAs) with specially derived smoothing factors (alphas).
Two initial EMAs are calculated from the source price, using alphas **αS** and **αF**.
The outputs of these two EMAs are combined into a "de-lagged" series.
This de-lagged series is then smoothed by a third EMA, using alpha **αFin**, to produce the final HEMA value.
All internal EMAs use a warmup compensation mechanism for improved accuracy on early bars.
Technical formula (let **N** be the input period):
1. Alpha for the first EMA (slow component related):
αS = 3.0 / (2.0 * N - 1.0)
2. Lambda for **αS** (intermediate value):
λS = -ln(1.0 - αS)
Note: **αS** must be less than 1, which implies 2N-1 > 3 or N > 2 for **λS** to be well-defined without NaN from ln of non-positive number. The code uses nz() for robustness but the formula implies this constraint.
3. De-lagging ratio **r**:
r = ln(2.0) / (1.0 + ln(2.0))
(This is a constant, approximately 0.409365)
4. Alpha for the second EMA (fast component related):
αF = 1.0 - exp(-λS / r)
5. Alpha for the final EMA smoothing:
αFin = 2.0 / (sqrt(N) / 2.0 + 1.0)
6. Applying the stages:
**OutputS = EMA_internal(source, αS, eS_state, emaS_state)**
**OutputF = EMA_internal(source, αF, eF_state, emaF_state)**
8. Calculate the de-lagged series:
DeLag = (OutputF / (1.0 - r)) - (r * OutputS / (1.0 - r))
9. Calculate the final HEMA:
HEMA = EMA_internal(DeLag, αFin, eFin_state, emaFin_state)
🔍 Technical Note: The HEMA implementation uses a shared warmup period controlled by **aMin** (the minimum of **αS**, **αF**, **αFin**). During this period, each internal EMA stage still tracks its own decay factor (**eS**, **eF**, **eFin**) to apply the correct compensation. The **nz()** function is used in the code to handle potential NaN values from alpha calculations if **N** is very small (e.g., **N=1** would make **αS=3**, **1-αS = -2**, **ln(-2)** is NaN).
▶️ **Interpretation Details**
HEMA provides several key insights for traders:
When price crosses above HEMA, it often signals the beginning of an uptrend
When price crosses below HEMA, it often signals the beginning of a downtrend
The slope of HEMA provides insight into trend strength and momentum
HEMA creates smooth dynamic support and resistance levels during trends
Multiple HEMA lines with different periods can identify potential reversal zones
HEMA is particularly effective for trend following strategies where both responsiveness and noise reduction are important. It provides earlier signals than traditional EMAs while exhibiting less whipsaw than standard HMA in choppy market conditions. The indicator excels at identifying the underlying trend direction while filtering out minor price fluctuations.
▶️ **Limitations and Considerations**
Experimental nature: As an experimental indicator, HEMA may behave differently from established HMA in certain market conditions
Lag characteristics: While designed to reduce lag, HEMA may exhibit slightly more lag than HMA in some scenarios due to the long tail of EMA
Mathematical complexity: The multi-stage calculation with specialized alpha parameters makes the behavior less intuitive to understand
Parameter sensitivity: Performance can vary significantly with different period settings
Complementary tools: Works best when combined with volume analysis or momentum indicators for confirmation
▶️ **References**
Hull, A. (2005). "Hull Moving Average," Technical Analysis of Stocks & Commodities .
RetryClaude can make mistakes. Please double-check responses.
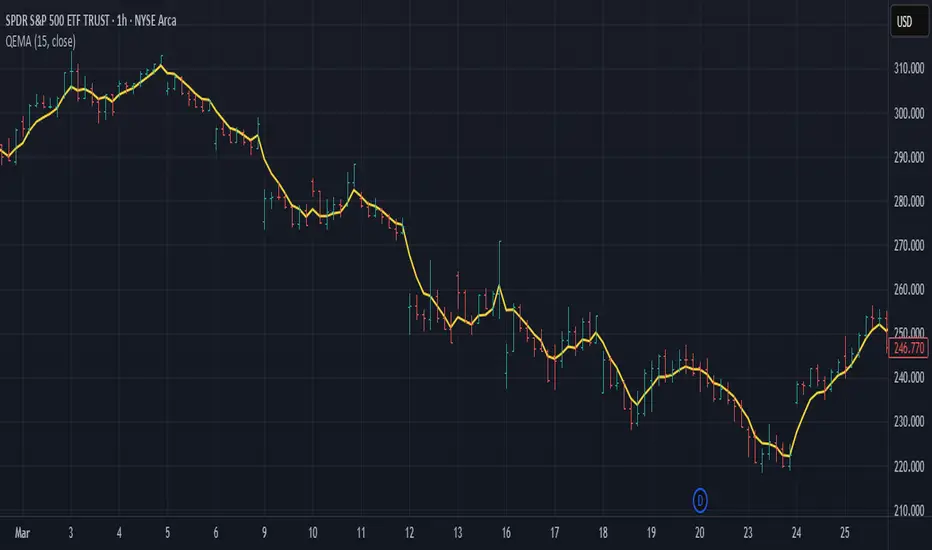
Quadruple EMA (QEMA)The Quadruple Exponential Moving Average (QEMA) is an advanced technical indicator that extends the concept of lag reduction beyond TEMA (Triple Exponential Moving Average) to a fourth order. By applying a sophisticated four-stage EMA cascade with optimized coefficient distribution, QEMA provides the ultimate evolution in EMA-based lag reduction techniques.
Unlike traditional compund moving averages like DEMA and TEMA, QEMA implements a progressive smoothing system that strategically distributes alphas across four EMA stages and combines them with balanced coefficients (4, -6, 4, -1). This approach creates an indicator that responds extremely quickly to price changes while still maintaining sufficient smoothness to be useful for trading decisions. QEMA is particularly valuable for traders who need the absolute minimum lag possible in trend identification.
▶️ **Core Concepts**
Fourth-order processing: Extends the EMA cascade to four stages for maximum possible lag reduction while maintaining a useful signal
Progressive alpha system: Uses mathematically derived ratio-based alpha progression to balance responsiveness across all four EMA stages
Optimized coefficients: Employs calculated weights (4, -6, 4, -1) to effectively eliminate lag while preserving compound signal stability
Numerical stability control: Implements initialization and alpha distribution to ensure consistent results from the first calculation bar
QEMA achieves its exceptional lag reduction by combining four progressive EMAs with mathematically optimized coefficients. The formula is designed to maximize responsiveness while minimizing the overshoot problems that typically occur with aggressive lag reduction techniques. The implementation uses a ratio-based alpha progression that ensures each EMA stage contributes appropriately to the final result.
▶️ **Common Settings and Parameters**
Period: Default: 15| Base smoothing period | When to Adjust: Decrease for extremely fast signals, increase for more stable output
Alpha: Default: auto | Direct control of base smoothing factor | When to Adjust: Manual setting allows precise tuning beyond standard period settings
Source: Default: Close | Data point used for calculation | When to Adjust: Change to HL2 or HLC3 for more balanced price representation
Pro Tip: Professional traders often use QEMA with longer periods than other moving averages (e.g., QEMA(20) instead of EMA(10)) since its extreme lag reduction provides earlier signals even with longer periods.
▶️ **Calculation and Mathematical Foundation**
Simplified explanation:
QEMA works by calculating four EMAs in sequence, with each EMA taking the previous one as input. It then combines these EMAs using balancing weights (4, -6, 4, -1) to create a moving average with extremely minimal lag and high level of smoothness. The alpha factors for each EMA are progressively adjusted using a mathematical ratio to ensure balanced responsiveness across all stages.
Technical formula:
QEMA = 4 × EMA₁ - 6 × EMA₂ + 4 × EMA₃ - EMA₄
Where:
EMA₁ = EMA(source, α₁)
EMA₂ = EMA(EMA₁, α₂)
EMA₃ = EMA(EMA₂, α₃)
EMA₄ = EMA(EMA₃, α₄)
α₁ = 2/(period + 1) is the base smoothing factor
r = (1/α₁)^(1/3) is the derived ratio
α₂ = α₁ × r, α₃ = α₂ × r, α₄ = α₃ × r are the progressive alphas
Mathematical Rationale for the Alpha Cascade:
The QEMA indicator employs a specific geometric progression for its smoothing factors (alphas) across the four EMA stages. This design is intentional and aims to optimize the filter's performance. The ratio between alphas is **r = (1/α₁)^(1/3)** - derived from the cube root of the reciprocal of the base alpha.
For typical smoothing (α₁ < 1), this results in a sequence of increasing alpha values (α₁ < α₂ < α₃ < α₄), meaning that subsequent EMAs in the cascade are progressively faster (less smoothed). This specific progression, when combined with the QEMA coefficients (4, -6, 4, -1), is chosen for the following reasons:
1. Optimized Frequency Response:
Using the same alpha for all EMA stages (as in a naive multi-EMA approach) can lead to an uneven frequency response, potentially causing over-shooting of certain frequencies or creating undesirable resonance. The geometric progression of alphas in QEMA helps to create a more balanced and controlled filter response across a wider range of movement frequencies. Each stage's contribution to the overall filtering characteristic is more harmonized.
2. Minimized Phase Lag:
A key goal of QEMA is extreme lag reduction. The specific alpha cascade, particularly the relationship defined by **r**, is designed to minimize the cumulative phase lag introduced by the four smoothing stages, while still providing effective noise reduction. Faster subsequent EMAs contribute to this reduced lag.
🔍 Technical Note: The ratio-based alpha progression is crucial for balanced response. The ratio r is calculated as the cube root of 1/α₁, ensuring that the combined effect of all four EMAs creates a mathematically optimal response curve. All EMAs are initialized with the first source value rather than using progressive initialization, eliminating warm-up artifacts and providing consistent results from the first bar.
▶️ **Interpretation Details**
QEMA provides several key insights for traders:
When price crosses above QEMA, it signals the beginning of an uptrend with minimal delay
When price crosses below QEMA, it signals the beginning of a downtrend with minimal delay
The slope of QEMA provides immediate insight into trend direction and momentum
QEMA responds to price reversals significantly faster than other moving averages
Multiple QEMA lines with different periods can identify immediate support/resistance levels
QEMA is particularly valuable in fast-moving markets and for short-term trading strategies where speed of signal generation is critical. It excels at capturing the very beginning of trends and identifying reversals earlier than any other EMA-derived indicator. This makes it especially useful for breakout trading and scalping strategies where getting in early is essential.
▶️ **Limitations and Considerations**
Market conditions: Can generate excessive signals in choppy, sideways markets due to its extreme responsiveness
Overshooting: The aggressive lag reduction can create some overshooting during sharp reversals
Calculation complexity: Requires four separate EMA calculations plus coefficient application, making it computationally more intensive
Parameter sensitivity: Small changes in the base alpha or period can significantly alter behavior
Complementary tools: Should be used with momentum indicators or volatility filters to confirm signals and reduce false positives
▶️ **References**
Mulloy, P. (1994). "Smoothing Data with Less Lag," Technical Analysis of Stocks & Commodities .
Ehlers, J. (2001). Rocket Science for Traders . John Wiley & Sons.
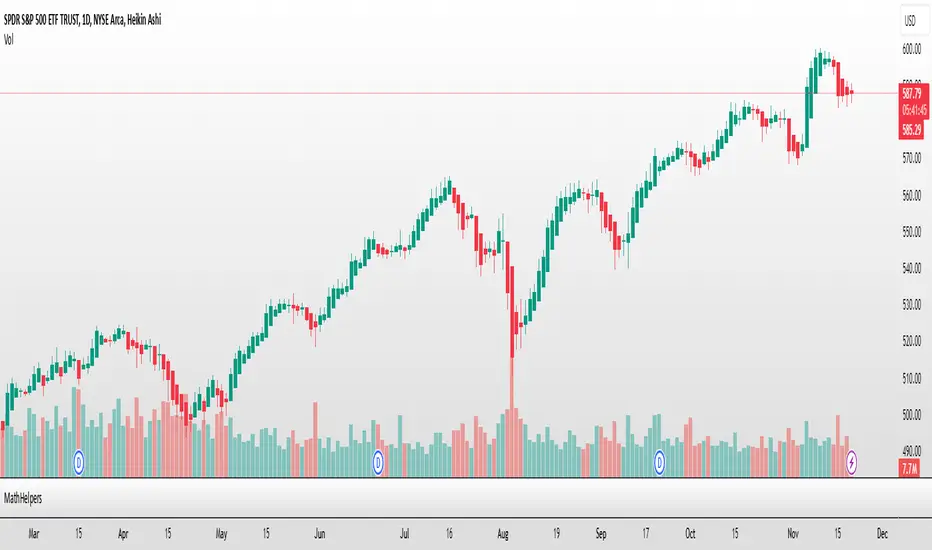
MathHelpersLibrary "MathHelpers"
Overview
A collection of helper functions for designing indicators and strategies.
calculateATR(length, log)
Calculates the Average True Range (ATR) or Log ATR based on the 'log' parameter. Sans Wilder's Smoothing
Parameters:
length (simple int)
log (simple bool)
Returns: float The calculated ATR value. Returns Log ATR if `log` is true, otherwise returns standard ATR.
CDF(z)
Computes the Cumulative Distribution Function (CDF) for a given value 'z', mimicking the CDF function in "Statistically Sound Indicators" by Timothy Masters.
Parameters:
z (simple float)
Returns: float The CDF value corresponding to the input `z`, ranging between 0 and 1.
logReturns(lookback)
Calculates the logarithmic returns over a specified lookback period.
Parameters:
lookback (simple int)
Returns: float The calculated logarithmic return. Returns `na` if insufficient data is available.
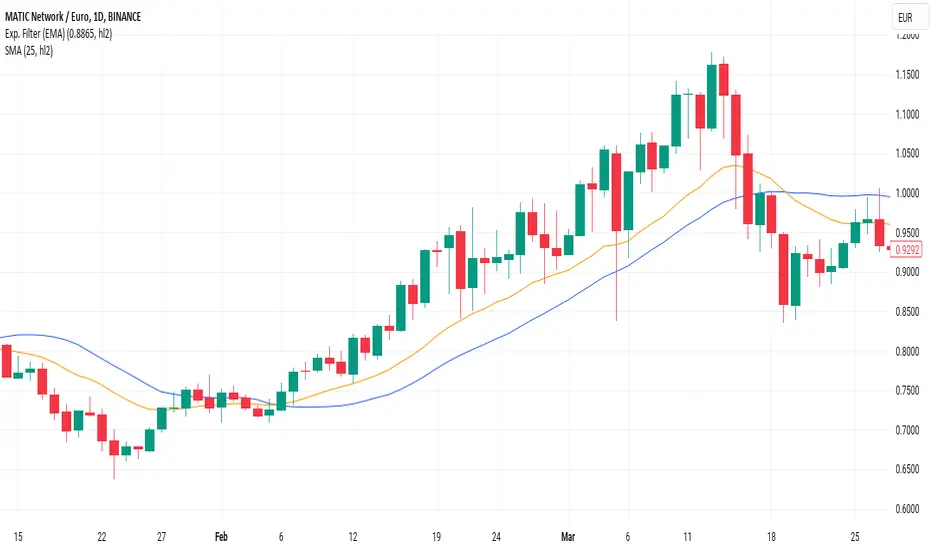
Exponential Smoothing FilterThe digital exponential filter, in finance known as Exponential Moving Average (EMA) , can be used as a technical indicator for chart analysis to visualize uptrends and downtrends in the market. Unlike the classic simple moving average, the EMA requires only two values for its calculation: the last calculated exponential average price and the current price. This is a simple and fast calculation - even for wide smoothing windows. For further details and the math please refer to the "exponential smoothing" article on Wikipedia.
Here are some additional key points about the exponential moving average:
The EMA can react more quickly to price changes because it can give more weight to current prices - depending on your parameter settings.
Short-term, disruptive price fluctuations are smoothed out well, making prevailing trends more visible.
Despite good smoothing properties, it delays the input values slightly, so it can follow sudden trend changes well.
The EMA is well suited to dynamic markets and trading strategies.
The filter is a good basis for further processing such as gradient analysis.
How to use
When you add the script to your charts, you'll immediately see a thin orange line across your time series, smoothing out price fluctuations.
There are only two parameters to set
smoothing factor between 0.0000 = no smoothing and 0.9999 = strong smoothing
input source : open, high, low, close hl2, etc.
Chart output
In the example chart above, you can see that the orange line follows the highs and lows better than the blue line , which is a simple moving average (SMA).
Additionally, the orange line has a shorter lag, or reacts faster when the trend of the original price data suddenly changes. These characteristics are critical for buying and selling decisions: quickly reacting and tracking highs and lows while providing a smooth line that filters out distracting noise.
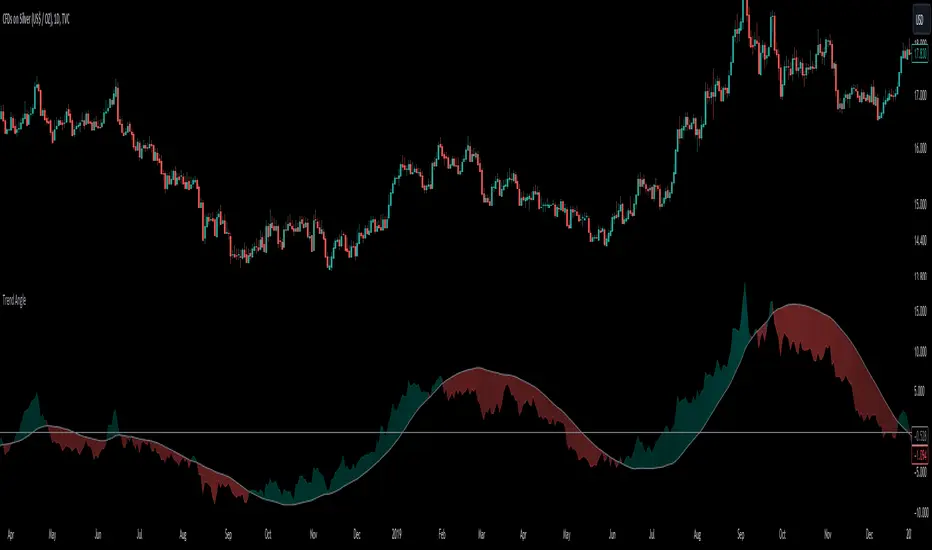
Trend AngleThe "Trend Angle" indicator serves as a tool for traders to decipher market trends through a methodical lens. It quantifies the inclination of price movements within a specified timeframe, making it easy to understand current trend dynamics.
Conceptual Foundation:
Angle Measurement: The essence of the "Trend Angle" indicator is its ability to compute the angle between the price trajectory over a defined period and the horizontal axis. This is achieved through the calculation of the arctangent of the percentage price change, offering a straightforward measure of market directionality.
Smoothing Mechanisms: The indicator incorporates options for "Moving Average" and "Linear Regression" as smoothing mechanisms. This adaptability allows for refined trend analysis, catering to diverse market conditions and individual preferences.
Functional Versatility:
Source Adaptability: The indicator affords the flexibility to select the desired price source, enabling users to tailor the angle calculation to their analytical framework and other indicators.
Detrending Capability: With the detrending feature, the indicator allows for the subtraction of the smoothing line from the calculated angle, highlighting deviations from the main trend. This is particularly useful for identifying potential trend reversals or significant market shifts.
Customizable Period: The 'Length' parameter empowers traders to define the observation window for both the trend angle calculation and its smoothing, accommodating various trading horizons.
Visual Intuition: The optional colorization enhances interpretability, with the indicator's color shifting based on its relation to the smoothing line, thereby providing an immediate visual cue regarding the trend's direction.
Interpretative Results:
Market Flatness: An angle proximate to 0 suggests a flat market condition, indicating a lack of significant directional movement. This insight can be pivotal for traders in assessing market stagnation.
Trending Market: Conversely, a relatively high angle denotes a trending market, signifying strong directional momentum. This distinction is crucial for traders aiming to capitalize on trend-driven opportunities.
Analytical Nuance vs. Simplicity:
While the "Trend Angle" indicator is underpinned by mathematical principles, its utility lies in its simplicity and interpretative clarity. However, it is imperative to acknowledge that this tool should be employed as part of a comprehensive trading strategy , complemented by other analytical instruments for a holistic market analysis.
In essence, the "Trend Angle" indicator exemplifies the harmonization of simplicity and analytical rigor. Its design respects the complexity of market behaviors while offering straightforward, actionable insights, making it a valuable component in the arsenal of both seasoned and novice traders alike.
Trig-Log Scaled Momentum OscillatorTaylor Series Approximations for Trigonometry:
1. The indicator starts by calculating sine and cosine values of the close price using Taylor Series approximations. These approximations use polynomial terms to estimate the values of these trigonometric functions.
Mathematical Component Formation:
2. The calculated sine and cosine values are then multiplied together. This gives us the primary mathematical component, termed as the 'trigComponent'.
Smoothing Process:
3. To ensure that our indicator is less susceptible to market noise and more reactive to genuine price movements, this 'trigComponent' undergoes a smoothing process using a simple moving average (SMA). The length of this SMA is defined by the user.
Logarithmic Transformation:
4. With our smoothed value, we apply a natural logarithm approximation. Again, this approximation is based on the Taylor expansion. This step ensures that all resultant values are positive and offers a different scale to interpret the smoothed component.
Dynamic Scaling:
5. To make our indicator more readable and comparable over different periods, the logarithmically transformed values are scaled between a range. This range is determined by the highest and lowest values of the transformed component over the user-defined 'lookback' period.
ROC (Rate of Change) Direction:
6. The direction of change in our scaled value is determined. This offers a quick insight into whether our mathematical component is increasing or decreasing compared to the previous value.
Visualization:
7. Finally, the indicator plots the dynamically scaled and smoothed mathematical component on the chart. The color of the plotted line depends on its direction (increasing or decreasing) and its boundary values.

Normal Distribution CurveThis Normal Distribution Curve is designed to overlay a simple normal distribution curve on top of any TradingView indicator. This curve represents a probability distribution for a given dataset and can be used to gain insights into the likelihood of various data levels occurring within a specified range, providing traders and investors with a clear visualization of the distribution of values within a specific dataset. With the only inputs being the variable source and plot colour, I think this is by far the simplest and most intuitive iteration of any statistical analysis based indicator I've seen here!
Traders can quickly assess how data clusters around the mean in a bell curve and easily see the percentile frequency of the data; or perhaps with both and upper and lower peaks identify likely periods of upcoming volatility or mean reversion. Facilitating the identification of outliers was my main purpose when creating this tool, I believed fixed values for upper/lower bounds within most indicators are too static and do not dynamically fit the vastly different movements of all assets and timeframes - and being able to easily understand the spread of information simplifies the process of identifying key regions to take action.
The curve's tails, representing the extreme percentiles, can help identify outliers and potential areas of price reversal or trend acceleration. For example using the RSI which typically has static levels of 70 and 30, which will be breached considerably more on a less liquid or more volatile asset and therefore reduce the actionable effectiveness of the indicator, likewise for an asset with little to no directional volatility failing to ever reach this overbought/oversold areas. It makes considerably more sense to look for the top/bottom 5% or 10% levels of outlying data which are automatically calculated with this indicator, and may be a noticeable distance from the 70 and 30 values, as regions to be observing for your investing.
This normal distribution curve employs percentile linear interpolation to calculate the distribution. This interpolation technique considers the nearest data points and calculates the price values between them. This process ensures a smooth curve that accurately represents the probability distribution, even for percentiles not directly present in the original dataset; and applicable to any asset regardless of timeframe. The lookback period is set to a value of 5000 which should ensure ample data is taken into calculation and consideration without surpassing any TradingView constraints and limitations, for datasets smaller than this the indicator will adjust the length to just include all data. The labels providing the percentile and average levels can also be removed in the style tab if preferred.
Additionally, as an unplanned benefit is its applicability to the underlying price data as well as any derived indicators. Turning it into something comparable to a volume profile indicator but based on the time an assets price was within a specific range as opposed to the volume. This can therefore be used as a tool for identifying potential support and resistance zones, as well as areas that mark market inefficiencies as price rapidly accelerated through. This may then give a cleaner outlook as it eliminates the potential drawbacks of volume based profiles that maybe don't collate all exchange data or are misrepresented due to large unforeseen increases/decreases underlying capital inflows/outflows.
Thanks to @ALifeToMake, @Bjorgum, vgladkov on stackoverflow (and possibly some chatGPT!) for all the assistance in bringing this indicator to life. I really hope every user can find some use from this and help bring a unique and data driven perspective to their decision making. And make sure to please share any original implementaions of this tool too! If you've managed to apply this to the average price change once you've entered your position to better manage your trade management, or maybe overlaying on an implied volatility indicator to identify potential options arbitrage opportunities; let me know! And of course if anyone has any issues, questions, queries or requests please feel free to reach out! Thanks and enjoy.

Source CorrelationIn this small indicator I make it possible for the user to set two different input sources. Then, the indicator displays the correlation of these two input sources. It's a very small script, but I think it could be helpful to somebody to find uncorrelated indicators for his trading strategy. To use uncorrelated indicators is in general recommended.
Enjoy this small, but powerful tool. 🧙♂️

Mad_MATHLibrary "MAD_MATH"
This is a mathematical library where I store useful kernels, filters and selectors for the different types of computations.
This library also contains opensource code from other scripters.
Future extensions are very likely, there are some functions I would like to add, but I have to wait for approvals so i can include them.
Ehlers_EMA(_src, _length)
Calculates the Ehlers Exponential Moving Average (Ehlers_EMA)
Parameters:
_src (float) : The source series for calculation
_length (simple int) : The length for the Ehlers EMA
Returns: The Ehlers EMA value
Ehlers_Gaussian(_src, _length)
Calculates the Ehlers Gaussian Filter
Parameters:
_src (float) : The source series for calculation
_length (simple int) : The length for the Ehlers Gaussian Filter
Returns: The Ehlers Gaussian Filter value
Ehlers_supersmoother(_src, _length)
Calculates the Ehlers Supersmoother
Parameters:
_src (float) : The source series for calculation
_length (simple int) : The length for the Ehlers Supersmoother
Returns: The Ehlers Supersmoother value
Ehlers_SMA_fast(_src, _length)
Calculates the Ehlers Simple Moving Average (SMA) Fast
Parameters:
_src (float) : The source series for calculation
_length (simple int) : The length for the Ehlers SMA Fast
Returns: The Ehlers SMA Fast value
Ehlers_EMA_fast(_src, _length)
Calculates the Ehlers Exponential Moving Average (EMA) Fast
Parameters:
_src (float) : The source series for calculation
_length (simple int) : The length for the Ehlers EMA Fast
Returns: The Ehlers EMA Fast value
Ehlers_RSI_fast(_src, _length)
Calculates the Ehlers Relative Strength Index (RSI) Fast
Parameters:
_src (float) : The source series for calculation
_length (simple int) : The length for the Ehlers RSI Fast
Returns: The Ehlers RSI Fast value
Ehlers_Band_Pass_Filter(_src, _length)
Calculates the Ehlers BandPass Filter
Parameters:
_src (float) : The source series for calculation
_length (simple int) : The length for the Ehlers BandPass Filter
Returns: The Ehlers BandPass Filter value
Ehlers_Butterworth(_src, _length)
Calculates the Ehlers Butterworth Filter
Parameters:
_src (float) : The source series for calculation
_length (simple int) : The length for the Ehlers Butterworth Filter
Returns: The Ehlers Butterworth Filter value
Ehlers_Two_Pole_Gaussian_Filter(_src, _length)
Calculates the Ehlers Two-Pole Gaussian Filter
Parameters:
_src (float) : The source series for calculation
_length (simple int) : The length for the Ehlers Two-Pole Gaussian Filter
Returns: The Ehlers Two-Pole Gaussian Filter value
Ehlers_Two_Pole_Butterworth_Filter(_src, _length)
Calculates the Ehlers Two-Pole Butterworth Filter
Parameters:
_src (float) : The source series for calculation
_length (simple int) : The length for the Ehlers Two-Pole Butterworth Filter
Returns: The Ehlers Two-Pole Butterworth Filter value
Ehlers_Band_Stop_Filter(_src, _length)
Calculates the Ehlers Band Stop Filter
Parameters:
_src (float) : The source series for calculation
_length (simple int) : The length for the Ehlers Band Stop Filter
Returns: The Ehlers Band Stop Filter value
Ehlers_Smoother(_src)
Calculates the Ehlers Smoother
Parameters:
_src (float) : The source series for calculation
Returns: The Ehlers Smoother value
Ehlers_High_Pass_Filter(_src, _length)
Calculates the Ehlers High Pass Filter
Parameters:
_src (float) : The source series for calculation
_length (simple int) : The length for the Ehlers High Pass Filter
Returns: The Ehlers High Pass Filter value
Ehlers_2_Pole_High_Pass_Filter(_src, _length)
Calculates the Ehlers Two-Pole High Pass Filter
Parameters:
_src (float) : The source series for calculation
_length (simple int) : The length for the Ehlers Two-Pole High Pass Filter
Returns: The Ehlers Two-Pole High Pass Filter value
pr(_src, _length)
pr Calculates the percentage rank (PR) of a value within a range.
Parameters:
_src (float) : The source value for which the percentage rank is calculated. It represents the value to be ranked within the range.
_length (simple int) : The _length of the range over which the percentage rank is calculated. It determines the number of bars considered for the calculation.
Returns: The percentage rank (PR) of the source value within the range, adjusted by adding 50 to the result.
smma(_src, _length)
Calculates the SMMA (Smoothed Moving Average)
Parameters:
_src (float) : The source series for calculation
_length (simple int)
Returns: The SMMA value
hullma(_src, _length)
Calculates the Hull Moving Average (HullMA)
Parameters:
_src (float) : The source series for calculation
_length (simple int) : The _length of the HullMA
Returns: The HullMA value
tma(_src, _length)
Calculates the Triple Moving Average (TMA)
Parameters:
_src (float) : The source series for calculation
_length (simple int) : The _length of the TMA
Returns: The TMA value
dema(_src, _length)
Calculates the Double Exponential Moving Average (DEMA)
Parameters:
_src (float) : The source series for calculation
_length (simple int) : The _length of the DEMA
Returns: The DEMA value
tema(_src, _length)
Calculates the Triple Exponential Moving Average (TEMA)
Parameters:
_src (float) : The source series for calculation
_length (simple int) : The _length of the TEMA
Returns: The TEMA value
w2ma(_src, _length)
Calculates the Normalized Double Moving Average (N2MA)
Parameters:
_src (float) : The source series for calculation
_length (simple int) : The _length of the N2MA
Returns: The N2MA value
wma(_src, _length)
Calculates the Normalized Moving Average (NMA)
Parameters:
_src (float) : The source series for calculation
_length (simple int) : The _length of the NMA
Returns: The NMA value
nma(_open, _close, _length)
Calculates the Normalized Moving Average (NMA)
Parameters:
_open (float) : The open price series
_close (float) : The close price series
_length (simple int) : The _length for finding the highest and lowest values
Returns: The NMA value
lma(_src, _length)
Parameters:
_src (float)
_length (simple int)
zero_lag(_src, _length, gamma1, zl)
Calculates the Zero Lag Moving Average (ZeroLag)
Parameters:
_src (float) : The source series for calculation
_length (simple int) : The length for the moving average
gamma1 (simple int) : The coefficient for calculating 'd'
zl (simple bool) : Boolean flag for applying Zero Lag
Returns: An array containing the ZeroLag Moving Average and a boolean flag indicating if it's flat
copyright HPotter, thanks for that great function
chebyshevI(src, len, ripple)
Calculates the Chebyshev Type I Filter
Parameters:
src (float) : The source series for calculation
len (int) : The length of the filter
ripple (float) : The ripple factor for the filter
Returns: The output of the Chebyshev Type I Filter
math from Pafnuti Lwowitsch Tschebyschow (1821–1894)
Thanks peacefulLizard50262 for the find and translation
chebyshevII(src, len, ripple)
Calculates the Chebyshev Type II Filter
Parameters:
src (float) : The source series for calculation
len (int) : The length of the filter
ripple (float) : The ripple factor for the filter
Returns: The output of the Chebyshev Type II Filter
math from Pafnuti Lwowitsch Tschebyschow (1821–1894)
Thanks peacefulLizard50262 for the find
wavetrend(_src, _n1, _n2)
Calculates the WaveTrend indicator
Parameters:
_src (float) : The source series for calculation
_n1 (simple int) : The period for the first EMA calculation
_n2 (simple int) : The period for the second EMA calculation
Returns: The WaveTrend value
f_getma(_type, _src, _length, ripple)
Calculates various types of moving averages
Parameters:
_type (simple string) : The type of indicator to calculate
_src (float) : The source series for calculation
_length (simple int) : The length for the moving average or indicator
ripple (simple float)
Returns: The calculated moving average or indicator value
f_getfilter(_type, _src, _length)
Calculates various types of filters
Parameters:
_type (simple string) : The type of indicator to calculate
_src (float) : The source series for calculation
_length (simple int) : The length for the moving average or indicator
Returns: The filtered value
f_getoszillator(_type, _src, _length)
Calculates various types of Deviations and other indicators
Parameters:
_type (simple string) : The type of indicator to calculate
_src (float) : The source series for calculation
_length (simple int) : The length for the moving average or indicator
Returns: The calculated moving average or indicator value

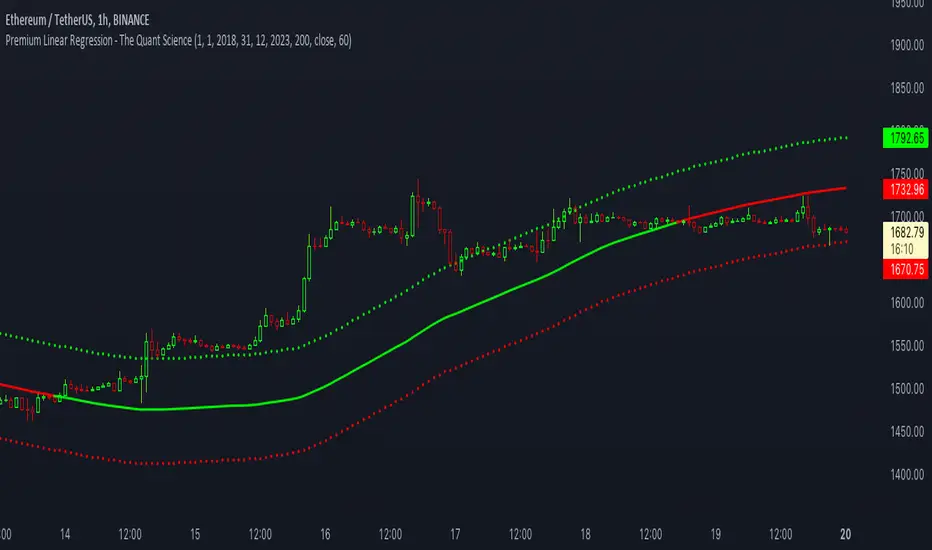
Premium Linear Regression - The Quant ScienceThis script calculates the average deviation of the source data from the linear regression. When used with the indicator, it can plot the data line and display various pieces of information, including the maximum average dispersion around the linear regression.
The code includes various user configurations, allowing for the specification of the start and end dates of the period for which to calculate linear regression, the length of the period to use for the calculation, and the data source to use.
The indicator is designed for multi-timeframe use and to facilitate analysis for traders who use regression models in their analysis. It displays a green linear regression line when the price is above the line and a red line when the price is below. The indicator also highlights areas of dispersion around the regression using circles, with bullish areas shown in green and bearish areas shown in red.
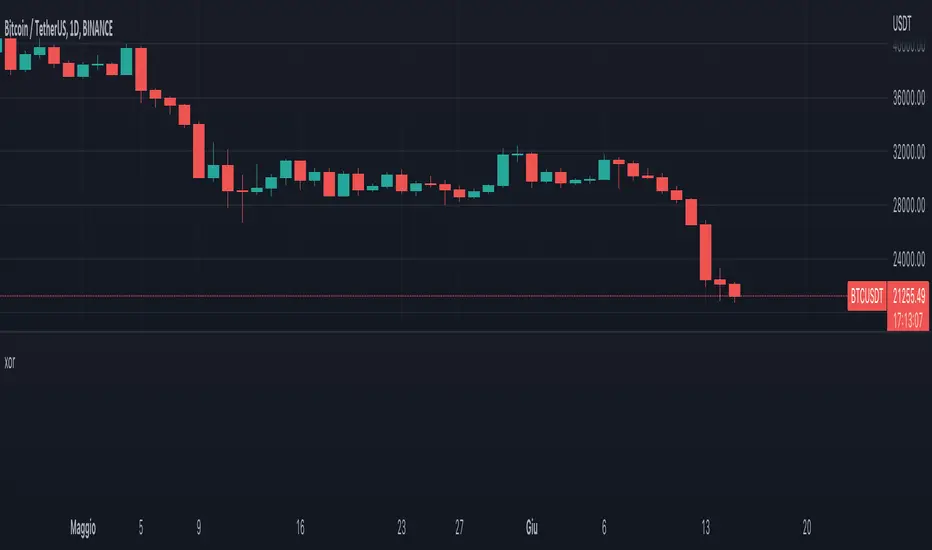
Quantitative Price Forecasting - The Quant ScienceThis script is a quantitative price forecasting indicator that forecasts price changes for a given asset.
The model aims to forecast future prices by analyzing past data within a selected time period. Mathematical probability is used to calculate whether starting from time X can lead to reaching prices Y1 and Y2. In this context, X represents the current selected time period, Y1 represents the selected percentage decrease, and Y2 represents the selected percentage increase. The probabilities are estimated using the simple average.
The simple average is displayed on the chart, showing in red the periods where the price is below the average and in green the periods where the price is above the average.
This powerful tool not only provides forecasts of future prices but also calculates the distribution of variations around the average. It then takes this information and creates an estimate of the average price variation around the simple average.
Using a mean-reverting logic, buying and selling opportunities are highlighted.
We recommend turning off the display of bars on your chart for a better experience when using this indicator.
Unlock the full potential of your trading strategy with our powerful indicator. By analyzing past price data, it provides accurate forecasts and calculates the probability of reaching specific price targets. Its mean-reverting logic highlights buying and selling opportunities, while the simple moving average displayed on the chart shows periods where the price is above or below the average. Additionally, it estimates the average variation of price around the simple average, giving you valuable insights into price movements. Don't miss out on this valuable tool that can take your trading to the next level

Reinforced RSI - The Quant Science This strategy was designed and written with the goal of showing and motivating the community how to integrate our 'Probabilities' module with their own script.
We have recreated one of the simplest strategies used by many traders. The strategy only trades long and uses the overbought and oversold levels on the RSI indicator.
We added stop losses and take profits to offer more dynamism to the strategy. Then the 'Probabilities' module was integrated to create a probabilistic reinforcement on each trade.
Specifically, each trade is executed, only if the past probabilities of making a profitable trade is greater than or equal to 51%. This greatly increased the performance of the strategy by avoiding possible bad trades.
The backtesting was calculated on the NASDAQ:TSLA , on 15 minutes timeframe.
The strategy works on Tesla using the following parameters:
1. Lenght: 13
2. Oversold: 40
3. Overbought: 70
4. Lookback: 50
5. Take profit: 3%
6. Stop loss: 3%
Time period: January 2021 to date.
Our Probabilities Module, used in the strategy example:

xor logical operatorLibrary "xor"
xor(a, b)
xor: Exclusive or, or exclusive disjunction is a logical operation that is true if and only if its arguments differ (one is true, the other is false).
Parameters:
a : first argument
b : second argument
Returns: returns xor (true only if a and b are true, but not both)
Example:
true xor true = false
true xor false = true
false xor true = true
false xor false = false
STDev BandsReally simple script for dynamic support and resistance. Takes means over last 1440 bars (1440 minutes in a day) and calculates seven stdevs up and down.

LibraryPrivateUsage001This is a public library that include the functions explained below. The libraries are considered public domain code and permission is not required from the author if you reuse these functions in your open-source scripts

Prime Number CheckerThis is not a foolproof method for finding every prime number but will work well on assets $10 to $100. I will be working on something more robust with scaling for all assets. If you want a main pane indicator with just the background coloring keep the indicator as it is. If you want a lower pane indicator get rid of the current study function and replace with the commented out study function by deleting the //. Also comment in line 28 also by deleting the //. Prime numbers are an excellent natural mathematical site of reversal and you will begin to see this as you work with them.
Any questions don't be scared to ask.
Eliza.

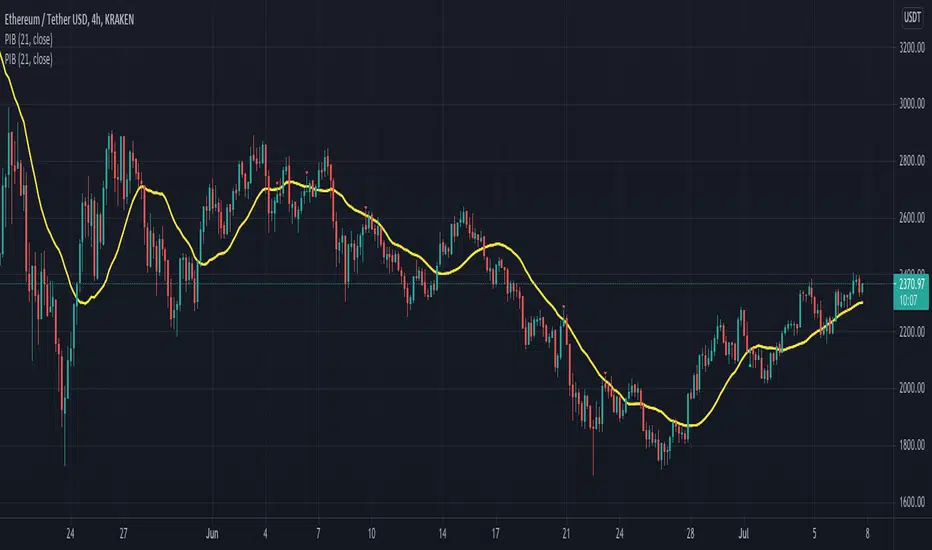
Pinbar-Rejection-IndicatorThis indicator allows you to filter noisy pin bar chart, with pin bars which have been rejected from dynamic support/resistance level also named as 21 Moving Average.
I would consider to work only on higher time frames like 1H and higher, so you really can find only best entries.
Have fun, write your feedback in the comments section:)
P.S This is the first version of the indicator, so be free to contribute, and soon I'm going to improve this indicator.
Matrix Library (Linear Algebra, incl Multiple Linear Regression)What's this all about?
Ever since 1D arrays were added to Pine Script, many wonderful new opportunities have opened up. There has been a few implementations of matrices and matrix math (most notably by TradingView-user tbiktag in his recent Moving Regression script: ). However, so far, no comprehensive libraries for matrix math and linear algebra has been developed. This script aims to change that.
I'm not math expert, but I like learning new things, so I took it upon myself to relearn linear algebra these past few months, and create a matrix math library for Pine Script. The goal with the library was to make a comprehensive collection of functions that can be used to perform as many of the standard operations on matrices as possible, and to implement functions to solve systems of linear equations. The library implements matrices using arrays, and many standard functions to manipulate these matrices have been added as well.
The main purpose of the library is to give users the ability to solve systems of linear equations (useful for Multiple Linear Regression with K number of independent variables for example), but it can also be used to simulate 2D arrays for any purpose.
So how do I use this thing?
Personally, what I do with my private Pine Script libraries is I keep them stored as text-files in a Libraries folder, and I copy and paste them into my code when I need them. This library is quite large, so I have made sure to use brackets in comments to easily hide any part of the code. This helps with big libraries like this one.
The parts of this script that you need to copy are labeled "MathLib", "ArrayLib", and "MatrixLib". The matrix library is dependent on the functions from these other two libraries, but they are stripped down to only include the functions used by the MatrixLib library.
When you have the code in your script (pasted somewhere below the "study()" call), you can create a matrix by calling one of the constructor functions. All functions in this library start with "matrix_", and all constructors start with either "create" or "copy". I suggest you read through the code though. The functions have very descriptive names, and a short description of what each function does is included in a header comment directly above it. The functions generally come in the following order:
Constructors: These are used to create matrices (empy with no rows or columns, set shape filled with 0s, from a time series or an array, and so on).
Getters and setters: These are used to get data from a matrix (like the value of an element or a full row or column).
Matrix manipulations: These functions manipulate the matrix in some way (for example, functions to append columns or rows to a matrix).
Matrix operations: These are the matrix operations. They include things like basic math operations for two indices, to transposing a matrix.
Decompositions and solvers: Next up are functions to solve systems of linear equations. These include LU and QR decomposition and solvers, and functions for calculating the pseudo-inverse or inverse of a matrix.
Multiple Linear Regression: Lastly, we find an implementation of a multiple linear regression, including all the standard statistics one can expect to find in most statistical software packages.
Are there any working examples of how to use the library?
Yes, at the very end of the script, there is an example that plots the predictions from a multiple linear regression with two independent (explanatory) X variables, regressing the chart data (the Y variable) on these X variables. You can look at this code to see a real-world example of how to use the code in this library.
Are there any limitations?
There are no hard limiations, but the matrices uses arrays, so the number of elements can never exceed the number of elements supported by Pine Script (minus 2, since two elements are used internally by the library to store row and column count). Some of the operations do use a lot of resources though, and as a result, some things can not be done without timing out. This can vary from time to time as well, as this is primarily dependent on the available resources from the Pine Script servers. For instance, the multiple linear regression cannot be used with a lookback window above 10 or 12 most of the time, if the statistics are reported. If no statistics are reported (and therefore not calculated), the lookback window can usually be extended to around 60-80 bars before the servers time out the execution.
Hopefully the dev-team at TradingView sees this script and find ways to implement this functionality diretly into Pine Script, as that would speed up many of the operations and make things like MLR (multiple linear regression) possible on a bigger lookback window.
Some parting words
This library has taken a few months to write, and I have taken all the steps I can think of to test it for bugs. Some may have slipped through anyway, so please let me know if you find any, and I'll try my best to fix them when I have time to do so. This library is intended to help the community. Therefore, I am releasing the library as open source, in the hopes that people may improving on it, or using it in their own work. If you do make something cool with this, or if you find ways to improve the code, please let me know in the comments.

[JRL] Murrey Math LinesMurrey Math Lines are support and resistance lines based on geometric mathematical formulas developed by T.
H. Murrey. MM lines are a derivation of the observations of W.D. Gann. Murrey's geometry facilitate the use of Gann's theories in a somewhat easier application. According to Gann's theory, price tends to trend and retrace in 1/8th intervals. The most important MM line levels are the 0/8, 4/8 and 8/8 levels, which typically provide strong support and resistance points. The 3/8 and 5/8 levels represent the low and high of the typical trading range. When price is above the typical trading range, it is considered overbought, and when it is below it is considered oversold. The 2/8 and 6/8 levels provide strong pivot points.
Some of the other Murrey Math indicators on TradingView use different formulas and therefore produce varying results. I've checked my indicator against MM indicators on other platforms and it is consistent with those indicators.
This indicator also allows users to switch to alternative timeframes for analysis and it includes labels for the MM lines. If you have any suggestions or comments, please leave them below.
Cheers!

Newton Force and MomentumThis indicator is meant to show the Force of price, based on Newton's Second Law of Motion; and the momentum of price. Force is the value on the left, and momentum on the right.
Originally this was supposed to only be an indicator looking at Force, but because the already popular indicator called "Momentum" does not calculate the momentum of price, but rather the change of price depending on how far back you want to look; I decided to add the Momentum aspect to the indicator.
*BTW if you find this script useful thank and follow @overttherainbow, because they are the one who gave me the idea for this script.*
