Alpha Trading - Deviation Log Pro - Coder WolvesAlpha Trading - Deviation Log Pro
Here at Alpha Trading we love our indicators built on returns. In our view, the only way to play divergences in Trading is divergences between Returns based oscillators and Price.
The Alpha Trading Deviation Log Pro displays a mean of log returns, with returns and price both weighted using our proprietary root mean square (RMS) Z-Score.
We also show standard error and confidence intervals.
Within the indicator settings, you can apply alerts to the RMS Z Score, as well as an option to turn on triangle and square shapes to assist with showing potential buy/sell and get out of trade signals.
Things to Understand First
Standard Error
The term "standard error" is used to refer to the standard deviation of various sample statistics, such as the mean or median. For example, the "standard error of the mean" refers to the standard deviation of the distribution of sample means taken from a population. The smaller the standard error, the more representative the sample will be of the overall population.
The relationship between the standard error and the standard deviation is such that, for a given sample size, the standard error equals the standard deviation divided by the square root of the sample size. The standard error is also inversely proportional to the sample size; the larger the sample size, the smaller the standard error because the statistic will approach the actual value.
The standard error is considered part of inferential statistics. It represents the standard deviation of the mean within a dataset. This serves as a measure of variation for random variables, providing a measurement for the spread. The smaller the spread, the more accurate the dataset.
Confidence Interval
A confidence interval is a range of values where an unknown population parameter is expected to lie most of the time, if you were to repeat your study with new random samples.
With a 95% confidence level, 95% of all sample means will be expected to lie within a confidence interval of ± 1.96 standard errors of the sample mean.
Settings
• Confidence Intervals plotted with Green and Red Horizontal Lines
• Standard Error Mean - Plotted as a blue dots
• Standard Error Upper - Plotted as a grey line
• Standard Error Lower -Plotted as grey line
• RMS Z-Score Alerts shown as Red and Green Dots
• Potential Buy Signal Green Triangle Up
• Potential Sell Signal - Red Triangle Down
• Get out of Long Trade - White Square
• Get Out of Short Trade - White Square
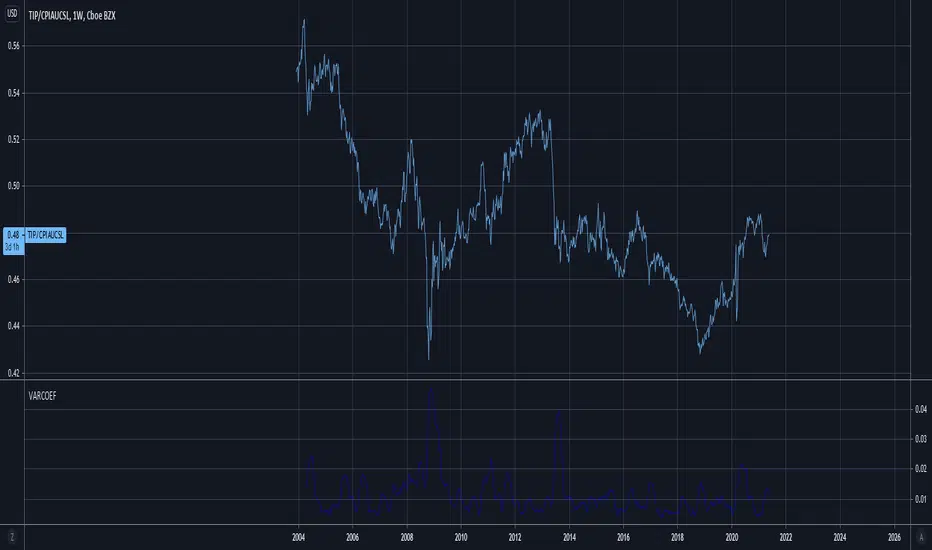
The Chart below is showing the Divergences between Returns and Price Action over a long term trend of a time series, no matter the time frame.
Mean

Alpha Trading - Absolute Mean Entropy with A2 EPPAbsolute Mean Entropy with Alpha Squared Entropy Price Percentile
Entropy
The history of the word ―entropy can be traced back to 1865 when the German physicist Rudolf Clausius tried to give a new name to irreversible heat loss, what he previously called ―equivalent-value.
The word ―entropy was chosen because in Greek, “en+tropein” means “content transformative” or “transformation content”
Since then, entropy has played an important role in thermodynamics and many other scientific fields. Being defined as the sum of “heat supplied” divided by “temperature” it is central to the Second Law of Thermodynamics. It also helps measure the amount of order and disorder and/or chaos.
The application of entropy in finance can be regarded as an extension of “Information Entropy” and “Probability Entropy”
Entropy in Finance can be used in many ways such as Asset Selection, Asset Diversification, Measure an Assets Risk, inputs into Options pricing. While Entropy started in the field of Thermodynamics as aforementioned it has also found a home in Finance. However, studies with entropy in the field of Finance are still in their infancy.
• Entropy is a measure of randomness. Entropy is used to help model and represent the degree of uncertainty of a random variable.
• Entropy is used by financial analysts and market technicians to determine the chances of a specific type of behavior by a security or market.
• Entropy has long been a source of study and debate by market analysts and traders. It is used in quantitative analysis and can help predict the probability that a security will move in a certain direction or according to a certain pattern.
The concept of Entropy is explored in the book "A Random Walk Down Wall Street."
Entropy is plotted below the axis with negative values. Entropy can also colorize the candle color if selected.
R-squared (The Coefficient of Determination)
R-squared is a statistical measurement that examines how differences in one variable can be explained by the difference in a second variable, when predicting the outcome of a given event.
In other words, this coefficient, which is more commonly known as R-squared (or R2), assesses how strong the linear relationship is between two variables, and is heavily relied on by researchers when conducting trend analysis.
To cite an example of its application, this coefficient may contemplate the following question: if an indicator becomes pregnant on a certain day, what is the likelihood that this indicator would deliver a new indicator on a particular date in the future? In this scenario, this metric aims to calculate the correlation between two related events: conception of the indicator and the birth of the indicator.
• The coefficient of determination is a complex idea centered on the statistical analysis of models for data.
• The coefficient of determination is used to explain how much variability of one factor can be caused by its relationship to another factor.
• This coefficient is commonly known as R-squared (or R2) and is sometimes referred to as the "goodness of fit."
• This measure is represented as a value between 0.0 and 1.0, where a value of 1.0 indicates a perfect fit, and is thus a highly reliable model for future forecasts, while a value of 0.0 would indicate that the model fails to accurately model the data at all.
R2 and Price
The hypothesis that R2 is related to investors’ biases in processing information.
This theory motivates an empirical hypothesis that stocks with lower R2 should exhibit more pronounced overreaction-driven price momentum.
Alpha Trading AME/A2 EPP Settings
Settings for AME (Absolute Mean Entropy)
Length: Sample size.
Use as Barcolor: AME color as Price Action Candle color.
Show Entropy Flashes: If absolute value of entropy is very low, it gives yellow color for AME and Price Action Candle color if selected.
Band StdDev: (2 times) AME StdDev bands.1st and 2nd default.
Exponential Weighted Entropy: Weights the AME exponentially, is more reactive, but more noise.
Settings for EPP (Entropy Price Percentile)
Percentile Period: lookback for percentile range(relevant for flashes)
Background flashes: if EPP is below threshold default is below 10%, Flashes green in the background.
Std.err bands period: default 3 and multiplier 1.
EPP Column Meanings
Bright Green: Returns above the mean and increasing.
Dark Green: Returns above the mean and decreasing.
Bright Red: Returns below the mean and increasing.
Dark Red: Returns below the mean and decreasing.
Basic Trade Signal
Long – Value of AME is low, as you see EPP increasing with a coloration of green consider taking a long if you have confluence with other Alpha Trading Indicators.
Short – Value of AME is low, as you see EPP increasing with a coloration of red consider taking a short if you have confluence with other Alpha Trading Indicators.
The Chart below is showing Entries, Exponential Weighting input turned on, Percentile Period set to 30 instead of default 100, everything else is Default....
When using other Alpha Trading indicators in confluence, there are other entries available when the indicator isn't flashing and the indicator still supports the move.
References
www.investopedia.com
www.investopedia.com
www.wallstreetmojo.com
byjus.com
www.investopedia.com
en.wikipedia.org
papers.ssrn.com


Res/Sup With Concavity & Increasing / Decreasing Trend AnalysisPurple means the concavity is down blue means concavity is up which is good.
Yellow means increasing, Red means decreasing.
Sup = Green
Res = Red

Coefficient of variation (standard deviation over mean)Shows the coefficient of variation defined as standard deviation over mean (for the specified window).
Jaws Mean Reversion [Strategy]This very simple strategy is an implementation of PJ Sutherlands' Jaws Mean reversion algorithm. It simply buys when a small moving average period (e.g. 2) is below
a longer moving average period (e.g. 5) by a certain percentage and closes when the small period average crosses over the longer moving average.
If you are going to use this, you may wish to apply this to a range of investment assets using a screener for setups, as the amount signals are low. Alternatively, you may wish to tweak the settings to provide more signals.
Context can be found here:
LINK

Hurst ExponentMy first try to implement Full Hurst Exponent.
The Hurst exponent is used as a measure of long-term memory of time series. It relates to the autocorrelations of the time series and the rate at which these decrease as the lag between pairs of values increases
The Hurst exponent is referred to as the "index of dependence" or "index of long-range dependence". It quantifies the relative tendency of a time series either to regress strongly to the mean or to cluster in a direction.
In short, depending on the value you can spot the trending / reversing market.
Values 0.5 to 1 - market trending
Values 0 to 0.5 - market tend to mean revert
Hurst Exponent is computed using Rescaled range (R/S) analysis.
I split the lookback period (N) in the number of shorter samples (for ex. N/2, N/4, N/8, etc.). Then I calculate rescaled range for each sample size.
The Hurst exponent is estimated by fitting the power law. Basically finding the slope of log(samples_size) to log(RS).
You can choose lookback and sample sizes yourself. Max 8 possible at the moment, if you want to use less use 0 in inputs.
It's pretty computational intensive, so I added an input so you can limit from what date you want it to be calculated. If you hit the time limit in PineScript - limit the history you're using for calculations.
####################
Disclaimer
Please remember that past performance may not be indicative of future results.
Due to various factors, including changing market conditions, the strategy may no longer perform as good as in historical backtesting.
This post and the script don’t provide any financial advice.

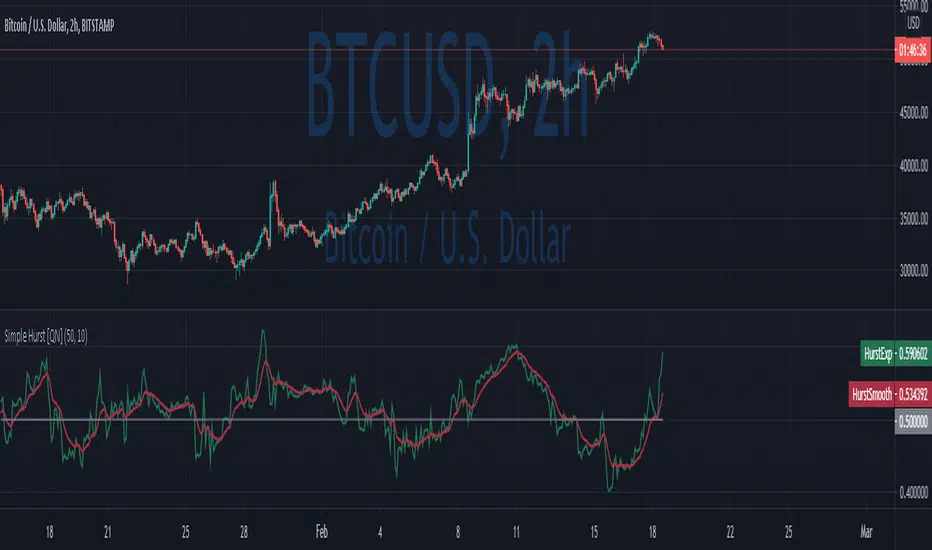
Simple Hurst Exponent [QuantNomad]This is a simplified version of the Hurst Exponent indicator.
In the meantime, I'm working on the full version. It's computationally intensive, so it's a challenge to squeeze it to PineScript limits. It will require some time to optimize it, so I decided to publish a simplified version for now.
The Hurst exponent is used as a measure of long-term memory of time series. It relates to the autocorrelations of the time series, and the rate at which these decrease as the lag between pairs of values increases
The Hurst exponent is referred to as the "index of dependence" or "index of long-range dependence". It quantifies the relative tendency of a time series either to regress strongly to the mean or to cluster in a direction.
In short depend on value you can spot trending / reversing market.
Values 0.5 to 1 - market trending
Values 0 to 0.5 - market tend to mean revert
####################
Disclaimer
Please remember that past performance may not be indicative of future results.
Due to various factors, including changing market conditions, the strategy may no longer perform as good as in historical backtesting.
This post and the script don’t provide any financial advice.
B3 HL2MA Painter ~ Extremely Smooth Average & Bar PaintMy HL2MA is a 'proprietary' formula based on the idea that I never again want to see a jagged average line. I released a version of this a long time ago, but I wanted to update it to how I have it on my charts in other platforms. Here are some notes about this moving average script:
The default input value is 5, and I suggest the range of use 4-6 with the rare occasion of using 3 or 7.
For me 5 is what I use UNLESS I AM IN A TRADE, then I might switch to 4 if I have some profits to lock, or 6 if I want to stay in for a lengthier trade.
This average when kept within the above parameters is the smoothest MA in my arsenal, HL2 refers to the middle of the candles which further de-noises the line.
The colors are green/red for good movement with the confirmed trend.
The colors are gray for movement against the current trend (signaling a possible mean reversion)
The colors blue & yellow appear when signaling possible chop or trend exhaustion.
Carried forward from the last time I posted this, the bias for longs and shorts is depicted as the color of the average line green or maroon, and ALERTS are based on that overall bias created the line by itself.
Also carried from the last post, the green and maroon clouds depict the price deviance from the line; when the cloud stretches wide it may be time to take profits and enter back in closer to the line.
Thanks again for liking and following!!!!
This share is in response to my 10,000th like on TradingView!
Favorite this one, and enjoy :-)


Examples of Rolling Average Using Automated AnchoringIn this study, I present a method to expose NaN values to development environment.
This exposure allows NaN values to be used by methods in scripts.
I also show how to use values, even NaN values, as anchors from which statistics can be computed from.
I demonstrate how to do this with constants and variables in methods for computing the cumulative/rolling average of a series.
I also show how to calculate the cumulative/rolling average from the start of a ticker series using the aforementioned methods.
Each method has a description on how some of their parts work as well as their constraints.
Method #1 - Can only be used for computing the rolling average on the ticker series.
Method #2 - The simple moving average from the Pine Script reference.
- Can be used to calculate the rolling average of the ticker series and number values of a series.
- This method seems to cause an error when there are many bars in the series.
Method #3 - The most versatile method due to the use of computing the rolling average using an array.
- Timeout will occur when computing the rolling average of an entire ticker series which is long.
- Timeout has not occurred when computing a rolling average of a series from NaN or non-NaN anchor points even when the series is long.
This is an attempt to get around the constraints of the built-in sma(source, length) function in which length cannot be dynamically adjusted.
Other Pine Script functions have that constraint which we can get around by defining our own functions.

Study - Mean Reversion Index© fareidzulkifli
Disclaimer:
I always felt Pinescript is a very fast to type language with excellent visualization capabilities, so I've been using it as code-testing platform prior to actual coding in other platform.
Having said that, these study scripts was built only to test/visualize an idea to see its viability and if it can be used to optimize existing strategy.
While some of it are useful and most are useless, none of it should be use as main decision maker.
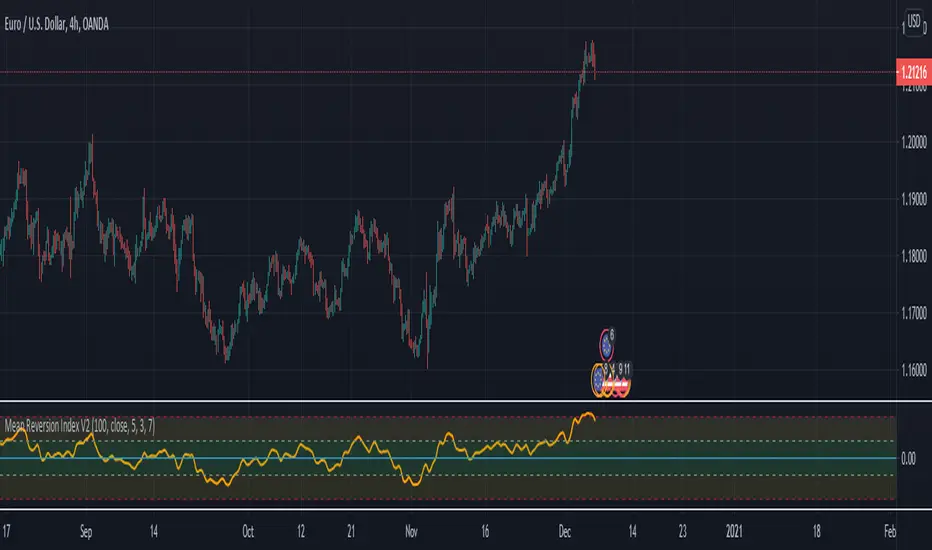
Indicator title : Mean Reversion Index
Description : This index is based on theory that suggests that asset prices and historical returns eventually will revert to the long-run mean or average level of the entire dataset.
Please note that this indicator are not intended to establish a trend bias. It only tells how far the closing price is from the mean price in terms of ATR multiples,
e.g. The green zone indicates that the price is within 3 ATR (default setting) from the mean price.
One way to use it is to determine a safe entry zone to enter current trend from a pullback.
For example, after a sharp retracement during an uptrend, as long as it does not retraced beyond the low of the green zone, Chances are, price is only retraced to its mean value and its not a start of a new downtrend and now ready to continue the uptrend.
More aggressive method to use this is as indicator approaching the higher limit of yellow zone,
prices is to far from the mean and not sustainable, and we can start to look for counter trend opportunity as price reverse to its mean value.
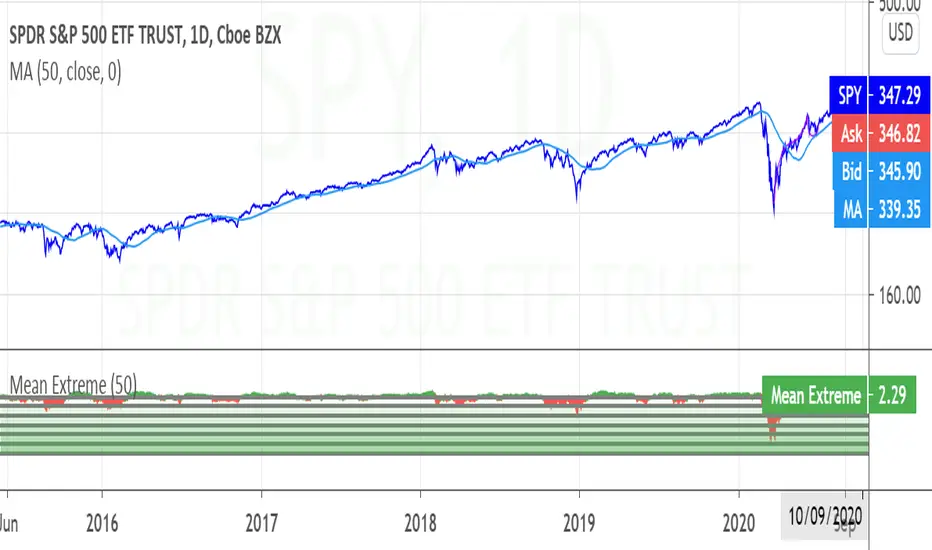
Mean ExtremeA simple script that shows the distance from a the mean, expressed as a percentage.
Simple Moving Average, in this case.
Informational only.
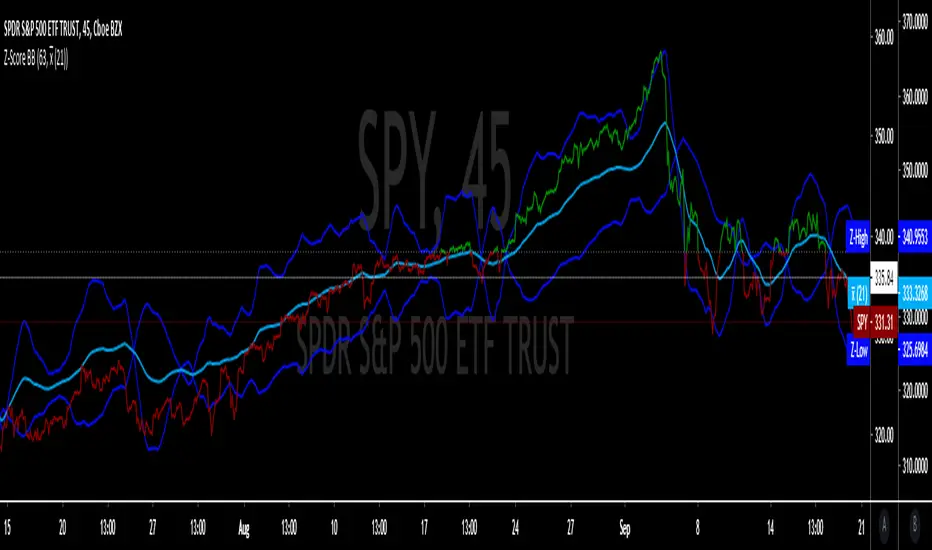
Z-Score 'Bollinger Bands'The following script is an application of the Z-Score (previous script).
Z-Scores can be used in place of standard deviation (sigma) in 'Bollinger Bands'.
The average of the sample (x-bar) over 21 days (N)
21 average trading days per month, fixed value
The average of the population (mu) over 63 days (n)
63 days per quarter, default is set to 63
Z-Score is calculated by formula in previous script, and the absolute value is taken of "Z".
Z-High = absolute value of Z + (x-bar).
Z-Low = absolute value of Z - (x-bar).
Will update with Z from mu and Z from avg (working on UX and visualization details).
Z-Score The z-score is a way of counting the number of standard deviations between a given data value and the mean of the data set.
Z-score = (x̄ - μ) / (σ / √ n)
x̄ = sample mean (using the array.avg function = array(a,close ), where i = 1 to 21)
μ = population mean ( = avg(close, n))
σ = standard deviation of the population ( = stdev(close,n))
n = number of 'close' or trading day closes
n = input
... Note: The previous indicator is part of a larger series of indicators

Portfolio: alpha, beta, stdev, variance, mean, max drawdown...Portfolio Metrics **New**
'returns'
'log returns'
'geometric returns'
portfolio alpha
portfolio beta
portfolio,market correlation
portfolio standard deviation
portfolio variance
mean portfolio returns
maximum drawdown
maximum gain

Mean recursion envelopeFree for public consumption
There is very little original here, the idea is discussed in the underground traders alliance, (google em), and was apparently the basis of what was at one time myfxbooks most profitable strategy.
I can't find the original video that was floating around on youtube, but if i find it again, i'll link it here.
This is bascially just the TV default envelope code copied and modified.
The idea is to have an envelope based on a low length, exponential basis. Then to manually "tune" the percent input so that the envelopes engulf most bars. Whenever price goes outside the envelopes (especially at key levels), look for a change to enter a reversion back to the ema.
This manual tuning when switching between time-frames and symbols of the percentage input, becomes arduous.
Instead this script uses the TV envelope code, but gets a setting based on the average of true range and "autotunes" with this.
Anything that protrudes beyond that level, especially at key levels, is likely to revert back to the ema. Bear in mind, a run away trend will also push past the envelopes and continue running for several (3-5) bars so, use it mindfully and thoughtfully with all the usual cautions about risk management.

Spread by//Every spread & central tendency measure in 1 script with comfortable visualization, including scrips's status line.
Spread measures:
- Standard deviation (for most cases);
- Average deviation (if there are extreme values);
- GstDev - Geometric Standard Deviation (exclusively for Geometric Mean);
- HstDev - Harmonic Deviation (exclusively for Harmonic Mean).
These modified functions will calculate everything right, they will take source, length, AND basis of your choice, unlike the ones from TW.
Central tendency measures:
- Mean (if everything's cool & equal);
- Median (values clustering towards low/high part of the rolling window);
- Trimean (3/more distinguishable clusters of data);
- Midhinhe (2 distinguishable clusters of data);
- Geometric Mean ( |low.. ... ... .. .... ... . . . . . . . . . . . .high| this kinda data); <- Exp law
- Harmonic Mean { |low. . . . . . . . . . . . . . .. . . .high| kinda data). <- Reciprocal law
Listen:
1) Don't hesitate using Standard Deviation with non-mean, like "Midhinge Standard Devition", despite what ol' stats gurus gonna say, it works when it's appropriate;
2) Don't check log space while using Geometric Mean & Geometric Standard Deviation, these 2 implement log stuff by design, I mean unless u wanna make it double xd
3) You can use this script, modify it how you want, ask me questions whatever, just make money using it;
4) Use Midrange & Midpoints in tandem when data follows ~addition law (like this . . . . . . . . . . . . . . . . . . . . .). <- just addition law
Look at the data, choose spread measure first, then choose central tendency measure, not vice versa.
!!!
Ain't gonna place ® sign on standard deviations like one B guy did in 1980s lmao, but if your wanna use Harmonic Deviations in science/write about/cite it/whatever, pls give me a lil credit at least, I've never seen it anywhere and unfortunately had to develop it by myself. it's useful when your data develops by reciprocals law (opposite to exponential).
Peace TW

Harmonic MADsNo, it's not a new saturation plugin for your fruity loops.
...
These are Mean Average Deviations calculated from Harmonic Mean.
...
In my previous research I tried to develop "Harmonic Average Deviations", since applying stdevs on Harmonic Mean calculated from reciprocals ain't make sense. Din't work out, prolly cuz by definition stdevs doesn't like negatives. So in the end I ended up using Mean Average Deviations, and turned out it works great. Generally market data doesn't distribute normally, so t's a great tool, now weird kurtosis won't be a problem.

[R&D] Harmonic deviationsI'm publishing it for research purposes & welcome any ideas and/or explanations whether it's actually possible or nah to do what I'm doing right now.
...
Idea is simple - if we can do Harmonic Mean, can we do Harmonic Standard Deviations? It should be the same logic, the only difference is instead of actual datapoints we gotta use reciprocals.
In reality I've found smth really curios, it's possible to get these Harmonic Standard Deviations, however, somewhy, depends on your timeframe, u gotta do final sqrt different amount of times. And looks like... the market reacts to these levels.
That's why in the script settings there is a menu where you can choose how many times to perform sqrt operation.
Pls check it out, play with it, see maybe you'll see smth interesting.

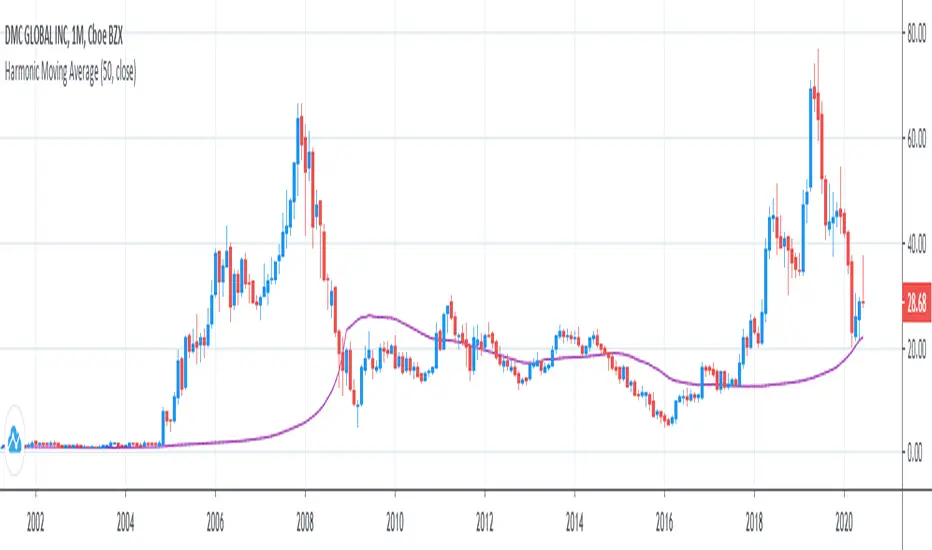
Harmonic Moving AverageI was legitimately surprised no1 has already coded it out on TradingView, but you guys can copypaste & include it in Pine 5 if your see this xd
Here is it.
I've checked and double checked everything, the calculations are right, it can be proved by plotting mean, geometric mean & harmonic mean together and noticing that geometric mean will be always between Harmonic mean, which is always below, and Mean, which is always above.
...
Other central tendency measures are also here as well for usability.
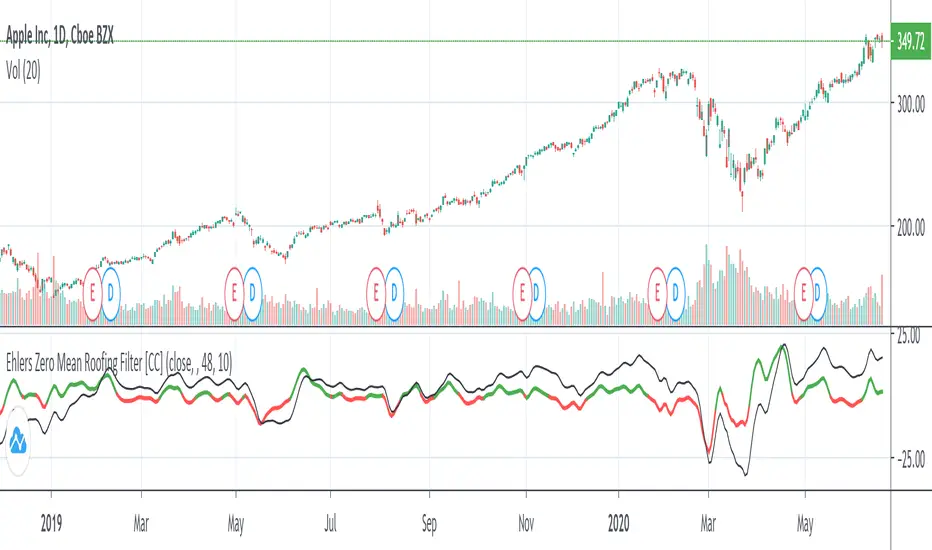
Ehlers Zero Mean Roofing Filter [CC]The Zero Mean Roofing Filter was created by John Ehlers (Cycle Analytics For Traders pg 80) and this is a much more reactive roofing filter compared to Ehler's Roofing Filter which I also added for reference. Buy when the indicator rises over 0 and sell when the indicator falls below 0.
This was a special request so let me know if there are other indicators you would like to see me publish or if you want something custom done!
Time Range StatisticsA good amount of users requested a text box showing various price statistics, the following script returns various of these stats in a user-selected range, and include classical ones such as a central tendency measurement (mean), dispersion (normalized range) and percent change, but also include less common statistics such as average traded volume and number of gaps. The script also calculates the correlation between the closing price and another user-selected instrument.
The script is currently the longest one I ever made and took some efforts, as I wasn't satisfied with the statistics to be originally included. Big thx to Gael for the enormous feedback and the idea of the normalized range, to user @Cookiecrush for the feedback ( without ya I would have posted something bad you know umu ? ), and Lulidolce for the support, friendship is magic!
Selected Range
The setting Start determine the bar at which the range starts, while End determine at which bar the range end. To help you select these values, the current bar number (bar index) is displayed at the right of the indicator title in blue.
The setting evaluate to last bar will use a range starting at Start and ending at the last bar, as such you can use a full range by using Start = 0 and select evaluate to last bar
The range is highlighted by an area on the chart. By default Start = 9000 and End = 10000, you might not have this amount of data in your chart, as such use the displayed bar index to select Start and End, then set the settings as default.
Displayed Statistics
The statistics panel is displayed on the right side of the last bar, the panel has 3 sections, a title section who shows the symbol ticker, timeframe, and overall trends represented by a chart emoji, the overall trends are determined by comparing the number of higher highs with the number of lower low.
Below are displayed the date ranges with time format: year/month/day/hour:minute.
The second section shows the general statistics. The first one is the mean, also represented by the orange line in the chart, the blue line displayed represent the highest price value in the range, while the red one represents the lowest price value.
The second stat is the normalized range, and determine how spread is the price in the user-selected range, why not the standard deviation? Because the standard deviation might return results varying widely depending on the scale of the closing price, you could get measures such as 0.0156 or 16 or even 56 depending on the instrument, as such using a normalized range can be more appropriate as it lays in a range of (0,1). Lower values indicate a low degree of price variation. Note that I still want to find another measure in the future.
The percentage change (or relative change) indicates at which percentage the price has increased or decreased, and is calculated by subtracting the closing at bar Start with the price at bar End , divided by the price at bar End , the result is then multiplied by 100.
The average traded volume calculate the mean of the volume in the selected range, I used the same format used by the original volume indicator for clarity.
Finally, the last stats of the section is the number of gaps, this stat is by default hidden. An up gap is detected when the open price is superior to the previous high, while a down gap is detected when the open price is inferior to the previous low, this allow to only retain significant gaps.
The last section of the indicator panel shows the correlation between the closing price and another instrument, by default GOOG, this correlation is also calculated within the user-selected range. Positive values indicate a positive relationship, that is the two instruments tend to move in the same direction. Negative values indicate a negative relationship, both instruments tend to move in a direction opposite to each other. Values closer to 1 or -1 indicate a stronger relationship, while values closer to 0 indicate no relationship.
In Summary
The script shows various stats, each calculated within a user-selected range, in general one would be more interested in how these stats might evolve with time, but checking them in a custom range can be quite interesting.
Thx for reading. umu
