Median

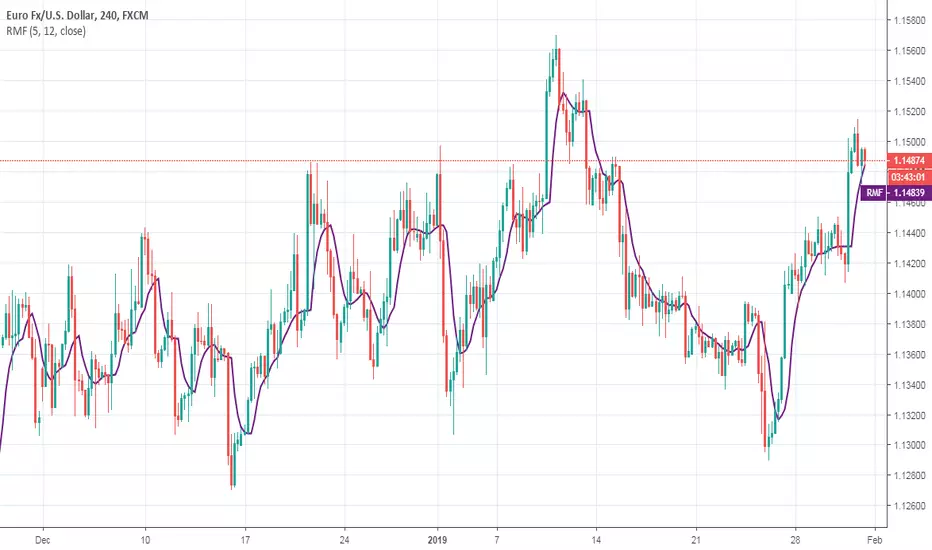
Recursive Median Oscillator & Fisher Transforms RibbonThis is a composite indicator made up of:
- modifided (rescaled) version of evergets version of recursive median oscillator.
- 1996anoojpatels Futur modification of Ehlers Fisher Transform Ribbons Indicator
I think Ehlers attempts to minimise latency in indicators are extremely valuable and some of my most use trading tools. Thanks to all the authors whose iterations keep moving these indicators toward perfection. Here is my contribution.

MCI and VCI - Modified CCI FormulasFor private peeps only
- Takes a modified version of the CCI formula into 2 parts
VCI - Volume Channel Index (Yellow Histogram)
- Measures accurate accumulation and distribution levels and times
MCI - Modified Channel Index
- Measures (when compared to VCI) levels where clearly buys are interested vs not interested.
Example:
If VCI > MCI
- Shows buyer's are more than interested in buying, you've either hit a bottom or heavy resistance
if MCI > VCI
- Show's buyer's aren't interested and will most likely result in a dump/lower price
Great for monitoring accumulation and distribution, these auto buy and sells look for the transition points over 0, works on EVERY commodity/stock/FOREX/Crypto
Results are from trading 1 BTC x25 leveraging. Not all trades will get in if put in at limit, but it does survive with profits after the massive 0.075 fee (results shown are after fees)

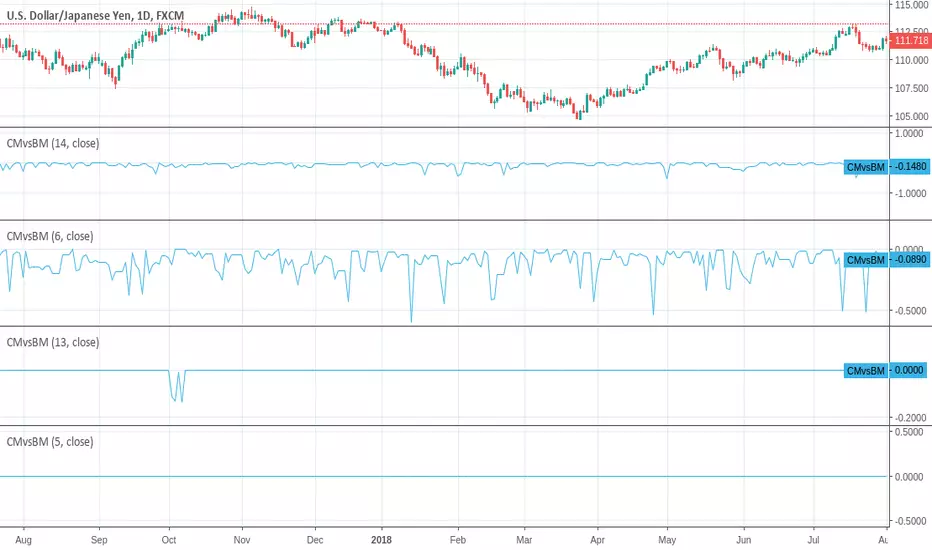
[RESEARCH] Custom Median vs Built-in MedianI compared custom median (using the sorting solution by @apozdnyakov) with built-in median (using percentile_nearest_rank function)
If you see the zero line this means the solutions give the same results.
The best results was achieved on the odd lengths.
Conclusions:
1) Do not try to reinvent the wheel.
2) Always check the Pine Script docs to find already implemented solutions.
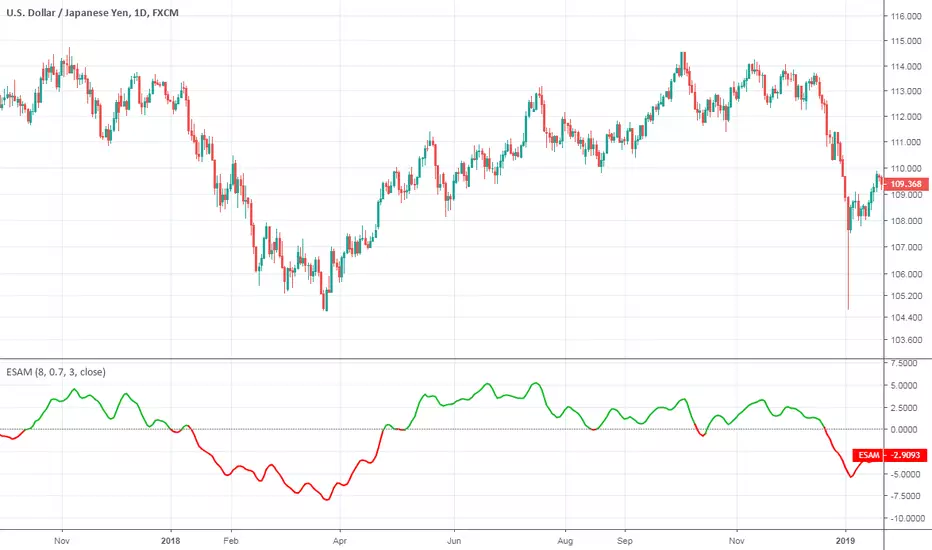
Ehlers Smoothed Adaptive MomentumEhlers Smoothed Adaptive Momentum script.
This indicator was developed and described by John F. Ehlers in his book "Cybernetic Analysis for Stocks and Futures" (2004, Chapter 12: Adapting to the Trend).
Hampel FilterHampel Filter script.
This indicator was originally developed by Frank Rudolf Hampel (Journal of the American Statistical Association, 69, 382–393, 1974: The influence curve and its role in robust estimation).
The Hampel filter is a simple but effective filter to find outliers and to remove them from data. It performs better than a median filter.

Interquartile Range BandsInterquartile Range Bands script.
This indicator was originally developed by Alex Orekhov at his home.
The idea based on the interquartile range en.wikipedia.org
If price breaks out from the bands then it is `outlier` price.
After breakouts price always returns to its median.
Watch squeeze/expansion periods.
Anyway use it as a supplement to the other indicators.
I will glad to get your feedback.

Recursive Median FilterRecursive Median Filter indicator script.
This indicator was originally developed by John F. Ehlers (Stocks & Commodities V. 36:03 (8–11): Recursive Median Filters).
Recursive Median OscillatorRecursive Median Oscillator indicator script.
This indicator was originally developed by John F. Ehlers (Stocks & Commodities V. 36:03 (8–11): Recursive Median Filters).


MPT - MEDIAN PRICE TRADING - custom forex indicator
MPT is a unique custom indicator i created to enter a trade with the right timing
This indicator catches the momentum of a Forex pair and tells you when to enter
It's based on the idea that when the median price in the current timeframe is crossing the median price of the higher timeframe, the momentum is changing and that is an opportunity to trade
red line is median line of current timeframe (default is 1D)
aqua line is projection of past median line on higher timeframe (default is 1W)
white crosses can be used as a trail stop values to follow a trend
when red cross aqua up the background is green and so momentum of the pair is up
when red cross aqua down no background color and momentum down
You can try this indicator for a limited period, just ask for access in comments
If you want unlimited access you can PM me
Trading is a risky business, use it at your own risk. I'm not responsible for any profit or loss

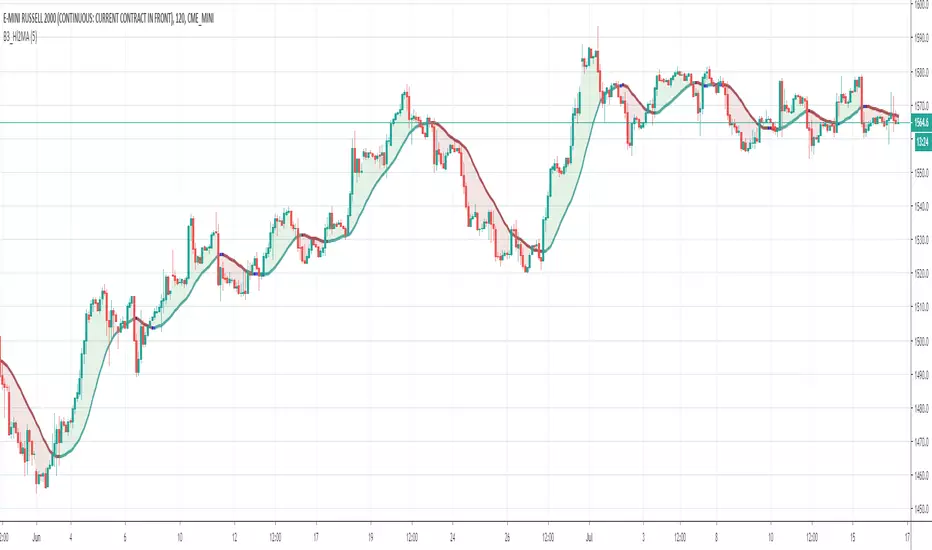
B3_HL2MAB3_HL2MA is a super smoothed mean of medians. This moving average is a great trend switch mechanism with a bit of a knack for showing mean deviation and reversion. If your clouds get to be large, you are probably ripe for taking the profits. Often the MA comes to meet price, so the reversion trade isn't what this indicator is all about. Enter on the cross or turn of the line, and exit on major deviations from the line if you can time them. This makes for a decent way to help stay in the trend. The line turns dark blue as in the case that a trend is compromised by price action, otherwise stay in the direction of teal = long and maroon = short.
The length on this is very sensitive, and a smaller number is the best; the four to six range is usually the best for that input. I made the math for this indicator myself from a simple idea to use the median price of the bar, and then average that out, and afterwards smoothed per my style. It has become one of only a couple MA based indicators I will use. Enjoy! :) ~B3
d^.^b
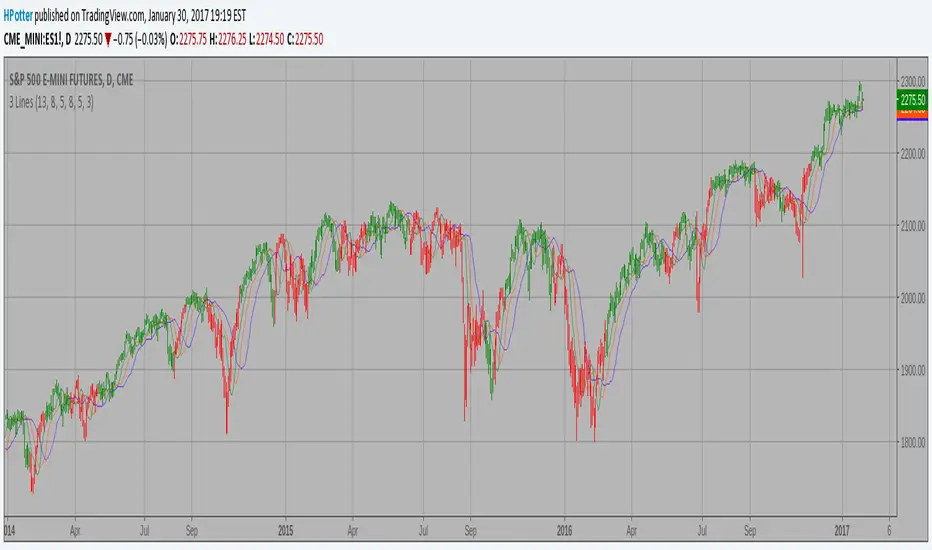
Bill Williams Averages. 3Lines Strategy This indicator calculates 3 Moving Averages for default values of
13, 8 and 5 days, with displacement 8, 5 and 3 days: Median Price (High+Low/2).
The most popular method of interpreting a moving average is to compare
the relationship between a moving average of the security's price with
the security's price itself (or between several moving averages).
Function Mean Median Mode V0EXPERIMENTAL:
Request for GLAZ
Functions to handle Mean, Median, Mode Calculation.

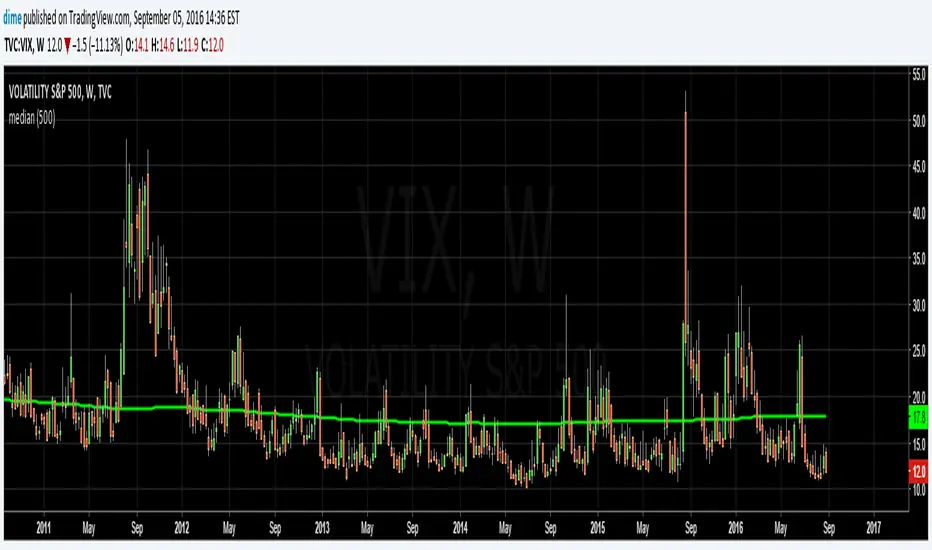
% Median v1 This indicator shows the percentage amount the price is above or below the moving median value of the period.
This indicator is best used along with the moving median (set to the same period).
Based on the moving median developed with 4x4good

Moving MedianThis simple script was a collaborative effort with 4X4good.
It plots a moving median for the period using the 50th percentile value.
We wanted to know the median value of VIX but surprisingly, a median indicator wasn't yet available in the indicators library.
So we did a little research & put this together.
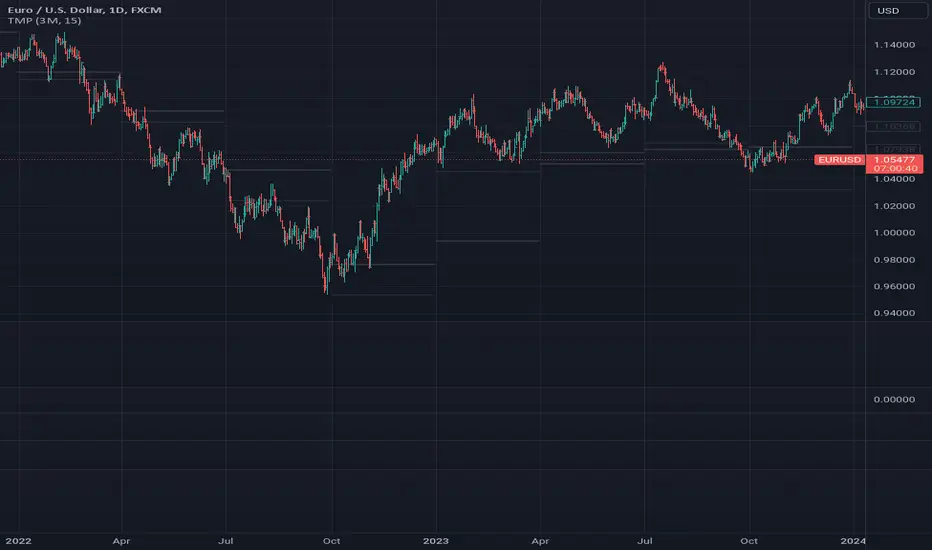
Simple Horizontal Value and Offsets [Auto Shift]Original (Simple Horizontal Value and Offsets/SHV) Requested by @TAFA94
Description:
Simple adjustable incremented horizontal offset lines extending up and down from a Median point.
Set full value for manual Median point control, or set an incremental rounding value for auto Median adjustment.
Source and look-back period inputs for fine tuning auto adjust.
Auto adjust on by default - can be toggled off for straight manual control.
**NOTE**
All values will likely need to be changed immediately on applying this script, in order to properly fit your charts specific price/value range and/or time resolution.
Cheers!

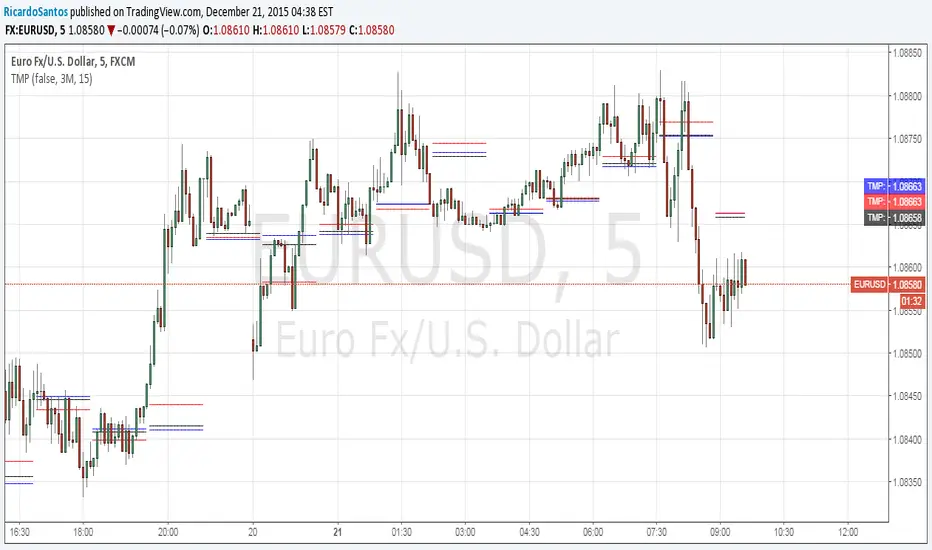
[RS]Temporal Median Price V1EXPERIMENTAL: previous custom time window median price and current time window open price in a neat package :p
(JeanLouisHardy) added option for bar count system, also added a donchian average.
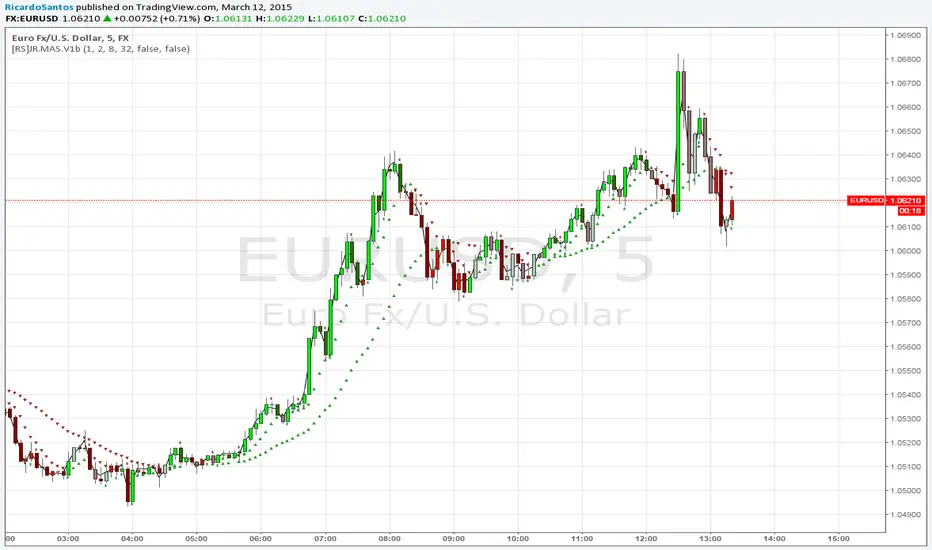
[RS]JR Moving Average System V1.bupdate: changes to code, ma's now split over 3 sets fast, medium and slow, removed cloud and sl_lines(no use?), ma's visually display as shapes :p added option to toggle the ma's on/off.
[RS]Temporal Median Price V0EXPERIMENTAL: previous custom time window median price and current time window open price in a neat package :p