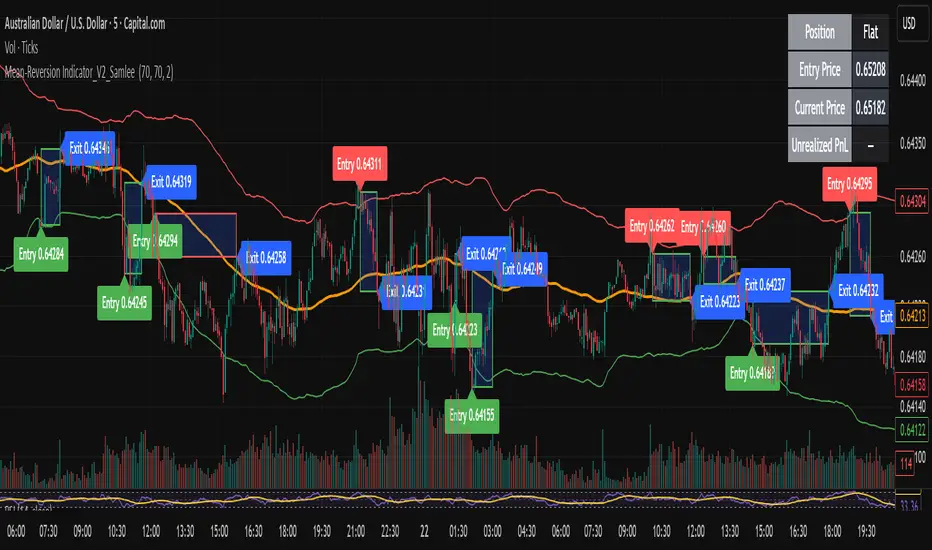
Mean-Reversion Indicator_V2_SamleeOverview
This is the second version of my mean reversion indicator. It combines a moving average with adaptive standard deviation bands to detect when the price deviates significantly from its mean. The script provides automatic entry/exit signals, real-time PnL tracking, and shaded trade zones to make mean reversion trading more intuitive.
Core Logic
Mean benchmark: Simple Moving Average (MA).
Volatility bands: Standard deviation of the spread (close − MA) defines upper and lower bands.
Trading rules:
Price breaks below the lower band → Enter Long
Price breaks above the upper band → Enter Short
Price reverts to MA → Exit position
What’s different vs. classic Bollinger/Keltner
Bandwidth is based on the standard deviation of the price–MA spread, not raw closing prices.
Entry signals use previous-bar confirmation to reduce intrabar noise.
Exit rule is a mean-touch condition, rather than fixed profit/loss targets.
Enhanced visualization:
A shaded box dynamically shows the distance between entry and current/exit price, making it easy to see profit/loss zones over the holding period.
Instant PnL labels display current position side (Long/Short/Flat) and live profit/loss in both pips and %.
Entry and exit points are clearly marked on the chart with labels and exact prices.
These visualization tools go beyond what most indicators provide, giving traders a clearer, more practical view of trade evolution.
Key Features
Automatic detection of position status (Long / Short / Flat).
Chart labels for entries (“Entry”) and exits (“Exit”).
Real-time floating PnL calculation in both pips and %.
Info panel (top-right) showing entry price, current price, position side, and PnL.
Dynamic shading between entry and current/exit price to visualize profit/loss zones.
Usage Notes & Risk
Mean reversion may underperform in strong trending markets; parameters (len_ma, len_std, mult) should be validated per instrument and timeframe.
Works best on relatively stable, mean-reverting pairs (e.g., AUDNZD).
Risk management is essential: use independent stop-loss rules (e.g., limit risk to 1–2% of equity per trade).
This script is provided for educational purposes only and is not financial advice.
Moving Averages
Ultra Degen Indicator🚨 Ultra Degen Indicator 🚨
Ready to YOLO your way to the moon or get rekt trying?
The Ultra Degen Indicator is your ultimate co-pilot for navigating the wild world of crypto. This isn't your grandpa's boring, slow-moving indicator. This is pure, unadulterated degen energy, designed to help you catch pumps and dump your bags before it's too late.
We've turbocharged the classic Supertrend by adding a high-octane RSI filter. This means no more waiting for slow signals. We're getting in early and getting out fast.
What's under the hood?
Supercharged Supertrend: A lean, mean, trend-following machine that cuts through the noise to tell you whether to long or short.
RSI Momentum Filter: The secret sauce! We use RSI to confirm that the momentum is in your favor. No more buying on weak bounces or selling into strong pumps. If the Supertrend flashes a buy signal, the RSI checks for bullish momentum. If the RSI isn't feeling it, we sit on our hands and wait for a better entry.
Multi-Timeframe (MTF) Support: Want to catch a quick scalp but trade with the big boys' trend? No problem. The Ultra Degen Indicator lets you set a higher timeframe to filter your trades, so you can snipe entries on the 5-minute chart while staying aligned with the daily trend. This is how you avoid getting rekt by a whale.
This indicator is for the true degen who understands that sometimes, you just gotta ape in. Use it wisely, have fun, and may your portfolio never see a red candle again.
DYOR. NFA. LFG. 🚀

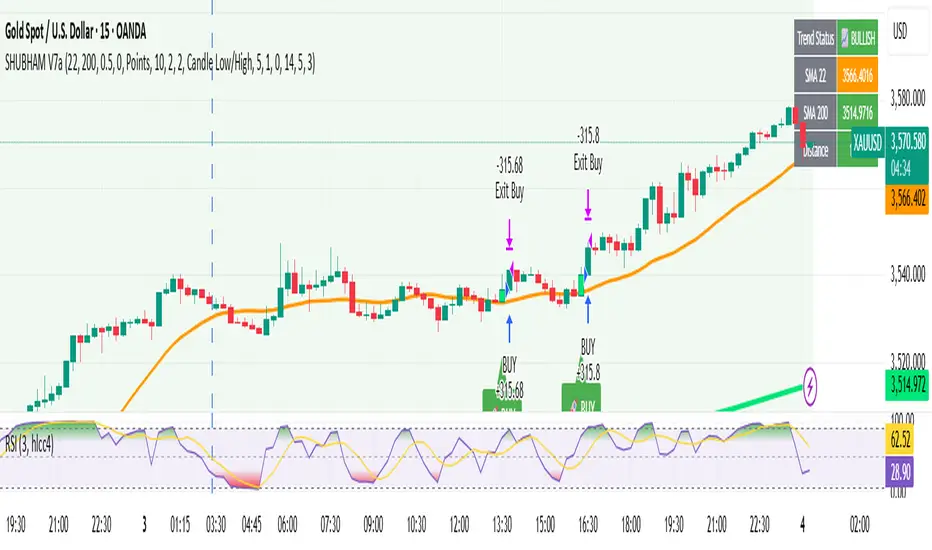
SHUBHAM V7aits a combination of 22 and 200 simple moving average for better accuracy and trend identification for beginners which minimise your losses with showing right trend and also calculate the ATR value for buy/sell signals by SHUBHAM VAIRAGEE
VWMA CandlesVWMA Candles – Smarter Candle Coloring with Volume Awareness
This indicator enhances your chart candles by showing their relationship to the Volume-Weighted Moving Average (VWMA). It visually integrates the VWMA and price action, making it easier to spot momentum shifts, value zones, and price interaction with volume-weighted levels. I saw this indicator idea from TrendSpider on threads and decided to try and make my own. This is my first publicly shared script so go easy on me!
IN ORDER FOR THE COLOR CODING TO WORK PROPERLY, YOU MUST:
GO TO -> CHART SETTINGS -> SYMBOLS AND DISABLE BODIES, BORDERS, AND WICKS.
How it works:
The VWMA is plotted on your chart with a customizable band around it.
Candles change color depending on their position relative to the VWMA and its band:
Green → Price is above the VWMA (bullish bias).
Orange → Price is near or touching the VWMA/band (potential reaction zone).
Red → Price is below the VWMA (bearish bias).
You can choose between custom candles (full plotcandle styling) or simply recolor your existing chart candles with barcolor.
Customization options:
Select how the band is calculated: by % of VWMA, ATR multiple, or Ticks/Points.
Adjust colors separately for candle body, wick, and border.
Choose to show/hide the VWMA line and the band fill.
Fine-tune transparency for a clean look on any chart background.
Why traders use it:
Quickly spot when price is stretched away from the VWMA (overextended conditions).
Identify when candles are interacting with the VWMA (potential support/resistance).
Add volume-sensitivity to your trend analysis compared to standard moving averages.
Authors Note: The default settings work well with stocks on the weekly timeframe, although this can be used on any timeframe. The settings are highly adjustable for you to tune it to your liking.
BUY & SELL Probability (M5..D1) - MTFMTF Probability Indicator (M5 to D1) - Dual Color Histogram with Smoothing and Buy/Sell LabelsOverviewThis indicator calculates a probabilistic bias for buy or sell opportunities across multiple timeframes (from 5-minute to Daily), combining trend analysis from EMA (200-period), momentum from MACD, and strength from ADX. It incorporates higher timeframe weighting, momentum emphasis, and Smart Money Concept (SMC) influences via ADX scoring. Additionally, it adjusts for proximity to recent support/resistance levels to refine the probability.The output is visualized as:A dual-color histogram in a sub-panel (green for bullish bias ≥50%, red for bearish <50%), smoothed for reduced noise.
Buy/Sell percentage labels on the main chart, displayed above (Buy) and below (Sell) the last candle for quick reference.
Probabilities are clamped between 0% and a user-defined max (default 100%), ensuring realistic outputs. This tool is designed for traders seeking multi-timeframe confluence, helping identify potential entry points in trending or ranging markets.Key FeaturesMulti-Timeframe Analysis: Aggregates data from M5, M15, H1, H4, and D1, starting from the current chart's timeframe upward. Weights can be customized for each TF to emphasize lower or higher frames.
Component Weights: Balances trend (EMA-based), momentum (MACD), and SMC/strength (ADX) with adjustable ratios.
Smoothing: Applies a simple moving average (SMA) to the buy probability for smoother readings.
Support/Resistance Adjustment: Influences the score based on proximity to recent highs/lows within a lookback period, adding a price action layer.
Boost for Current TF: Optionally amplifies the weight of the starting timeframe for more responsive signals on lower charts.
Visuals: Histogram for trend bias visualization; labels for precise % readouts on the last bar.
How It WorksTrend Score: Derived from price position relative to EMA(200) on each TF (+100% if above, -100% if below).
Momentum Score: Based on MACD line vs. signal (+100% if bullish cross, -100% if bearish).
ADX Score: Measures trend strength (scaled to 0-100%, where higher ADX boosts the directional bias).
Aggregation: Scores are weighted by TF percentages and component weights (Trend, Momentum, SMC), then combined.
S/R Adjustment: Adds/subtracts influence based on closeness to recent highs (resistance) or lows (support).
Probability Calculation: Final buy % = 50% + (total score / 2), clamped; sell % = 100% - buy %.
Smoothing & Display: Buy % is smoothed via SMA; histogram shows deviation from 50%; labels update on the last bar.
InterpretationBuy Bias (Green Histogram >0): Suggests bullish probability >50%. Higher bars indicate stronger confluence.
**Sell Bias (Red Histogram <0)**: Suggests bearish probability >50%. Lower bars indicate stronger downside bias.
Labels: "BUY: XX%" above the candle (lime background) and "SELL: YY%" below (red background). Use these for quick probability checks—e.g., BUY 70% implies a 70/30 bullish edge.
Neutral Zone: Around 50% indicates low confluence; avoid trading or wait for confirmation.
Best Use: Combine with price action, volume, or other indicators. Ideal for swing trading on H1+ charts or scalping on M5/M15 with higher TF weights.
Input ParametersEMA 200 Period: Length for the trend EMA (default: 200).
MACD Settings: Fast (12), Slow (26), Signal (9).
ADX Period: For trend strength (14).
Weights:Higher Time Frame (Trend): 0.4
Momentum: 0.4
SMC (ADX): 0.3
TF Weights (%): M5 (40), M15 (0), H1 (30), H4 (30), D1 (0). Total should sum to 100% for normalization.
Used Timeframe Boost: Multiplier for the starting TF (1.0 = no boost).
Probability Clamp: Max buy % (100.0).
Smoothing Period: SMA length for buy prob (3).
S/R Lookback: Bars for high/low detection (50).
S/R Proximity Influence: Strength of adjustment (10.0).
Colors: Buy (lime), Sell (red).
Notes & LimitationsThis is not financial advice—use for educational/informational purposes only. Backtest thoroughly.
Performance may vary by asset; optimize weights for stocks, forex, or crypto.
On very low timeframes (

Gold Scalping Trend Strategy [Optimized] joey🟡 Gold Scalping Trend Strategy – Explained
This is a short-term scalping strategy designed for XAU/USD (gold), but it can also be applied to other volatile instruments.
It combines trend detection (moving averages + ATR filter) with scalping take-profit levels and a safety stop-loss.
The goal is to ride small but high-probability moves in the direction of the intraday trend while protecting capital.

Triple Tap Sniper Triple Tap Sniper v3 – EMA Retest Precision System
Triple Tap Sniper is a precision trading tool built around the 21, 34, and 55 EMAs, designed to capture high-probability retests after EMA crosses. Instead of chasing the first breakout candle, the system waits for the first pullback into the EMA21 after a trend-confirming cross — the spot where professional traders often enter.
🔑 Core Logic
EMA Alignment → Trend defined by EMA21 > EMA34 > EMA55 (bullish) or EMA21 < EMA34 < EMA55 (bearish).
Cross Detection → Signals are only armed after a fresh EMA cross.
Retest Entry → Buy/Sell signals fire only on the first retest of EMA21, with trend still intact.
Pro Filters →
📊 Higher Timeframe Confirmation: Aligns signals with larger trend.
📈 ATR Volatility Filter: Blocks weak signals in low-vol chop.
📏 EMA Spread Filter: Ignores tiny “fake crosses.”
🕯️ Price Action Filter: Requires a proper wick rejection for valid entries.
🚀 Why Use Triple Tap Sniper?
✅ Filters out most false signals from sideways markets.
✅ Focuses only on clean trend continuations after pullbacks.
✅ Beginner-friendly visuals (Buy/Sell labels) + alert-ready for automation.
✅ Flexible: works across multiple timeframes & asset classes (stocks, crypto, forex).
⚠️ Notes
This is a signal indicator, not a full strategy. For backtesting and optimization, convert to a strategy and adjust filters per market/timeframe.
No indicator guarantees profits — use with sound risk management.

Adaptive Confluence StrategyAdaptive Confluence Strategy brings institutional discipline to retail charts — blending adaptive EMA crossovers, RSI, VWAP, and higher-timeframe filters with ATR-driven risk management and smart position sizing to help traders capture trends with confidence.
Adaptive EMA Crossovers – auto-adjusted for intraday, daily, or weekly charts.
Multi-Factor Confluence – optional RSI filter, VWAP alignment (intraday), and higher timeframe EMA trend confirmation.
ATR-Based Risk Management – stop loss, take profit, and optional Chandelier trailing stop.
Position Sizing Guidance – suggested trade size and risk/reward metrics displayed on chart.
Flexible Use – suitable for both short-term day trading and longer-term swing setups.
Back test & Refine – built-in strategy logic for historical testing and optimization.
Overview:
A multi-factor trend-following strategy designed for both intraday
and swing trading. The system combines EMA crossovers with optional
RSI filters, VWAP confluence (intraday), and higher timeframe trend
confirmation. Risk management is enforced through ATR-based stop
loss / take profit and an optional ATR Chandelier trailing stop.
Position sizing guidance is included to assist with consistent
risk-per-trade allocation.
// Disclaimer:
// This script is for educational and research purposes only.
// Past performance in backtests does not guarantee future results.
// Use at your own risk.

Edric TrendThis is a very simple way for Trend by using Ema.
Created by Edric Le Hoang Dung (lehodu) from Vietnam

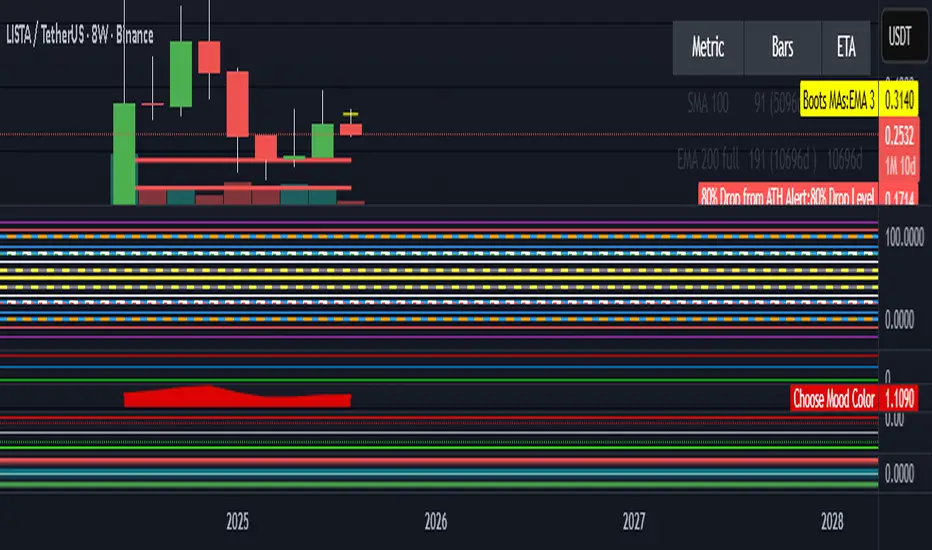
MA Availability ETA (SMA100/EMA200)This tool helps traders understand when long-term moving averages become available on any chosen timeframe.
Many new symbols, pairs, or timeframes don’t have enough price history to immediately plot long moving averages like SMA(100) and EMA(200). This script calculates and displays:
✅ Bars Remaining – how many bars are still needed before each moving average can be plotted reliably.
✅ ETA Duration – an estimate of how long (in chart time units) it will take until each MA is available.
✅ Status Table & Label – compact visual summary on the chart and in a table at the top-right corner.
✅ Vertical Marker – a dotted line showing exactly where both SMA(100) & EMA(200) first appear together.
✅ Alerts – optional alerts notify you the moment SMA(100) or EMA(200) become available.
🔑 Features
Works on any timeframe and instrument.
Highlights SMA(100) and EMA(200) on the chart for reference.
Lets you choose whether EMA(200) should be considered ready immediately, or only after a full 200-bar history.
Useful for traders who rely on long-term MA signals (golden cross, dynamic support/resistance, trend confirmation) and want to know when these tools will be ready on fresh charts.
🎯 Use Cases
New listings / low-history assets → See when SMA100 & EMA200 become usable.
Backtesting or forward-testing → Anticipate when long-term signals will first appear.
Trend-following strategies → Prepare in advance for crossovers or key support/resistance confluence zones.
⚠️ Note: ETAs are based on chart resolution and assume continuous data; real-world session gaps, weekends, or illiquid trading can make availability slightly later.
👉 Add this to your chart and you’ll always know when the big moving averages arrive — a critical moment for many upside moves and long-term strategies.
MA Median Crossover | MisinkoMasterThe MA Median Crossover is a new trend analysis tool designed to help traders catch trends with less noisy, more accuracy and speed.
While simple, this effective indicator can improve your strategy more than you might think.
How does it work?
1. Get user defined input
=> set up your indicator to your likings, and make it capture what you want it to
2. Calculate the Moving Average and Median Base
=> this is the foundation of the indicator
3. Smooth the median
=> less noise, more accuracy, just like that!
4. Compare the MA to the smoothed Median
=> If the MA > smoothed Median, it signals an uptrend, if the MA < smoothed Median,
it signals a downtrend.
Yep, that is how simple it is.
Final note:
Changing the MA type is very influencial, so watch out when changing them.
Enjoy G´s!

Özel 4'lü Sinyal Cryto Tide HuntersDesigned for a 3-minute chart. Entry should be made with the first green signal or the first red signal. Hold until the reverse signal arrives.

MAC-Z VWAP Indicator + L/S ThresholdOriginal Script by Lazybear.
Added long/short threshold on the MAC-Z source.
Added BG coloring for visually backtesting.
Script to version 5.

Intraday EMA Support/Resistance with Volume Filter by Shashwat Intraday EMA Support/Resistance with Volume Filter

SK's Intraday EMA Support/Resistance with Volume FilterThis indicator plots EMA-based intraday support & resistance with volume filters to highlight low-volume crossovers.


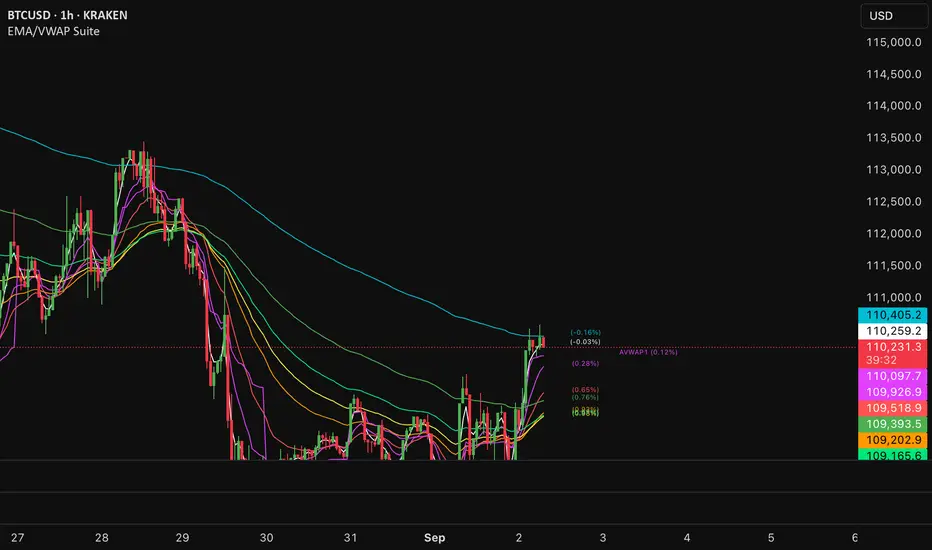
EMA/VWAP SuiteEMA/VWAP Suite
Overview
The EMA/VWAP Suite is a versatile and customizable Pine Script indicator designed for traders who want to combine Exponential Moving Averages (EMAs) and Volume Weighted Average Prices (VWAPs) in a single, powerful tool. It overlays up to eight EMAs and six VWAPs (three anchored, three rolling) on the chart, each with percentage difference labels to show how far the current price is from these key levels. This indicator is perfect for technical analysis, supporting strategies like trend following, mean reversion, and VWAP-based trading.
By default, the indicator displays eight EMAs and a session-anchored VWAP (AVWAP 1, in fuchsia) with their respective percentage difference labels, keeping the chart clean yet informative. Other VWAPs and their bands are disabled by default but can be enabled and customized as needed. The suite is designed to minimize clutter while providing maximum flexibility for traders.
Features
- Eight Customizable EMAs: Plot up to eight EMAs with user-defined lengths (default: 3, 9, 19, 38, 50, 65, 100, 200), each with a unique color for easy identification.
- EMA Percentage Difference Labels: Show the percentage difference between the current price and each EMA, displayed only for visible EMAs when enabled.
- Three Anchored VWAPs: Plot VWAPs anchored to the start of a session, week, or month, with customizable source, offset, and band multipliers. AVWAP 1 (session-anchored, fuchsia) is enabled by default.
- Three Rolling VWAPs: Plot VWAPs calculated over fixed periods (default: 20, 50, 100), with customizable source, offset, and band multipliers.
- VWAP Bands: Optional upper and lower bands for each VWAP, based on standard deviation with user-defined multipliers.
- VWAP Percentage Difference Labels: Display the percentage difference between the current price and each VWAP, shown only for visible VWAPs. Enabled by default to show the AVWAP 1 label.
- Customizable Colors: Each VWAP has a user-defined color via input settings, with labels matching the VWAP line colors (e.g., AVWAP 1 defaults to fuchsia).
Flexible Display Options: Toggle individual EMAs, VWAPs, bands, and labels on or off to reduce chart clutter.
Settings
The indicator is organized into intuitive setting groups:
EMA Settings
Show EMA 1–8 : Toggle each EMA on or off (default: all enabled).
EMA 1–8 Length : Set the period for each EMA (default: 3, 9, 19, 38, 50, 65, 100, 200).
Show EMA % Difference Labels : Enable/disable percentage difference labels for all EMAs (default: enabled).
EMA Label Font Size (8–20) : Adjust the font size for EMA labels (default: 10, mapped to “tiny”).
Anchored VWAP 1–3 Settings
Show AVWAP 1–3 : Toggle each anchored VWAP on or off (default: AVWAP 1 enabled, others disabled).
AVWAP 1–3 Color : Set the color for each VWAP line and its label (default: fuchsia for AVWAP 1, purple for AVWAP 2, teal for AVWAP 3).
AVWAP 1–3 Anchor : Choose the anchor period (“Session,” “Week,” “Month”; default: Session for AVWAP 1, Week for AVWAP 2, Month for AVWAP 3).
AVWAP 1–3 Source : Select the price source (default: hlc3).
AVWAP 1–3 Offset : Set the horizontal offset for the VWAP line (default: 0).
Show AVWAP 1–3 Bands : Toggle upper/lower bands (default: disabled).
AVWAP 1–3 Band Multiplier : Adjust the standard deviation multiplier for bands (default: 1.0).
Rolling VWAP 1–3 Settings
Show RVWAP 1–3 : Toggle each rolling VWAP on or off (default: disabled).
RVWAP 1–3 Color : Set the color for each VWAP line and its label (default: navy for RVWAP 1, maroon for RVWAP 2, fuchsia for RVWAP 3).
RVWAP 1–3 Period Length : Set the period for the rolling VWAP (default: 20, 50, 100).
RVWAP 1–3 Source : Select the price source (default: hlc3).
RVWAP 1–3 Offset : Set the horizontal offset (default: 0).
Show RVWAP 1–3 Bands : Toggle upper/lower bands (default: disabled).
RVWAP 1–3 Band Multiplier : Adjust the standard deviation multiplier for bands (default: 1.0).
VWAP Label Settings
Show VWAP % Difference Labels : Enable/disable percentage difference labels for all VWAPs (default: enabled, showing AVWAP 1 label).
VWAP Label Font Size (8–20) : Adjust the font size for VWAP labels (default: 10, mapped to “tiny”).
How It Works
EMAs : Calculated using ta.ema(close, length) for each user-defined period. Percentage differences are computed as ((close - ema) / close) * 100 and displayed as labels for visible EMAs when show_ema_labels is enabled.
Anchored VWAPs : Calculated using ta.vwap(source, anchor, 1), where the anchor is determined by the selected timeframe (Session, Week, or Month). Bands are computed using the standard deviation from ta.vwap.
Rolling VWAPs : Calculated using ta.vwap(source, length), with bands based on ta.stdev(source, length).
Labels : Updated on each new bar (ta.barssince(ta.change(time) != 0) == 0) to show percentage differences. Labels are only displayed for visible EMAs/VWAPs to avoid clutter.
Color Matching: VWAP labels use the same color as their corresponding VWAP lines, set via input settings (e.g., avwap1_color for AVWAP 1).
Example Use Cases
- Trend Following: Use longer EMAs (e.g., 100, 200) to identify trends and shorter EMAs (e.g., 3, 9) for entry/exit signals.
- Mean Reversion: Monitor percentage difference labels to spot overbought/oversold conditions relative to EMAs or VWAPs.
- VWAP Trading: Use the default session-anchored AVWAP 1 for intraday trading, adding weekly/monthly VWAPs or rolling VWAPs for broader context.
- Intraday Analysis: Leverage the session-anchored AVWAP 1 (enabled by default) for day trading, with bands as support/resistance zones.
Moving Averages 450, 125 & 65Plots three SMA lines (450, 125, 65 periods) on price chart. Designed to identify long-term trends and potential support/resistance levels. The longest MA (450) shows primary trend direction, while shorter MAs (125, 65) help capture intermediate-term momentum shifts. Ideal for multi-timeframe trend analysis and crossover strategies.
Features:
SMA 450 (Blue) - Long-term trend
SMA 125 (Orange) - Medium-term momentum
SMA 65 (Cyan) - Short-term signals
Customizable lengths and colors
Clean visual overlay on price chart

RCI2MAsignWhen the slopes of any two RCI lines are upward and above any MA, a buy signal is generated. Conversely, a sell signal is generated. Signals are represented by background color.

Morning Gap Reversal ScannerMorning indicator for morning fluctuation. Seeing what starts low and moves up in first 30 minutes

Signal Generator: EMA XC with MTF CheckUltimate Signal Generator MTF
Overview
The Ultimate Signal Generator MTF is a multi-timeframe tool that combines higher timeframe (HTF) momentum with lower timeframe (LTF) confirmations to generate reliable Buy and Sell signals. It is designed for traders who want to follow higher-timeframe trends while timing entries on a lower timeframe.
Features
📊 HTF Momentum Histogram – plots the difference between short and long EMAs of a higher timeframe, anchored at the bottom of the main chart. Green bars indicate bullish momentum, red bars indicate bearish momentum.
📈 Multi-Timeframe Confirmation – ensures that signals align with the higher-timeframe momentum before triggering.
🟢🔴 Buy & Sell Arrows – displayed directly on the price chart whenever both HTF trend and LTF cross conditions agree.
⏰ Alerts – fully integrated alerts for Buy/Sell signals so you never miss a setup.
⚡ Lightweight & Clean – EMAs are calculated internally but not plotted, keeping your chart uncluttered.
How It Works
The indicator calculates short and long EMAs on a higher timeframe.
It measures the momentum difference (short EMA minus long EMA).
When HTF momentum is bullish/bearish, it checks for confirmation from the LTF EMA cross.
If both align, a Buy or Sell arrow is plotted on the chart.
Best Use Cases
Swing trading with HTF = 1h, LTF = 15m
Intraday trading with HTF = 15m, LTF = 5m
Works on all assets (stocks, crypto, forex, indices).
⚠️ Disclaimer
This tool is meant for educational purposes only. It is not financial advice. Always combine signals with your own analysis and proper risk management.

Rayner Teo's EMA SettingCollection of Indicators for Rayner Teo's Strategy
- Displays the 20, 50, and 200 EMA s.
- Highlights the bar when the price enters the area between the 20 EMA and the 50 EMA .
- A green signal appears when the 20, 50, and 200 EMAs are aligned .
- A red signal appears when the price crosses down the 20 EMA during a bullish trend.
- The dim steplines below and above price bar show the 1.5 x ATR(20) used for stop loss .

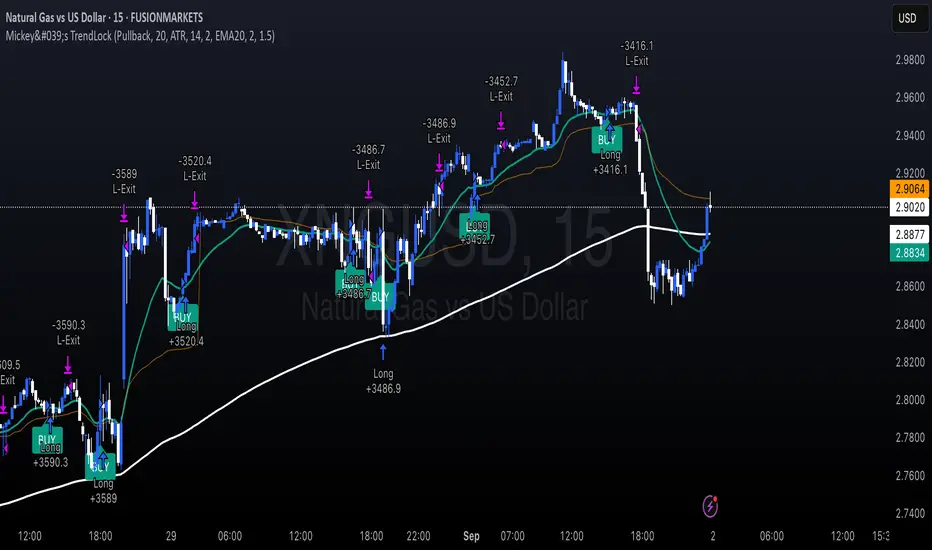
Mickey's TrendLock📌 Strategy Overview
The Mickey's Trendlock is a professional intraday trading system that combines long-term and short-term exponential moving averages (EMA200 & EMA20) with multiple confirmation filters to generate high-probability trade setups. It is designed for both trend-following crossovers and pullback entries, giving traders flexibility in approach.
⚙️ Core Logic
Entry Modes:
Cross Mode → Signals when EMA20 crosses above/below EMA200.
Pullback Mode → Signals when price pulls back to EMA20 within the larger EMA200 trend bias.
Confirmations (toggle on/off):
RSI(14) → Long only if RSI ≥ 50, Short only if RSI ≤ 50.
VWAP Bias → Longs above VWAP, Shorts below VWAP.
Volume Confirmation → Optional filter requiring Volume > SMA(20).
🛡️ Risk Management
Stop Loss Options:
ATR-based Stop with adjustable multiplier.
EMA-anchored Stop (EMA20 or EMA200).
Take Profit: Configurable Risk/Reward (R:R) ratio.
Trailing Stop: Optional ATR-based trailing stop for dynamic protection.
📊 Features
Customizable Risk Controls – ATR/EMA stop-loss, risk–reward targets, trailing stops.
Clean Visuals – EMA200, EMA20, and VWAP plotted for clarity.
Alerts – JSON-format alerts for automated broker integration.
Entry Labels – BUY/SELL markers on chart for visual tracking.
✅ Best Suited For
Intraday traders who prefer trend-based setups with confirmation filters.
Traders looking for rule-based entries & exits with strict risk management.
Users who want alert-ready signals for automated execution.
⚠️ Disclaimer
This script is for educational purposes only. It does not constitute financial advice. Trading involves risk; always test thoroughly before using live capital.