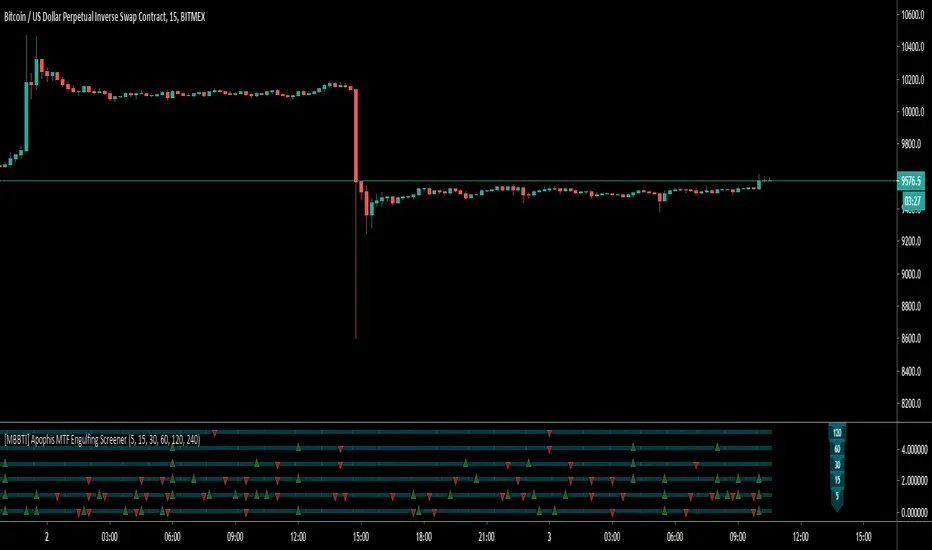
[MBBTI] Apophis MTF Engulfing ScreenerHello Traders,
Apophis MTF Engulfing Screener is based on Daveatt's Engulfing Screener and will screen for engulfing candles on multible time frames. It can help detecting not obvious engulfing candles.
How it works?
- choose your preferable time frames
- green triangle up -> bullish engulfing on this time frame
- red triangle down -> bearish engulfing on this time frame
Contact me if you have any questions or change requests
Wuuzzaa
Mtf
security free MTF example - JDThis script is not intended for trading purposes but gives some examples how you can get values
from previous candles in other timeframes, without using security calls.
NOTE: the "open", "high" and "low" values are calculated "on the fly", as the bar progresses,
the "close" is determined at the end of the timeframe, so it's only know at the first bar of the next time period
JD.
#NotTradingAdvice #DYOR
Disclaimer.
I AM NOT A FINANCIAL ADVISOR.
THESE IDEAS ARE NOT ADVICE AND ARE FOR EDUCATION PURPOSES ONLY.
ALWAYS DO YOUR OWN RESEARCH!

DiNapoli MACD MTFSimple oscillator, based on formula from Joe Dinapoli for MACD oscillator. Simply it's analysing current timeframe (bottom row) and 2 higher timeframes.

(NKC) MTF Squeeze Pro MultiTimeframe Squeeze Momentum Pro
Dots indicate squeeze
Fills indicate momentum

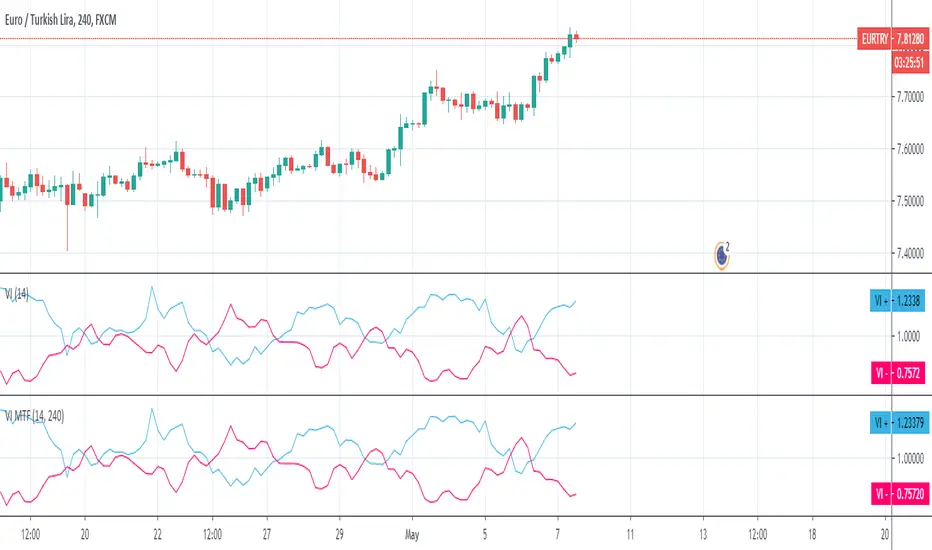
Vortex MTFUnderstanding Vortex Indicator (VI)
The vortex indicator was first developed by Etienne Botes and Douglas Siepman who introduced the concept in the January 2010 edition of “Technical Analysis of Stocks & Commodities.” The vortex indicator is based on two trendlines: VI+ and VI-.
What is the Vortex Indicator (VI)?
A vortex indicator (VI) is an indicator composed of two lines - an uptrend line (VI+) and a downtrend line (VI-). These lines are typically colored green and red respectively. A vortex indicator is used to spot trend reversals and confirm current trends.
Vortex Indicator Calculations
The calculation for the indicator is divided into four parts.
1. True range (TR) is the greatest of:
Current high minus current low
Current high minus previous close
Current low minus previous close
2. Uptrend and downtrend movement:
VM+ = Absolute value of current high minus prior low
VM- = Absolute value of current low minus prior high
3. Parameter length (n)
Decide on a parameter length (between 14 and 30 days is common)
Sum the last n period’s true range, VM+ and VM-:
Sum of the last n periods’ true range = SUM TRn
Sum of the last n periods’ VM+ = SUM VMn+
Sum of the last n periods’ VM- = SUM VMn−
4. Create the trendlines VI+ and VI-
SUM VMn+/SUM TRn = VIn+
SUM VMn-/SUM TRn = VIn−
Repeating this process daily forms the VI+ and VI- trendlines.
The traditional application of using VI- and VI+ crossovers can result in a number of false trade signals when price action is choppy. Increase the number of periods used in the indicator to reduce this, for example, using 25 periods instead of 14.
What is MTF?
Multiple Time Frame Analysis is the technique of analyzing several time frames of the same asset before entering a trade. This type of analysis is best done using a top-down approach, i.e. starting at a higher time frame and working your way down, via several lower time frames, until the execution time frame is reached where a trade could be entered. Traders who use this technique usually look at 3 or 4 different time frames to identify the general trend and find the best entries. They minimize their risk and improve the odds of success simply by taking the bigger picture into account. It can easily be combined with any trading strategy.
Time frames are usually several times apart. For example a day trader who trades hourly charts, could analyse the weekly (high time frame), the daily (7 times smaller), the 4 hour (6 times smaller) and finally the hourly time frame (execution time frame, 4 times smaller). TradingView has a chart layout feature with multiple charts per layout, so you can analyse an asset on multiple time frames under one tab in your browser.
Summary
With MTF, you can see the Vortex indicator values for a specific time period without changing the graph time period.
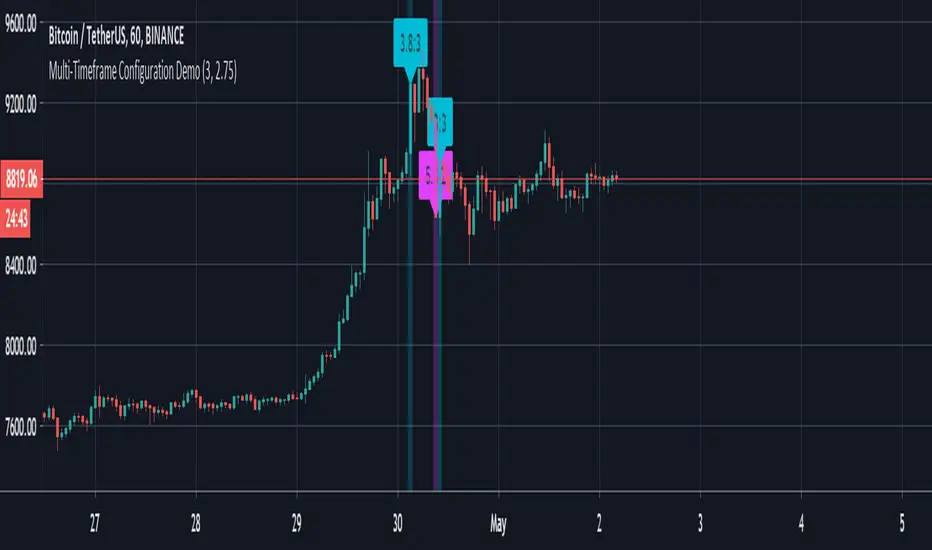
Multi-Timeframe Configuration DemoThis is a developer friendly solution to the current PineScript limitation of not being able to easily configure presets for multiple timeframes.
If you're developing multi-timeframe strategies then you've no doubt done battle with built-in `input` function which only allows for a single default value. You've probably come up with all kinds of fancy workarounds, including messy hardcoding, and even gritting your teeth and patiently reentering all the necessary values each time you refresh the chart or change the timeframe. The last one is my personal favourite.
As you can see in the code below we have defined a `usePresets` condition which tells the script to use our preset configuration, otherwise the default `input` values will be used. If `usePresets` is false then we use our presets which are defined in a (fairly) easy to read condition chain with the help of some basic timeframe utility functions.
Obviously this is nothing groundbreaking, but its helped me clean up my scripts a bit, so hopefully it will help you too.

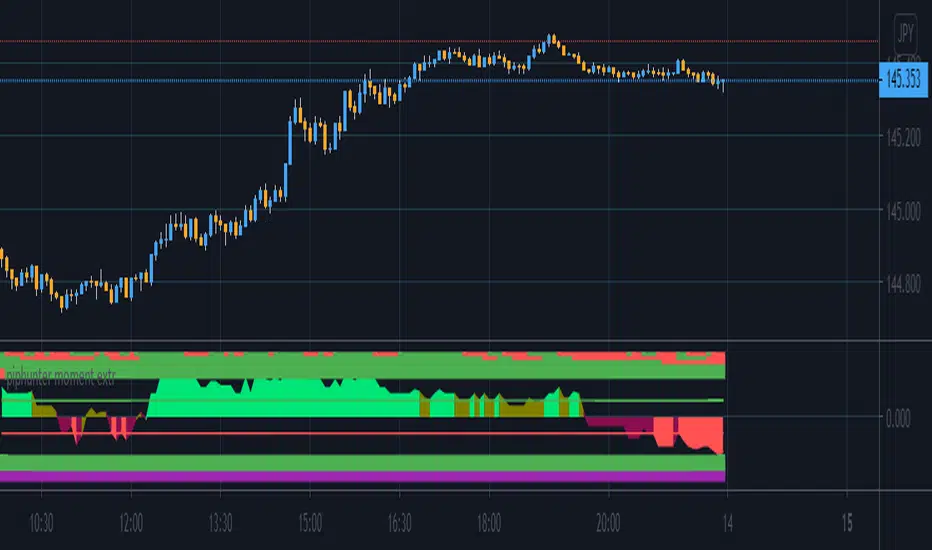
pip hunter momentum extremeThis indicator gives a score to the momentum of a market in a percentage term based on a combination of measurements, this can be used on any time frame, on any instrument to identify if the current trend has enough momentum to see it carry on further this will help eliminate fomo and also help you to identify reversals in the chart at the right time so you can eliminate exposure to a market about to reverse, there is 4 levels to this indicator you have a strong bullish trend denote by green bars the weaker bullish trend denoted by the olive coloured bars, a weak bearish trend which is given in maroon bars and a strong bearish trend which gives red bars you will also note the 2 horizontal boundary lines these are not overbought and oversold bounds like in most indicators but actually indicate whether there is sufficient momentum in the market as the idea is that in strong momentum you want it to be above or below this line to give you confidence there is momentum available to ride.
There are also 7 coloured bars 3 top and 4 on the bottom the 6 green and red ones denote the direction of a heiken ashi candle its attached to reading from top to bottom defaults are 1hr 2hr 4hr 8hr 12hr daily if they are green then the candle is bullish if red the candle is bearish .
The bottom bar is a final momentum confluence when it is white we have a bearish bias and when it is purple we have a bullish bias
if you would like access to this script then please pm me
Strategy Follow Line MTF Any MM AverageThe objective is only to evaluate different configurations of the indicator "Follow Line MTF Any MM Average".
The strategy does not have position management, it's very basic, this indicator should be used to see trend, range zones, evaluate the best areas to enter the market, use higher time frames to confirm a direction can be useful.
I do not recommend using only this indicator to trade, because you can lose all your money if you do not know what you are doing.
I hope you find it useful.
Successes
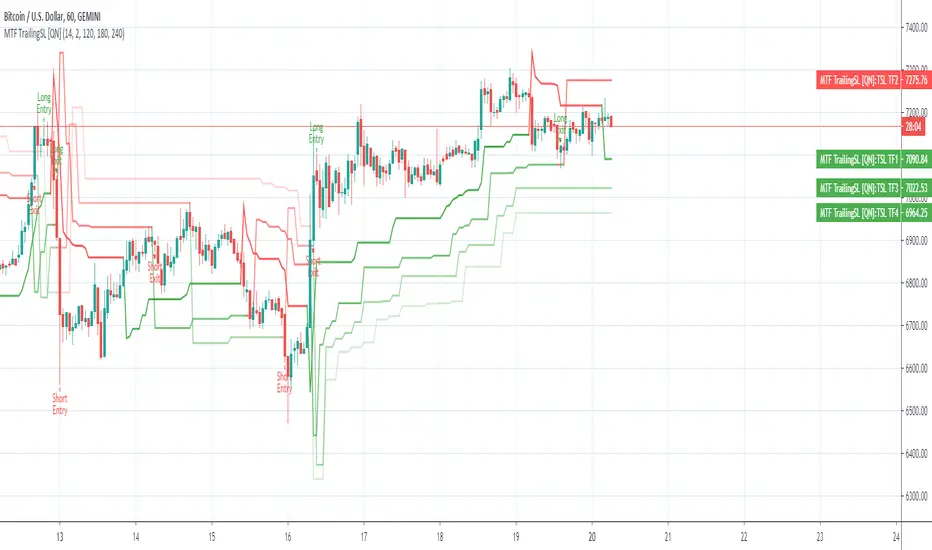
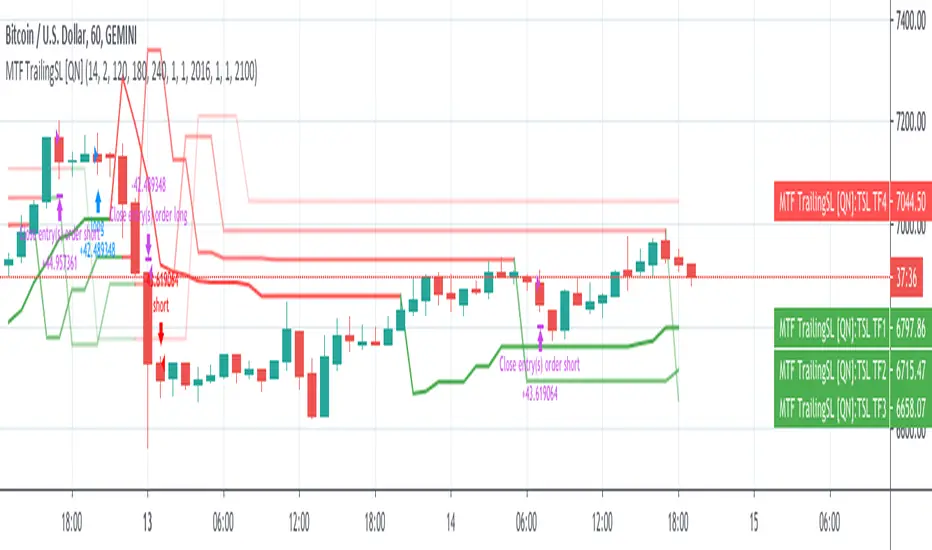
MTF Trailing SL Alerts [QuantNomad]These are alerts for my MTF Trailing SL Strategy.
Entry Long position if all 4 time-frames agree on the long signal.
Exit Long positions when at least 2 time-frames disagree on the long signals.
Entry to Short position if all 4 time-frames agree on Short signal.
Exit from Short positions when at least 2 time-frames disagree on Short signal.
Use "Once Per Bar Close" when creating alerts.
Link to the strategy:
Multi Time Frame StochasticThis Indicator draws 6 Stochastic Plots with different Time Frames showing only K Value.
Available Time Frames: 3m, 5m, 15m, 30m, 60m, 240m
MTF Ichimoku CloudIchimoku Cloud , Multiple Time Frames, based on the script : MTF Selection Framework functions (PineCoders)
Possible display:
- four differents Ichimoku
- Tenkan, Kijun, Chikou and Kumo (monochrome or not)
- labels : offset from line, color if you change style and with/without abbreviation
Time Frames :
- 1m
- 3m
- 5m
- 15m
- 30m
- 45m
- 1h
- 2h
- 3h
- 4h
- Daily
- Weekly
- Monthly

Multi-TimeFrame Bollinger BandsScript which plot multi-timeframe bollinger bands, up to 3 different timeframes. It is intended to show higher timeframe bands on a smaller timeframe. Default options are 1m, 5m and 15m and used on a 1m chart for crypto-currencies.
It can be used to get a better overview of the current trend.
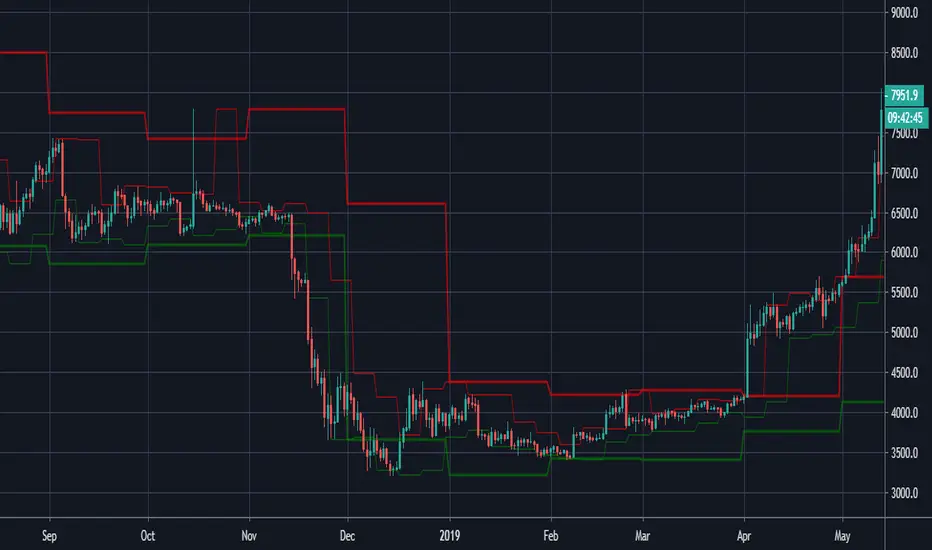
Highs & Lows of Last [x] Bars===========
Highs & Lows of Last Bars
===========
We have found this indicator invaluable over the past few years - whether you prefer to trade Crypto, Forex, Commodities or something else this indicator could prove really useful. It's always nice to know the highs and lows of the last Week or Month, the problem being the information is only really relevant at the start or end of that chosen time period; throughout the mid-section of that time period the chart will either be displaying irrelevant information or info that has been/is being re-painted. Not good!
Our Highs & Lows of Last Bars Indicator will remove this re-painting problem and display up-to-date information from higher time frames without compromising the integrity of your current chart period.
-----------
Most high & low finder indicators will use, (for example), a 'W' or 'M' as their higher TF to get HTF results - we do things just a little bit differently, it's like this:
Most other High/Low Indicators:
~ MON 1st (get high/low value from 'W' TF) ~
~ MON 8th (get new data and plot from 'W' TF)
etc. - This leads to gaps in the data, re-painting and missing lots of potential mid-week trades.
Our High & Low of Last Bars:
~ MON 1st (get high/low value from LAST 7 DAYS) ~
~ TUE 2nd (get high/low value from LAST 7 DAYS) ~
etc.
This provides a much smoother High/Low plot with more relevant information. You can clearly see areas of support and resistance, updated on the LTF chart using data from a HTF.
Because we've included 2 TF's you can use simultaneously you can see when the lower TF touches the Higher TF this (generally, but not always!) means there's a breakout coming!
Hope this is useful to you guys!
Good Luck and Happy Trading!

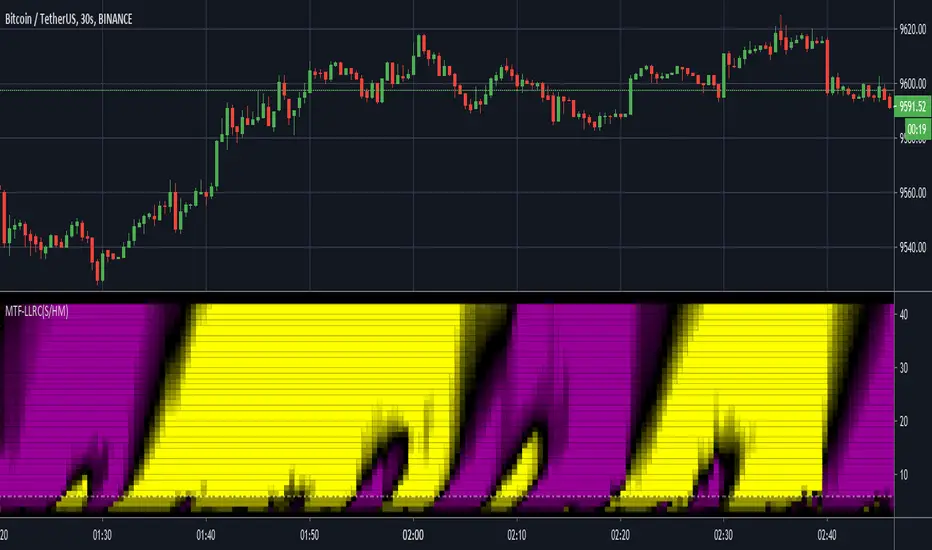
MTF Lag-Less RasterChart (Spectrogram/HeatMap)I present yet another state-of-the-art "MTF Lag-Less RasterChart" employing PSv4.0. Simply describing how this indicator works, the bottom of the indicator pane is most reactive and is highly effective at identifying reversal points quickly once they occur, while the upper portion of the indicator commonly shows enduring trends. This may be my finest multi-timeframe heatmap indicator that I have created so far, complete with multiple stunning gradient color schemes. I'm unsure if I will be able to pack any more tech into these RasterCharts. This may exclude additional algorithms or polychromatics I may discover later on that are worthy of other RasterChart releases. One last thing, this is a companion indicator to my "Lag-Less Rainbow Ribbon" indicator, because the heavily modified base algorithms are nearly identical.
I once again would like to personally thank Dr . John Ehlers for inspiring me to ponder into the realm of heatmap technology and all it has to offer. Your mathemagical splendor is most appreciated! You're a divine inspiration to the algorithmic trading community and forever shall be.
The MTF capabilities include seconds, minutes, and days. If the time frame settings are shorter in time than the current sampling interval, a warning notification will be appropriately displayed. I included a horizontal rule to approximately gauge at what level you may wish to have before entering/exiting a trade upon identifying a trend change. This gizmo functions on all assets on time frames ranging from one second bars up to the "All" chart having monthly bars.
Lastly, I have included so many color scheming techniques that I couldn't demonstrate all of them above. This indicator has what I would term as enhanced "predator" vision. For those of you who have witnessed these movies, you may understand what I have built. This indicator additionally includes a color morphing control to perfectly adjust the gradients to your visual liking, on any time frame whether it be seconds or daily chart preferences. The use of this indicator is just like any of my other RasterCharts or heatmap indicators found on the internet, except it has the greatest versatility I have accomplished as of yet.
Features List Includes:
"Source" selection
MTF controls for seconds, minutes, and days
Adjustable horizontal rule to differentiate between more reactive aspects of turning point fluctuations in the lower portion of the chart (visible above)
Window aperture control
Adjustable heatmap brightness control
Visual color scheme techniques (a few of many are displayed above)
Color gradient morphing
Color inversion control
This is not a freely available indicator, FYI. To witness my Pine poetry in action, properly negotiated requests for unlimited access, per indicator, may ONLY be obtained by direct contact with me using TV's "Private Chats" or by "Message" hidden in my member name above. The comments section below is solely just for commenting and other remarks, ideas, compliments, etc... regarding only this indicator, not others. When available time provides itself, I will consider your inquiries, thoughts, and concepts presented below in the comments section, should you have any questions or comments regarding this indicator. When my indicators achieve more prevalent use by TV members, I may implement more ideas when they present themselves as worthy additions. As always, "Like" it if you simply just like it with a proper thumbs up, and also return to my scripts list occasionally for additional postings. Have a profitable future everyone!
Smooth HA / Hull MA / MTF===========
Smooth HA / Hull MA / MTF
===========
A combination of a Smoothed Heikin Ashi Chart Line and a Hull MA Line, paints a "Long" or "Short" alert when the Hull MA changes color - editable settings for the smoothing of HA data and Hull MA Length; you can also change the time frame used (must be the same or longer as the chart).
-----------
This indicator does a real good job at finding highs and lows (otherwise known as entry and exit points!) picking up on just about every large, decent swing and making the most from those big moves! The disadvantage of all Smoothed HA strategies are when times are choppy or ranging - given the natural lag of the indicator you can be sure in choppy times you'd be buying at the top and selling at the bottom almost every time ~ No indicator is perfect!
This Smooth HA/Hull MA indicator also has a built in MTF function (Multi-Time-Frame). This means you can be using a 1hr chart and set the indicator to a 4hr chart - generally any movements on a greater time frame will overcome any movements of the smaller time frame, so this is where you should be gathering data about which direction the market is moving - as always, follow the trend.
Hope (like always) this is of at least some use to some people.
Good Luck and Happy Trading!

VWAP MTF TT by Chill00rThis is an "Volume-weighted Average Price" Indicator for Multi Timeframe.
VWAP color is trend-based
Different settings are available (some are off by default):
"Show Daily VWAP"
"Show Weekly VWAP"
"Show Monthly VWAP"
"Show Quarterly VWAP"
"Show Yearly VWAP"
"Show previous VWAP close"
Hit the Like Button
MTF Trailing SL Strategy [QuantNomad]This is a Multi-Timeframe version of my Trailing SL Strategy.
Few weeks ago I published Trailing SL Strategy. There I used only basic Trailing SL to enter positions.
It worked pretty well so I tried to work on it a bit. I thought what if you can use the same ATR TSL on different timeframes and combine them into one signal.
In this strategy you can use only ATR stops and choose 3 other higher timeframes in addition to your current timeframe.
You'll see Trailing SL plotted on the chart form all these timeframes.
Entry Long position if all 4 time-frames agree on long signal.
Exit Long positions when at least 2 time-frames disagree on long signal.
Entry to Short position if all 4 time-frames agree on Short signal.
Exit from Short positions when at least 2 time-frames disagree on Short signal.
Here is the link to my basic Trailing SL Strategy:
Moving High & Low (2 Time Frames)===========
Moving High & Low (2 Time Frames)
===========
A simple line set indicator displaying the highs and lows of the previous selected timeframe upon a lower timeframe chart (2 line sets available).
e.g. Displaying the Highs & Lows of the last week and/or month on the 1D chart
-----------
Useful for 2 very different approaches to trading markets -
Finding Breakout Points:
For example - When candlestick closes above or below highs from previous week/month it may be a good time to go long as if the trend continues it may well go on for a long time making lots of pips along the way!
Finding SAR points within a range:
For example - When price starts ranging within horizontal line sets that aren't moving either way too much it may be a good idea to place long/short orders at appropriate key levels dictated by these range extremities, anticipating the price to reach these levels and deflect (Stop & Reverse) back the other way.
Either way we would recommend you NOT use this indicator alone, this is very much a confirmation tool or as an aid to find key levels of support/resistance.
Good Luck and Happy Trading!
Percent Change MtFThis plots the selected resolution's percent change from open to close. Easy way to check the previous period's range with less noise. Note the latest period is calculating on a bar that hasn't closed so it won't update unless you refresh/change timeframes to prevent incorrect reporting.

[fikira] Volume + MTF MAVolume normally has 1 Moving Average (standard orange coloured)
This script gives 1 extra Moving Average (default blue coloured)
BOTH MA can be shown with Multi Time Frames,
based on the most excellent work of "PineCoders"
(MTF Selection Framework functions)!
This can provide more insights, also the crossovers can be interesting!
So, default there are 2 MA's of the present Time Frame + extra 2 TF's of these MA's
(default 2 and 4 times of the present TF)
All can be enabled/disabled,
Only 1 MA:
With labels and values:
Here 2 MA but + only 1 extra TF:

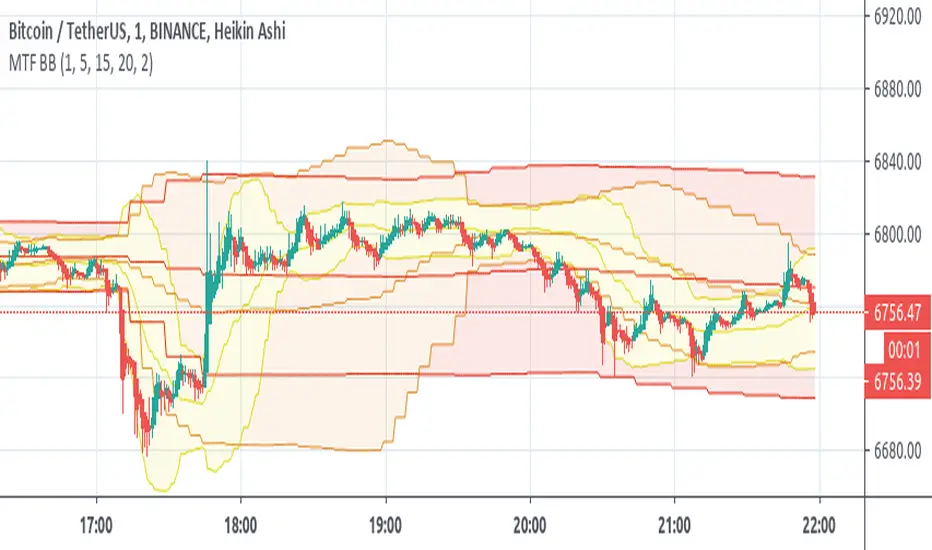
[fikira] Bollinger Bands + Higher Time FramesHere is my take on BB and MTF, based on the most excellent work of
"PineCoders" (MTF Selection Framework functions)!
The big advantage is that on 1 image you can easily see where
price is compared to 5 or less BB Bands (each of different Time Frames).
This gives a lot of Support and Resistance area's!
Includes:
- 1 Bollinger Bands (can be enabled/disabled - "Bollinger Bands"
- 4 Bollinger Bands (each can be enabled/disabled - "HTF Selection 1-4")
Each BB has its colour (can be changed)
- Labels (Timeframe and price) can be enabled/disabled
- Labels position and size can be changed
...
