Setup: Smooth Gaussian + Adaptive Supertrend (Manual Vol)Overview
This strategy combines two powerful trend-based tools originally developed by Algo Alpha: the Smooth Gaussian Trend (simulated) and the Adaptive Supertrend. The objective is to capture sustained bullish movements in periods of controlled volatility by filtering for high-probability entries.
Entry Logic
Long Entry Conditions:
The closing price is above the Smooth Gaussian Trend line (with length = 75), and
The volatility setting from the Adaptive Supertrend is manually defined as either 2 or 3
Exit Condition:
The closing price falls below the Smooth Gaussian Trend line
This script uses a simulated version of the Gaussian Trend line via double-smoothed SMA, as the original Algo Alpha indicator is protected and cannot be accessed directly in code.
Features
Plots entry and exit signals directly on the chart
Manual toggle to enable or disable the volatility filter
Lightweight design to allow flexible backtesting even without access to proprietary indicators
Important Note
This strategy does not connect to the actual Adaptive Supertrend from Algo Alpha. Users must manually input the volatility level based on what they observe on the chart when the original indicator is also applied. The Smooth Gaussian Trend is approximated and may differ slightly from the original.
Suggested Use
Recommended timeframes: 1H, 4H, or Daily
Best used alongside the original indicators displayed on the chart
Consider incorporating additional structure, momentum, or volume filters to enhance performance
If you have suggestions or would like to contribute improvements, feel free to reach out or fork the script.
Indicators and strategies

EMA Grid + Martingale Strategy (Long-Only) with CooldownTitle:
EMA Grid + Martingale Strategy (Long-Only) with Cooldown
Short Summary:
A long-only strategy combining EMA trend filters, grid-based entries, optional martingale sizing, and a cooldown feature to manage position timing and exits.
Full Description:
This strategy uses a 4-EMA trend confirmation system to detect bullish momentum, then deploys a grid-style entry method with optional martingale position sizing. It includes a cooldown mechanism to prevent reentry too soon after a completed trade cycle.
How It Works
1. Trend Confirmation: Two EMA groups (fast/slow) determine whether market conditions are bullish.
2. Initial Entry: A new position is entered when both EMA groups confirm an uptrend and no position is currently active.
3. Grid Entries: Additional long entries are placed when price drops by a defined pip distance from the last entry, respecting the maximum number of entries.
4. Martingale Sizing (Optional): Grid orders can increase in size with each level using a customizable multiplier.
5. Weighted-Average Exit: All positions close once price reaches or exceeds the average entry price plus a buffer.
6. Cooldown Timer: After closing a position set, the strategy waits a defined number of bars before opening a new grid.
Key Features
• 4 customizable EMAs for trend confirmation.
• Dynamic grid-style long entries based on pip intervals.
• Optional martingale-style position sizing.
• Weighted-average price exit logic with buffer control.
• Cooldown bar period to limit overtrading.
• Suitable for optimization and backtesting with full control over inputs.
Use Cases
• Designed for trending markets where pullbacks present entry opportunities.
• Helps manage staged entries while avoiding premature reentry.
• Ideal for testing martingale and grid-based strategies with exit precision.
Note: This strategy is for testing and educational purposes only. It does not guarantee profits and is not financial advice.

Supertrend Long-Only Strategy for QQQThis strategy is meant to use Micro Momentum to give good Buy and Sell signals in trending markets

Open Close Cross Strategy R5 Delay//@version=5
//
strategy(title='Open Close Cross Strategy R5.1 revised by JustUncleL', shorttitle='OCC Strategy R5.1', overlay=true, pyramiding=0, default_qty_type=strategy.percent_of_equity, default_qty_value=10, calc_on_every_tick=false)
//
// Revision: 5
// Original Author: @JayRogers
// Revision Author: JustUncleL revisions 3, 4, 5
//
// *** USE AT YOUR OWN RISK ***
// - There are drawing/painting issues in pinescript when working across resolutions/timeframes that I simply
// cannot fix here.. I will not be putting any further effort into developing this until such a time when
// workarounds become available.
// NOTE: Re-painting has been observed infrequently with default settings and seems OK up to Alternate
// multiplier of 5.
// Non-repainting mode is available by setting "Delay Open/Close MA" to 1 or more, but the reported
// performance will drop dramatically.
//
// R5.1 Changes by JustUncleL
// - Upgraded to Version 3 Pinescript.
// - Added option to select Trade type (Long, Short, Both or None)
// - Added bar colouring work around patch.
// - Small code changes to improve efficiency.
// - NOTE: To enable non-Repainting mode set "Delay Open/Close MA" to 1 or more.
// 9-Aug-2017
// - Correction on SuperSmooth MA calculation.
//
// R5 Changes by JustUncleL
// - Corrected cross over calculations, sometimes gave false signals.
// - Corrected Alternate Time calculation to allow for Daily,Weekly and Monthly charts.
// - Open Public release.
// R4 Changes By JustUncleL
// - Change the way the Alternate resolution in selected, use a Multiplier of the base Time Frame instead,
// this makes it easy to switch between base time frames.
// - Added TMA and SSMA moving average options. But DEMA is still giving the best results.
// - Using "calc_on_every_tick=false" ensures results between backtesting and real time are similar.
// - Added Option to Disable the coloring of the bars.
// - Updated default settings.
//
// R3 Changes by JustUncleL:
// - Returned a simplified version of the open/close channel, it shows strength of current trend.
// - Added Target Profit Option.
// - Added option to reduce the number of historical bars, overcomes the too many trades limit error.
// - Simplified the strategy code.
// - Removed Trailing Stop option, not required and in my opion does not work well in Trading View,
// it also gives false and unrealistic performance results in backtesting.
//
// R2 Changes:
// - Simplified and cleaned up plotting, now just shows a Moving Average derived from the average of open/close.
// - Tried very hard to alleviate painting issues caused by referencing alternate resolution..
//
// Description:
// - Strategy based around Open-Close Crossovers.
// Setup:
// - I have generally found that setting the strategy resolution to 3-4x that of the chart you are viewing
// tends to yield the best results, regardless of which MA option you may choose (if any) BUT can cause
// a lot of false positives - be aware of this
// - Don't aim for perfection. Just aim to get a reasonably snug fit with the O-C band, with good runs of
// green and red.
// - Option to either use basic open and close series data, or pick your poison with a wide array of MA types.
// - Optional trailing stop for damage mitigation if desired (can be toggled on/off)
// - Positions get taken automagically following a crossover - which is why it's better to set the resolution
// of the script greater than that of your chart, so that the trades get taken sooner rather than later.
// - If you make use of the stops, be sure to take your time tweaking the values. Cutting it too fine
// will cost you profits but keep you safer, while letting them loose could lead to more drawdown than you
// can handle.
// - To enable non-Repainting mode set "Delay Open/Close MA" to 1 or more.
//
// === INPUTS ===
useRes = input(defval=true, title='Use Alternate Resolution?')
intRes = input(defval=3, title='Multiplier for Alernate Resolution')
stratRes = timeframe.ismonthly ? str.tostring(timeframe.multiplier * intRes, '###M') : timeframe.isweekly ? str.tostring(timeframe.multiplier * intRes, '###W') : timeframe.isdaily ? str.tostring(timeframe.multiplier * intRes, '###D') : timeframe.isintraday ? str.tostring(timeframe.multiplier * intRes, '####') : '60'
basisType = input.string(defval='SMMA', title='MA Type: ', options= )
basisLen = input.int(defval=8, title='MA Period', minval=1)
offsetSigma = input.int(defval=6, title='Offset for LSMA / Sigma for ALMA', minval=0)
offsetALMA = input.float(defval=0.85, title='Offset for ALMA', minval=0, step=0.01)
scolor = input(false, title='Show coloured Bars to indicate Trend?')
delayOffset = input.int(defval=1, title='Delay Open/Close MA (Forces Non-Repainting)', minval=0, step=1)
tradeType = input.string('BOTH', title='What trades should be taken : ', options= )
// === /INPUTS ===
// Constants colours that include fully non-transparent option.
green100 = #008000FF
lime100 = #00FF00FF
red100 = #FF0000FF
blue100 = #0000FFFF
aqua100 = #00FFFFFF
darkred100 = #8B0000FF
gray100 = #808080FF
// === BASE FUNCTIONS ===
// Returns MA input selection variant, default to SMA if blank or typo.
variant(type, src, len, offSig, offALMA) =>
v1 = ta.sma(src, len) // Simple
v2 = ta.ema(src, len) // Exponential
v3 = 2 * v2 - ta.ema(v2, len) // Double Exponential
v4 = 3 * (v2 - ta.ema(v2, len)) + ta.ema(ta.ema(v2, len), len) // Triple Exponential
v5 = ta.wma(src, len) // Weighted
v6 = ta.vwma(src, len) // Volume Weighted
v7 = 0.0
sma_1 = ta.sma(src, len) // Smoothed
v7 := na(v7 ) ? sma_1 : (v7 * (len - 1) + src) / len
v8 = ta.wma(2 * ta.wma(src, len / 2) - ta.wma(src, len), math.round(math.sqrt(len))) // Hull
v9 = ta.linreg(src, len, offSig) // Least Squares
v10 = ta.alma(src, len, offALMA, offSig) // Arnaud Legoux
v11 = ta.sma(v1, len) // Triangular (extreme smooth)
// SuperSmoother filter
// © 2013 John F. Ehlers
a1 = math.exp(-1.414 * 3.14159 / len)
b1 = 2 * a1 * math.cos(1.414 * 3.14159 / len)
c2 = b1
c3 = -a1 * a1
c1 = 1 - c2 - c3
v12 = 0.0
v12 := c1 * (src + nz(src )) / 2 + c2 * nz(v12 ) + c3 * nz(v12 )
type == 'EMA' ? v2 : type == 'DEMA' ? v3 : type == 'TEMA' ? v4 : type == 'WMA' ? v5 : type == 'VWMA' ? v6 : type == 'SMMA' ? v7 : type == 'HullMA' ? v8 : type == 'LSMA' ? v9 : type == 'ALMA' ? v10 : type == 'TMA' ? v11 : type == 'SSMA' ? v12 : v1
// security wrapper for repeat calls
reso(exp, use, res) =>
security_1 = request.security(syminfo.tickerid, res, exp, gaps=barmerge.gaps_off, lookahead=barmerge.lookahead_on)
use ? security_1 : exp
// === /BASE FUNCTIONS ===
// === SERIES SETUP ===
closeSeries = variant(basisType, close , basisLen, offsetSigma, offsetALMA)
openSeries = variant(basisType, open , basisLen, offsetSigma, offsetALMA)
// === /SERIES ===
// === PLOTTING ===
// Get Alternate resolution Series if selected.
closeSeriesAlt = reso(closeSeries, useRes, stratRes)
openSeriesAlt = reso(openSeries, useRes, stratRes)
//
trendColour = closeSeriesAlt > openSeriesAlt ? color.green : color.red
bcolour = closeSeries > openSeriesAlt ? lime100 : red100
barcolor(scolor ? bcolour : na, title='Bar Colours')
closeP = plot(closeSeriesAlt, title='Close Series', color=trendColour, linewidth=2, style=plot.style_line, transp=20)
openP = plot(openSeriesAlt, title='Open Series', color=trendColour, linewidth=2, style=plot.style_line, transp=20)
fill(closeP, openP, color=trendColour, transp=80)
// === /PLOTTING ===
//
//
// === ALERT conditions
xlong = ta.crossover(closeSeriesAlt, openSeriesAlt)
xshort = ta.crossunder(closeSeriesAlt, openSeriesAlt)
longCond = xlong // alternative: longCond ? false : (xlong or xlong ) and close>closeSeriesAlt and close>=open
shortCond = xshort // alternative: shortCond ? false : (xshort or xshort ) and close 0 ? tpPoints : na
SL = slPoints > 0 ? slPoints : na
// Make sure we are within the bar range, Set up entries and exit conditions
if (ebar == 0 or tdays <= ebar) and tradeType != 'NONE'
strategy.entry('long', strategy.long, when=longCond == true and tradeType != 'SHORT')
strategy.entry('short', strategy.short, when=shortCond == true and tradeType != 'LONG')
strategy.close('long', when=shortCond == true and tradeType == 'LONG')
strategy.close('short', when=longCond == true and tradeType == 'SHORT')
strategy.exit('XL', from_entry='long', profit=TP, loss=SL)
strategy.exit('XS', from_entry='short', profit=TP, loss=SL)
// === /STRATEGY ===
// eof

AI BreakoutI Breakout is a professional TradingView indicator designed to detect powerful breakout zones in real-time.
Built with advanced trend, momentum, and liquidity logic, it includes over 6 smart filters and features:
✅ Flat market and trend detection filters
✅ 6 types of Take Profit and Stop Loss systems
✅ Built-in indicators: ADX, EMA, SuperTrend, Volume Boost
✅ Advanced risk management: Breakeven, Trailing SL, Multi Take-Profit
✅ Proven backtest results: 65% win rate and +8,400 USDT Net Profit
✅ Works on all pairs and timeframes (Crypto, Forex, Indices)

CE XAU/USDT Strategy📌 Auto-Trading Strategy Using CE on XAU/USDT (5M)
Indicator: CE
Parameters:
• ATR Period: 1
• ATR Multiplier: 1.85
Timeframe: 5 minutes
Instrument: Gold (XAU/USD)
🔁 Logic:
• Buy signal → Close short, open long
• Sell signal → Close long, open short
⚙️ Automation:
1. CE indicator on TradingView generates signals
2. Signals are sent via webhook to a Python bot
3. The bot opens/closes trades in MT5 accordingly
✅ Advantages:
• Full automation
• Operates 24/7 without manual intervention
⚠️ Important:
• Always test on a demo account
• Manage risk and position size properly
📌 Стратегия автоторговли по CE на XAU/USDT (5М)
Индикатор: CE
Параметры:
• ATR Period: 1
• ATR Множитель: 1.85
Таймфрейм: 5 минут
Инструмент: Золото (XAU/USD)
🔁 Логика:
• Buy сигнал → закрыть шорт, открыть лонг
• Sell сигнал → закрыть лонг, открыть шорт
⚙️ Автоматизация:
1. CE в TradingView генерирует сигналы
2. Webhook отправляет их в Python-бот
3. Бот открывает/закрывает сделки в MT5
✅ Плюсы:
• Полная автоматизация
• Работа 24/7 без вмешательства
⚠️ Важно:
• Тестируй на демо
• Управляй рисками и лотами

BB + RSI Strategy Optimized✅ Pine Script Version 5
✅ Complete Strategy: Long + Short
✅ Automatic Entry and Exit
✅ Visual Signals: Buy/Sell, Short/Cover
✅ Trailing Take Profit
✅ Progressive

Intraday Combo Strategy HHStochastic RSI Momentum/Reversal quickly identifies overbought/oversold zones
MACD Momentum/Trend confirms a trend reversal, a late but powerful signal
Supertrend Trend Tracking provides clear and concise buy/sell signals
Bollinger Bands Volatility shows price deviation during breakouts/squeezes
ADX Trend Strength measures trend strength to filter out false signals

逆勢布林+RSI策略 for SOL可以直接套用到 SOLUSDT, SOLPERP, 或其他 SOL 合約。
在策略回測介面中選擇 5min 或 15min 看策略表現。
若要調整停利%或 RSI 數值,改變 rsi < 25 與 (shortEntryPrice - close) / shortEntryPrice >= 0.035 即可。
This can be directly applied to SOLUSDT, SOLPERP, or other SOL futures.
In the strategy backtesting interface, select 5-minute or 15-minute periods to view strategy performance.
To adjust the take-profit percentage or RSI value, set RSI < 25 and (shortEntryPrice - close) / shortEntryPrice >= 0.035.

Max Profit Min Loss Options Strategyoption when to buy and sell calls and puts indicator. it uses the rsi macd and volume indicators. it has high profit and low loses
200 SMA (5%/-3% Buffer) for SPY & QQQ In my testing TQQQ is an absolute monster of an ETF that performs extremely well even from a buy and hold standpoint over long periods of time, its largest drawback is the massive drawdown exposure that it faces which can be easily sidestepped with this strategy.
This strategy is meant to basically abuse TQQQ's insane outperformance while augmenting the typical 200SMA strategy in a way that uses all of its strengths while avoiding getting whipsawed in sideways markets.
The strategy BUYS when price crosses 5% over the 200SMA and then SELLS when price drops 3% below the 200SMA. Between trades I'll be parking my entire account in SGOV.
So maximizing profit while minimizing risk.
You use the strategy based off of QQQ and then make the trades on TQQQ when it tells you to BUY/SELL.
Here are some reasons why I will be using this strategy:
Simple emotionless BUY and SELL signals where I don't care who the president is, what is happening in the world, who is bombing who, who the leadership team is, no attachment to individual companies and diversified across the NASDAQ.
~85% win percentage and when it does lose the loses are nothing compared to the wins and after a loss you're basically set up for a massive win in the next trade.
Max drawdown of around 53% when using TQQQ
You benefit massively when the market is doing well and when there is a recession you basically sit in SGOV for a year and then are set up for a monster recovery with a clear easy BUY signal. So as long as you're patient you win regardless of what happens.
The trades are often very long term resulting in you taking advantage of Long Term Capital Gains tax advantage which could mean saving up to 15-20% in taxes.
With only a few trades you can spend time doing other stuff and don't have to track or pay attention to anything that is happening.
Simple, easy, and massively profitable.

SwingTrade ADX Strategy v6This is a swing trading strategy that combines VWAP (Volume Weighted Average Price), ADX (Average Directional Index) for trend strength, and volume ratios to generate long/short entry and exit signals. It's designed for daily charts but can be adapted.
#### Key Features:
- **Entries**: Based on VWAP crossovers, rising/falling delta (price deviation from VWAP), ADX trend confirmation, and volume ratios.
- **Exits**: Dynamic exits when VWAP delta reverses after a peak.
- **Filters**: Optional toggles for VWAP signals, ADX, and volume. Backtest date range for custom periods.
- **Visuals**: VWAP line, signal shapes/labels, and an info panel showing key metrics (VWAP Delta %, ADX, Volume Ratio).
- **Alerts**: Built-in alerts for buy/sell entries and exits.
#### How to Use:
1. Apply to your chart (e.g., stocks, forex, crypto).
2. Adjust parameters in the settings (e.g., ADX threshold, volume period).
3. Enable/disable indicators as needed.
4. Backtest using the date filters and review equity curve.
**Disclaimer**: This is for educational purposes only. Past performance is not indicative of future results. Not financial advice—trade at your own risk. Backtest thoroughly and use with proper risk management.
Feedback welcome! If you find it useful, give it a like.

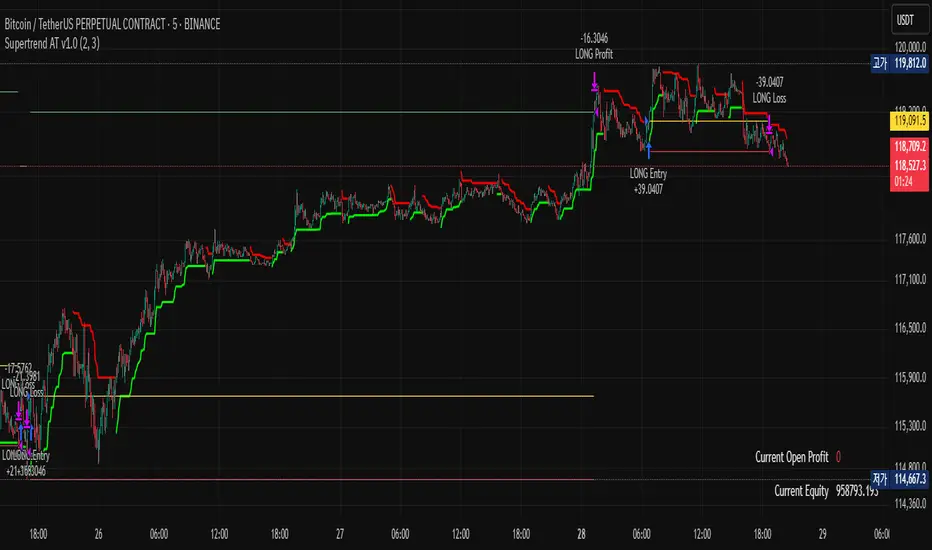
Supertrend AT v1.0### Overview
"Supertrend AT v1.0" is an automated trading strategy based on the Supertrend indicator, designed to detect trend reversals and execute entries accordingly. This script supports both **long and short** positions and includes customizable risk management features such as **RPT (Risk Per Trade)** and **RR (Risk/Reward ratio)**.
### Key Features
- 📈 **Supertrend-based Entry Logic**:
- Enters a **long position** when the Supertrend flips from red to green (downtrend → uptrend).
- Enters a **short position** when the Supertrend flips from green to red (uptrend → downtrend).
- 💰 **Auto-Calculated Position Sizing**:
- Quantity is automatically calculated to ensure that loss per trade (including commission) matches the specified risk percentage (RPT).
- 🎯 **Take-Profit and Stop-Loss**:
- Both targets are dynamically computed using the RR ratio and account for commission fees.
- 📊 **Visual Elements**:
- Entry, stop, and target prices are plotted on the chart.
- Real-time PnL and account equity are shown in a dashboard.
- Optional on-screen README guide explains the strategy and key terms.
### Inputs
- **RPT (%)**: Risk per transaction (based on account equity).
- **RR**: Reward-to-risk ratio.
- **Commission (%)**: Used in all calculations (must match the Properties tab).
- **Supertrend Settings**: Adjustable factor and length.
- **Market Decimal Places**: For accurate quantity rounding according to exchange rules.
- **Time Filter**: Set start and end time for trading logic activation.
### Risk Management Logic
This strategy calculates trade size and targets using a formula that considers both the price distance between entry and stop-loss and the effect of commission fees. This ensures:
- Consistent risk across trades
- Realistic take-profit levels
- Exchange-compliant order quantities
### Notes
- ⚠️ Be sure to set the **correct commission rate** and **decimal precision** for your exchange.
- ⚠️ If trade quantity is smaller than your exchange’s minimum unit, orders may be rejected.
- 🔧 For strategy to behave as intended in automation, double-check both **input tab** and **Properties tab** settings.
### Disclaimer
This strategy is for educational and research purposes only. It does not constitute financial advice. Always test on paper before using in a live environment.
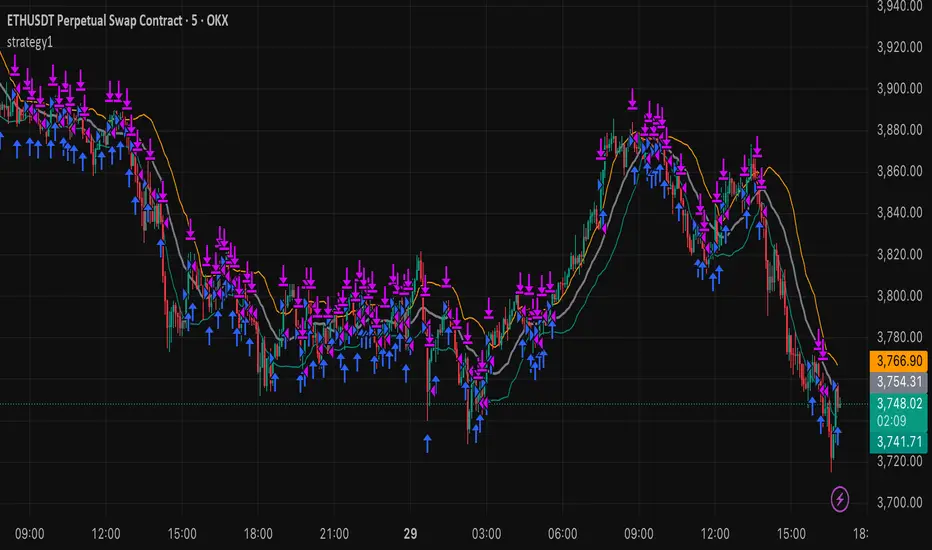
strategy15min bar, short-term and scalp strategy, eth, using stdev as trend line, long when price hits the lower line, short when price hits the upper line.
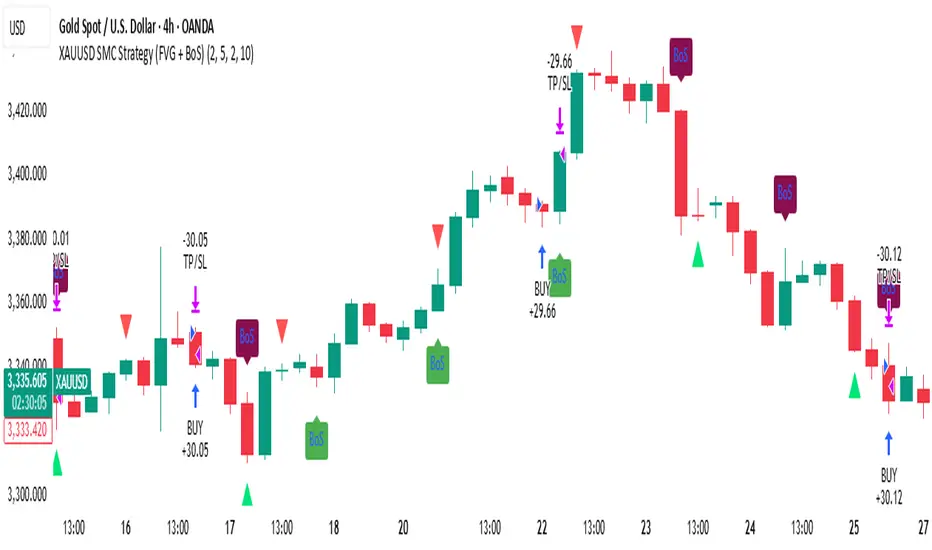
XAUUSD SMC Strategy (FVG + BoS)This advanced TradingView strategy is built for serious traders who follow Smart Money Concepts (SMC), with a special focus on Fair Value Gaps (FVG) and Break of Structure (BoS). The script automates trade entries and visual signals based on clean price action, while also allowing for performance backtesting through the built-in Strategy Tester.
The purpose of this script is to combine high-probability SMC signals with a clear and flexible backtest engine. Traders can visually confirm institutional moves (like imbalances and structure breaks) while simultaneously analyzing strategy performance, risk-reward, and execution logic — all from one chart.
⚙️ Key Features
FVG Detection: Automatically identifies bullish and bearish fair value gaps, highlighting imbalance zones between institutional buying and selling activity.
Break of Structure (BoS): Clearly shows bullish and bearish structure breaks, helping traders confirm directional bias and spot trend shifts with clarity.
Trade Execution Logic: Designed with actual strategy.entry() and strategy.exit() functions, this script simulates trades using risk-controlled logic with stop loss and take profit targeting.
Spaced Signal Visualization: Avoids chart clutter by spacing FVG and BoS signals, making the visual output clean and readable — even on fast-moving charts like XAUUSD.
Risk-Reward Customization: Easily set your own risk:reward ratio and stop-loss buffer, ensuring each trade is simulated according to your personal strategy or trading plan.
Cool-Down System: Add a delay between trades using the “Bars Between Trades” setting to prevent overtrading during volatile periods.
Live and Historical Insights: Signals appear in real-time, while also being plotted historically — making it easy to scroll back and study how the market behaved under this logic.
Fully Editable Parameters: Customize FVG size, structure lookback, spacing intervals, and more to fit your unique interpretation of SMC methodology.
🧠 How It Works
This strategy combines two key concepts:
FVG (Fair Value Gaps): Price zones where the market moved too quickly and left an imbalance between buyers and sellers. These gaps often act as magnets for price or areas of reversal.
BoS (Break of Structure): Points where the price breaks through a significant high or low, indicating a potential shift in market direction.
When both FVG and BoS align under certain conditions — and the cooldown requirement is satisfied — the strategy places a trade. A take profit and stop loss are automatically applied based on your inputs.
📈 Practical Use Cases
Trend Confirmation: Use BoS signals to validate trend continuation trades, especially when FVG confirms the imbalance.
Reversal Zones: Spot potential turning points when price fills an FVG and breaks previous structure in the opposite direction.
Backtest SMC Logic: Validate your theory by testing this strategy over historical XAUUSD data using real stop loss / take profit logic.
Refine Entry Timing: Study how structure breaks and FVGs align in different timeframes to improve entry precision.
💡 Best For
Traders learning or mastering Smart Money Concepts
Price action purists who avoid indicators
XAUUSD scalpers, day traders, or swing traders
Strategy developers who want visual + backtested confirmation
📌 Notes
The default strategy places trades every 10 candles to ensure the engine runs — replace this with your refined FVG + BoS logic as needed.
Works best on Gold (XAUUSD) 4H, 1H, or 15m timeframes depending on volatility and structure spacing.
🔒 Disclaimer
This strategy is for educational purposes only. It does not constitute financial advice. Always test and validate any trading logic before applying it to a live market. Trading carries risk — use proper risk management.
MVO - MA Signal StrategyStrategy Description: MA Signal Strategy with Heikin Ashi, Break-even and Trailing Stop
⸻
🔍 Core Concept
This strategy enters long or short trades based on Heikin Ashi candles crossing above or below a moving average (MA), with optional confirmation from the Money Flow Index (MFI). It includes:
• Dynamic stop loss and take profit levels based on ATR
• Optional break-even stop adjustment
• Optional trailing stop activation after breakeven
• Full visual feedback for trades and zones
⸻
⚙️ Indicators Used
• Heikin Ashi Candles: Smooth price action to reduce noise.
• Simple Moving Average (MA): Determines trend direction.
• Average True Range (ATR): Sets volatility-based SL/TP.
• Money Flow Index (MFI): Optional momentum filter for entries.
⸻
📈 Trade Entry Logic
✅ Long Entry:
Triggered if:
• Heikin Ashi close crosses above the MA
or
• MFI is below 20 and Heikin Ashi close is above the MA
❌ Short Entry:
Triggered if:
• Heikin Ashi close crosses below the MA
or
• MFI is above 90 and Heikin Ashi close is below the MA
⸻
🛑 Stop Loss & Take Profit
• SL is set using riskMult * ATR
• TP is set using rewardMult * ATR
Example:
• If ATR = 10, riskMult = 1, rewardMult = 5
→ SL = 10 points, TP = 50 points from entry
⸻
⚖️ Break-even Logic (Optional)
• If price moves in your favor by breakevenTicks * ATR, SL is moved to entry price.
• Enabled via checkbox Enable Break Even.
⸻
📉 Trailing Stop Logic (Optional)
• Once break-even is hit, a trailing stop starts moving behind price by trailATRmult * ATR.
• Trailing stop only activates after break-even is reached.
• Enabled via checkbox Enable Trailing Stop.
📊 Visual Elements
• Heikin Ashi candles are drawn on the main chart.
• Trade zones are shaded between SL and TP during open trades.
• Lines mark Entry, SL, TP, Break-even trigger.
• Markers show entries and exits:
• Green/red triangles = long/short entries
• ✅ = Take profit hit
• ❌ = Stop loss hit
✅ Best Use Case
• Trending markets with strong pullbacks
• Works on multiple timeframes
• Better suited for assets with consistent volatility (ATR behavior)

Momentum Strategy 2Just a quick modification on the original uses 50 period and 15 min chart. The blue line is the basic vwap indicator included in trading view not required but can act as a filter or for reversion back to vwap signals.

J-Lines Ribbon • 4-Cycle Engine (CHOP / ANTI / LONG / SHORT)📈 J-Lines Ribbon • 4-Cycle Engine (CHOP / ANTI / LONG / SHORT)
Version: Pine Script v6
Author: Thomas Lee
Category: Trend-Following / Mean Reversion / Scalping
Timeframes: Optimized for 1–5m (but adaptable) Seems to work best on Fibb Time
🧠 Strategy Overview:
The J-Lines Ribbon 4-Cycle Engine is a precision trading algorithm designed to navigate complex market microstructure across four adaptive states:
🔁 CHOP (No Trade / Flatten)
🟡 ANTI (Legacy Layer / Under Development)
🟢 LONG (Trend-Continuation & Rebounds)
🔴 SHORT (Inverse Trend-Continuation & Rebounds)
It combines a multi-layer EMA ribbon, ADX-based CHOP detection, and smart pivot analysis to dynamically shift between market modes, entering and exiting trades with surgical precision.
🔍 Core Features:
Dynamic Market Cycle Detection
Auto-classifies each bar into one of the 4 market states using ADX + EMA 72/89 crossovers.
One-Shot Entries & Rebound Logic
Initiates base entries at the start of new trend cycles. Re-entries (ReLong/ReShort) trigger on EMA 72 and EMA 126 pullbacks with momentum resumption.
CHOP State Autopilot
Automatically closes open positions when CHOP begins, preventing sideways market exposure.
Precision Take-Profits & Pivots-Based Stop Losses
Real-time adaptive exits using pivot high/low swing points as dynamic SL/TP anchors.
Customizable Parameters
Pivot length (left/right)
ADX thresholds
Rebound tolerance bands
Ribbon display and state-labels
📊 Indicator Components:
📏 EMA Ribbon: 72, 89, 126, 267, 360, 445
📉 ADX Filter: Filters out sideways noise, confirms directional bias
🔁 Crossover Events: Detects trend initiations
🌀 Cycle Labels: Real-time visual display of current market state
🛠️ Ideal Use Cases:
Scalping volatile markets
Automated strategy testing & optimization
Entry/exit signal confirmation for discretionary traders
Trend filtering in algorithmic stacks
⚠️ Notes:
ANTI cycle logic is scaffolded but not fully deployed in this version. It will be extended in a future release for deep mean-reversion detection.
Tailor ADX floor and pivot sensitivity to your specific asset and timeframe for optimal performance.

30M Scalping Strategy with Debug LogsWhat’s changed
Spot‑only: all short logic removed—only long entries and exits are generated.
Logging: uses log.info() to send entry/exit details (timestamp, price, ATR, RSI) to the Pine Logs console.
Clean & concise: core scalp logic (EMAs, RSI, MACD, volume, ATR SL/TP) remains intact.

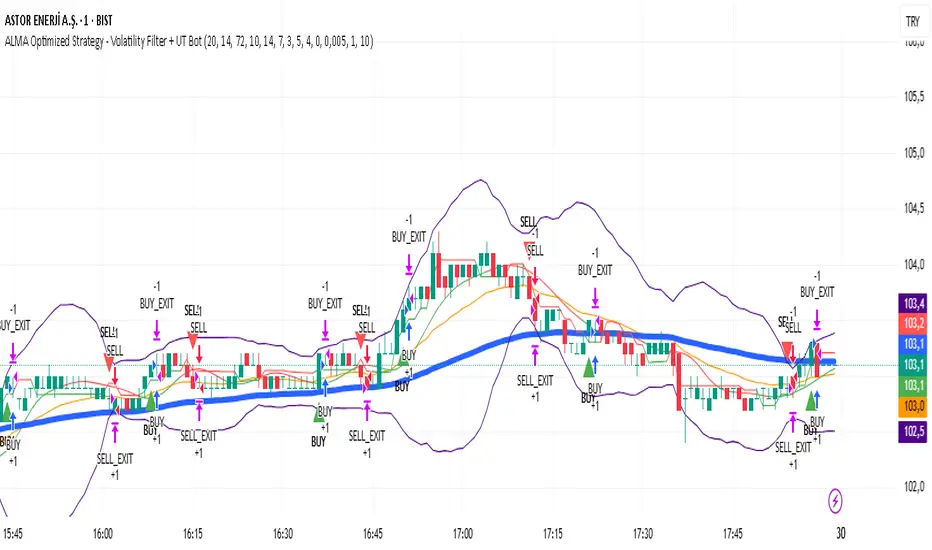
ALMA Optimized Strategy - Volatility Filter + UT BotThe strategy you provided is an ALMA Optimized Strategy implemented in Pine Script™ version 5 for TradingView. Here is a brief English summary of what it is and how it works:
It is a trend-following strategy combining multiple technical indicators to optimize trade entries and exits.
The core moving average used is the ALMA (Arnaud Legoux Moving Average), known for smoother and less lagging price smoothing compared to traditional EMAs or SMAs.
The strategy also uses other indicators:
Fast EMA (Exponential Moving Average)
EMA 50
ATR (Average True Range) for volatility measurement and dynamic stop loss and take profit levels
RSI (Relative Strength Index) for momentum with overbought/oversold levels
ADX (Average Directional Index) for confirming trend strength
Bollinger Bands as a volatility filter
Buy signals trigger when volatility is sufficient (ATR filter), price is above EMA 50 and ALMA, RSI indicates bullish momentum, ADX confirms trend strength, price is below the upper Bollinger Band, and there is a cooldown period to prevent repeated buys within a short time.
Sell signals are generated when price crosses below the fast EMA.
The strategy manages position entries and exits dynamically, applying ATR-based stop loss and take profit levels, and optionally a time-based exit.
Additionally, the script integrates the UT Bot, an ATR-based trailing stop and signal system, enhancing trade exit precision.
Buy and sell signals are visually marked on the chart with colored triangles for easy identification.
In essence, this strategy blends advanced smoothing (ALMA) with volatility filters and trend/momentum indicators to generate reliable buy and sell signals, while managing risk dynamically through ATR-based stops and profit targets. It aims to adapt to changing market conditions by filtering noise and confirming trends before entering trades.
Long and Short Strategy with Multi Indicators [B1P5]Long and Short Strategy with RSI, ROC, MA Selection, Exit Visualization, and Strength Indicator

World-Class Crypto Strategy version 9 - BTC/ETH/SOL/XRP + MLScript intended to mirror BlackRock strategies and be used with fully integrated trading bot

OrderFlow Delta PRO + VWAP + Niveles S/R (Solo Entradas)Script Summary: OrderFlow Delta PRO + VWAP + S/R Levels (Entries Only)
This script combines OrderFlow Delta analysis, VWAP, and key Support/Resistance (S/R) levels for both intraday and swing trading strategies. It is designed for professional traders looking to identify high-probability entry points based on order flow and technical zones, especially during high-liquidity sessions (London and New York).
Key Features:
Configurable Session Times:
Trades are only triggered during the London and New York sessions (Madrid time), avoiding signals during low-liquidity hours.
Automatic S/R Levels:
Plots the previous week's and day's highs, lows, and midpoints, making it easy to identify reaction zones and market structure.
VWAP:
Real-time Volume Weighted Average Price, serving as a fair value reference and directional filter.
OrderFlow Delta:
Calculates the difference between buy and sell volume (delta) for each bar and its standard deviation.
Bullish Imbalance: Strong buy pressure detected when the delta is significantly positive for three consecutive candles.
Bearish Imbalance: Strong sell pressure detected when the delta is significantly negative for three consecutive candles.
Climax & Absorption Detection:
Identifies volume climax bars and possible absorption zones, filtered by the bar's close relative to its open.
Entry Signals with VWAP Filter:
Longs: Only when price is above VWAP and there is bullish delta imbalance or sell absorption.
Shorts: Only when price is below VWAP and there is bearish delta imbalance or buy absorption.
Entry Signals Only:
The script plots entry signals on the chart with triangles (green for long, red for short).
No trade management (no stop loss, take profit, or trailing included).
Ideal for:
Scalping and intraday trading on liquid assets (BTC, XAUUSD , indices, forex, etc.)
Identifying reversals or breakouts confirmed by orderflow and technical context.
Traders seeking to refine their entries using orderflow confluence and key price zones.
Note:
This script only generates entry signals. Risk management and exits must be handled manually or by adding additional trade management modules.
------------------------------------------------------------------------------------------------------------------

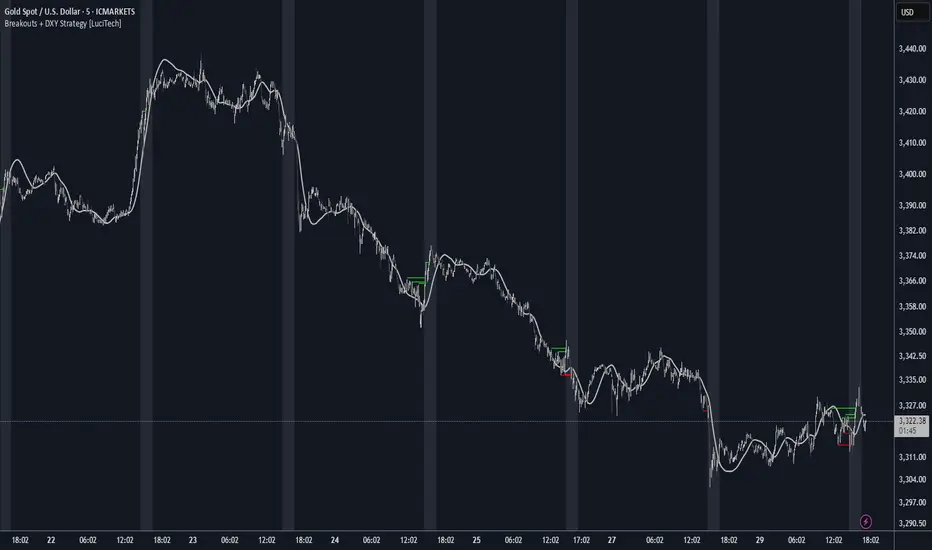
Breakouts With DXY Filter Strategy [LuciTech]This advanced breakout strategy combines pivot-based breakout detection with an innovative DXY (US Dollar Index) inverse correlation filter to enhance trade selection quality. The strategy identifies breakouts from recent pivot highs and lows while using DXY movements as a confirmation filter, based on the principle that USD strength/weakness often inversely correlates with other asset movements.
Key Features
Core Breakout Logic
- Pivot-Based Detection: Identifies breakouts above recent pivot highs (bullish) and below recent pivot lows (bearish)
- Customizable Lookback: Adjustable pivot length for different market conditions
- Visual Breakout Lines: Optional display of breakout levels with customizable colors
DXY Inverse Correlation Filter
- Smart USD Filter: Uses DXY movements to confirm breakout signals
- Inverse Logic: Long signals require DXY bearishness, short signals require DXY bullishness
- Threshold Control: Minimum DXY movement percentage required for signal confirmation
- Real-time DXY Data: Pulls live DXY data for accurate correlation analysis
Moving Average Filter
- Multiple MA Types: Support for SMA, EMA, WMA, VWMA, and HMA
- Trend Confirmation: Only takes trades in the direction of the selected moving average
- Customizable Parameters: Adjustable length and source for the moving average
Advanced Risk Management
- Multiple Stop Loss Types:
- ATR-based stops with customizable multiplier
- Candle-based stops using previous candle levels
- Fixed point-based stops
- Risk-Reward Optimization: Configurable risk-reward ratios (1:1 to 1:10)
- Breakeven Function: Automatic stop loss adjustment to breakeven after specified R-multiple
- Position Sizing: Percentage-based risk management with automatic position calculation
Time-Based Trading
- Session Filter: Trade only during specified time windows
- London Time Zone: Uses Europe/London timezone for consistency
- Visual Session Highlighting: Optional background fill for active trading hours
Alert System
- Webhook Integration: JSON-formatted alerts for automated trading
- Telegram Support: Pre-formatted messages for Telegram bot integration
- Multiple Formats: Standard, Telegram, and Concise Telegram alert options
- Real-time Notifications: Instant alerts on breakout signals
How It Works
1. Breakout Detection: The script continuously monitors for closes above recent pivot highs or below recent pivot lows
2. DXY Confirmation: When a breakout occurs, the script checks if DXY is moving in the opposite direction with sufficient momentum
3. MA Filter: If enabled, ensures the breakout aligns with the overall trend direction
4. Time Filter: Validates that the signal occurs within the specified trading hours
5. Risk Calculation: Automatically calculates position size based on the defined risk percentage and stop loss distance
6. Trade Execution: Places trades with predetermined stop loss and take profit levels
Unique Advantages
- Multi-Timeframe Approach: Combines asset-specific breakouts with broader USD market sentiment
- False Breakout Reduction: DXY filter helps eliminate breakouts that lack fundamental backing
- Comprehensive Risk Management: Multiple stop loss methods and automatic position sizing
- High Customization: Extensive parameters for different trading styles and market conditions
- Professional Alert System: Ready for automated trading integration