EMA Trend & Stochastic Signal IndicatorThis indicator displays trend-aligned Stochastic crossover signals using EMA structure and swing-based directional filtering for market analysis.
Indicators and strategies

ES Signals (Sequencer Labels)Here i am using EMA crossover systems to catch the market. One can use this with their own choice.
Using Some simple rules, we can get some good quality trades! You can see for yourself before trading.
=== HOW TO USE THIS INDICATOR ===
1) Choose your market and timeframe. ( according to their need )
2) Choose if the strategy is long-only or bidirectional.
Don't overthink nobody knows the best answer of market. We're going to test and find out.
After you find a good combination, set up an alert system with the default Exponential Moving Average indicators provided by TradingView.
=== TIPS ===
Change the Time frame according to their need.
i) for intraday 3-5 minute.
ii) 60 minute for 3-4 days View
iii) Daily for positional
Try a Long-Only strategy to see if that performs better.

Improved Candle Strategy (without daily squared)# Candle Pattern Trading Strategy
## Core Logic
Analyzes the last 5 candlesticks to identify "close at high" and "close at low" patterns, generating long/short signals.
## Trading Conditions
- **Long**: ≥2 bars closed at high in past 5 bars + current bar closes at high → Open long
- **Short**: ≥2 bars closed at low in past 5 bars + current bar closes at low → Open short
- **Filter**: If ≥3 doji patterns detected, skip trading
## Risk Management
- Stop Loss: Based on entry bar's high/low
- Take Profit: Risk × 2x multiplier
- Cooldown: No trading for 2 bars after entry
- Session Filter: No trading for first 5 bars after market open
## Configurable Parameters
- Lookback period, doji threshold, close proximity ratio, TP/SL ratio, cooldown bars, etc.
**Use Cases**: 1-minute and higher timeframes on stocks/futures

Percentage Change Multi-Symbol Screener with Sorting featureThis indicator displays percentage price change (% change over previous candle) for up to 40 user-defined symbols in a dynamic table format. Each symbol can be customized through inputs, allowing users to monitor multiple instruments from a single chart.
A key feature of this script is Automatic Sorting . The table continuously updates in real time and rearranges symbols in ascending or descending order based on their % change values, making it easy to quickly identify relative performance across symbols.
The table refreshes automatically as market data updates, providing a clear and organized view without requiring manual interaction.
This script is intended as a market monitoring and visualization tool.
All examples, charts, scripts, indicators, or market discussions are strictly for demonstration, learning, and analytical purposes. No warranties or guarantees are made regarding accuracy, completeness, or future performance.
Feel free to share suggestions over improvements or report any issues you may encounter.

Vector Trinity III: Flow [CVD]**1. Introduction: The Truth Serum**
This indicator is **Part 3** of the "Vector Trinity" trading system. It is the final validator in the decision-making process.
While Part I defines the *Structure* and Part II identifies the *Impulse*, **Part III (Flow)** answers the most critical question in trading: **"Is there real money behind this move?"**
It represents the **Energy Dimension**, analyzing the Cumulative Volume Delta (CVD) to spot true breakouts and expose traps.
* **I: Structure:** Spatial boundaries.
* **II: Impulse:** Momentum timing.
* **III: Flow:** **Capital validation & Divergence detection (Current Indicator).**
**2. Core Logic: CVD Estimation**
True "Delta" requires tick-by-tick data, which is often unavailable or premium-locked. **Vector Trinity III** uses a sophisticated **Intrabar Position Estimation** algorithm to mathematically approximate buying vs. selling pressure:
* **The Math:** It analyzes where the Close sits relative to the High and Low of the candle.
* Close near High = Dominant Aggressive Buying.
* Close near Low = Dominant Aggressive Selling.
* **The CVD:** It accumulates these delta values over time to create a continuous "Flow" line. This reveals the long-term intent of smart money.
**3. The Trend Line & Divergence**
The indicator features a **Grey Trend Line** (EMA of CVD) which serves as the baseline for "Net Flow."
* **Teal Zone (Above Trend):** Net Inflow. Capital is aggressively entering the market, supporting the price.
* **Maroon Zone (Below Trend):** Net Outflow. Capital is leaving the market, suggesting weakness.
**4. The "Trap" Detector (Divergence)**
The primary superpower of this indicator is spotting **Divergences**:
* **The Bull Trap (Fakeout):** Price makes a Higher High, but CVD makes a Lower High (or trends down).
* *Meaning:* The price is rising due to a lack of liquidity, not aggressive buying. **Smart money is selling into the rally.**
* **The Bear Trap (Shakeout):** Price makes a Lower Low, but CVD makes a Higher Low.
* *Meaning:* Smart money is absorbing the selling pressure (buying the dip).
**5. How to Use**
* **The "Trinity" Confirmation:** Before taking a trade based on Part I (Structure) and Part II (Impulse), look at Part III.
* **For a Long Setup:**
1. Price breaks the Structure (Part I).
2. Momentum fires Green/Cyan (Part II).
3. **Flow (Part III) MUST be Teal and rising.**
* **The Veto Rule:** If Price breaks up, but Flow is Maroon/Falling, **CANCEL the trade**. It is likely a trap.
**Settings:**
* **Trend Length:** 20 (Standard trend baseline to determine Net Inflow/Outflow).
---
### **中文说明**
**1. 简介:市场的“测谎仪”**
本指标是“矢量三位一体”交易系统的 **第三部分**。它是决策过程中最后的验证者。
第一部分 (Structure) 定义了结构,第二部分 (Impulse) 识别了脉冲,而 **第三部分 (Flow)** 则回答了交易中最关键的问题:**“这波行情背后有真钱吗?”**
它代表了系统的 **能量维度**,通过分析累积成交量 Delta (CVD) 来识别真正的突破并揭露市场陷阱。
* **I: Structure 结构:** 空间边界。
* **II: Impulse 脉冲:** 动能时机。
* **III: Flow 流向:** **资金验证与背离侦测(本指标)。**
**2. 核心逻辑:CVD 估算算法**
真正的“Delta”数据通常需要逐笔成交数据 (Tick Data),这往往需要付费数据源。**Vector Trinity III** 使用了一套精密的 **K线内相对位置估算 (Intrabar Position Estimation)** 算法,在数学上逼近真实的买卖压力:
* **算法原理:** 它分析收盘价在 K 线最高价和最低价之间的相对位置。
* 收盘接近最高价 = 主动买入主导。
* 收盘接近最低价 = 主动卖出主导。
* **CVD (累积值):** 它将这些 Delta 值随时间累积,形成一条连续的“资金流向”线。这揭示了主力资金的长期意图。
**3. 趋势线与背离**
指标包含一条 **灰色趋势线** (CVD 的均线),作为“净流量”的基准。
* **青色区域 (趋势线上方):** 净流入。资金正在积极入场,支撑价格上涨。
* **深红区域 (趋势线下方):** 净流出。资金正在撤离市场,暗示行情虚弱。
**4. “陷阱”侦测器 (背离)**
本指标的核心超能力是识别 **背离 (Divergence)**:
* **多头陷阱 (诱多/假突破):** 价格创出新高,但 CVD 却创出新低(或趋势向下)。
* *含义:* 价格上涨是因为缺乏流动性(空涨),而不是因为有主动买盘。**主力资金正在借反弹出货。**
* **空头陷阱 (诱空/洗盘):** 价格创出新低,但 CVD 却在抬高。
* *含义:* 主力资金正在吸收抛压(在此位置吸筹)。
**5. 使用方法**
* **“三位一体”共振验证:** 在根据第一部分 (结构) 和第二部分 (脉冲) 开单之前,必须查看第三部分。
* **做多设置:**
1. 价格突破结构 (Part I)。
2. 动能点火变绿/青色 (Part II)。
3. **资金流 (Part III) 必须呈现青色且向上攀升。**
* **一票否决权:** 如果价格向上突破,但资金流是深红色/下降的,**立即取消交易**。这极大概率是一个陷阱。
**参数设置:**
* **Trend Length (趋势周期):** 20 (用于确定净流入/流出的标准基准线)。
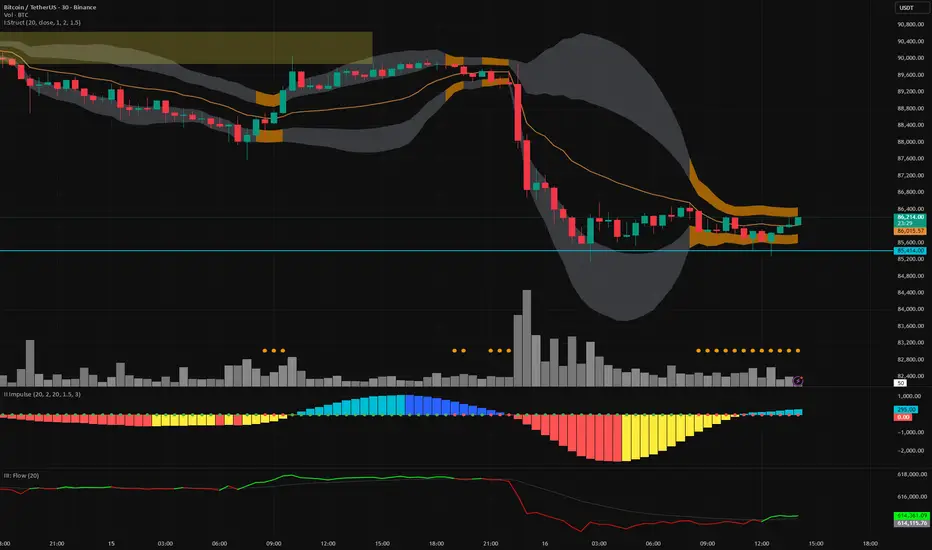
Vector Trinity indicator II: [Bottom: TTM Squeeze]**1. Introduction: The Engine of the System**
This indicator is **Part 2** of the "Vector Trinity" trading system. While Part I (Structure) defines *where* the price is, **Part II (Impulse)** defines *when* the move will happen and *how strong* it is.
It represents the **Time Dimension** of the system, focusing on momentum ignition and energy release.
* **I: Structure:** Spatial boundaries.
* **II: Impulse:** **Momentum velocity & Squeeze timing (Current Indicator).**
* **III: Flow:** Capital validation.
**2. Core Logic: Linear Regression Momentum**
Unlike standard momentum indicators (like MACD) which are based on Moving Averages and often lag significantly, **Vector Trinity II** utilizes **Linear Regression** on price deviations.
* **Math:** It calculates the distance between the price and the mean, then runs a linear regression to determine the angle of attack.
* **Benefit:** This provides a near-instantaneous reading of market "Velocity" and "Acceleration," reducing lag and allowing traders to see the turn before price fully commits.
**3. The "Squeeze" Mechanics (The Dots)**
The central line features dots that indicate the volatility state of the market:
* **🔴 Red Dot (Squeeze ON):** The Bollinger Bands have moved inside the Keltner Channels. Volatility is critically low. The market is storing energy like a compressed spring. **Action:** Wait. Do not trade yet.
* **🟢 Green Dot (Squeeze Fired):** The Bands have popped out of the Channels. The energy is releasing. **Action:** This is the "Ignition" signal. Look at the histogram color for direction.
**4. The 4-Color Momentum System**
The histogram bars are color-coded to tell the full story of the trend's lifecycle, not just direction:
* **Bullish Territory (Above 0):**
* **🟦 Cyan (Light Blue):** **Bullish Acceleration.** Buyers are aggressive. Momentum is increasing. (Best for entry).
* **🔷 Blue (Dark Blue):** **Bullish Deceleration.** Buyers are tired. Momentum is fading. (Prepare to take profit).
* **Bearish Territory (Below 0):**
* **🟥 Red:** **Bearish Acceleration.** Sellers are aggressive. Momentum is increasing. (Best for shorting).
* **🟨 Yellow:** **Bearish Deceleration.** Sellers are exhausted. Momentum is recovering towards zero. (Warning: Trend potential reversal).
**5. How to Use**
* **Step 1:** Look for **Red Dots** on the zero line. This identifies a high-potential setup building up.
* **Step 2:** Wait for the **First Green Dot**. This is the "Squeeze Fired" signal.
* **Step 3:** Confirm with the **Histogram Color**.
* If Green Dot + **Cyan Bar** = Long Signal.
* If Green Dot + **Red Bar** = Short Signal.
* **Advanced:** Use the **Yellow Bars** as an early warning to exit short positions before price actually reverses.
**Settings:**
* **Length:** 20 (Standard calculation period).
* **BB/KC Mult:** 2.0 / 1.5 (Standard ratios to define the Squeeze).
* **Smoothing:** Enabled (Default 3) to reduce noise and provide clearer color transitions.
---
### **中文说明**
**1. 简介:系统的核心引擎**
本指标是“矢量三位一体”交易系统的 **第二部分**。如果说第一部分 (Structure) 定义了价格*在哪里*,那么 **第二部分 (Impulse)** 则定义了行情*何时*启动以及力度*有多强*。
它代表了系统的 **时间维度**,专注于动能的点火与能量释放。
* **I: Structure 结构:** 空间边界。
* **II: Impulse 脉冲:** **动能速度与挤压时机(本指标)。**
* **III: Flow 流向:** 资金验证。
**2. 核心逻辑:线性回归动能**
传统的动能指标(如 MACD)通常基于移动平均线,存在显著的滞后性。**Vector Trinity II** 采用了基于价格偏离度的 **Linear Regression (线性回归)** 算法。
* **数学原理:** 它计算价格与均值的距离,并通过回归分析确定攻击的角度。
* **优势:** 这提供了几乎零滞后的市场“速度”与“加速度”读数,允许交易者在价格完全反转之前看到动能的拐点。
**3. “挤压”机制 (圆点信号)**
0轴上的圆点指示了市场的波动率状态:
* **🔴 红点 (Squeeze ON):** 布林带完全进入了肯特纳通道内部。波动率极低。市场像被压缩的弹簧一样在积蓄能量。**操作:** 等待,不要急于进场。
* **🟢 绿点 (Squeeze Fired):** 布林带扩张冲出通道。能量开始释放。**操作:** 这是“点火”信号。观察柱状图颜色以确定方向。
**4. 四色动能战术系统**
柱状图通过四种颜色讲述了趋势完整的生命周期,而不仅仅是涨跌:
* **多头区域 (0轴上方):**
* **🟦 青色 (Cyan):** **多头加速。** 买盘积极,动能增强。(最佳进场期)
* **🔷 蓝色 (Blue):** **多头减速。** 买盘疲惫,动能衰减。(准备止盈)
* **空头区域 (0轴下方):**
* **🟥 红色 (Red):** **空头加速。** 卖盘积极,动能增强。(最佳做空期)
* **🟨 黄色 (Yellow):** **空头减速。** 卖盘力竭,动能向0轴修复。(警告:趋势可能反转/抄底信号)
**5. 使用方法**
* **第一步:** 寻找0轴上的 **红点**。这标志着一个高爆发潜力的机会正在酝酿。
* **第二步:** 等待 **第一个绿点** 出现。这是“挤压释放/点火”的信号。
* **第三步:** 结合 **柱状图颜色** 确认。
* 绿点 + **青色柱** = 做多信号。
* 绿点 + **红色柱** = 做空信号。
* **进阶用法:** 利用 **黄色柱** 作为空单止盈的先行指标,往往在价格反弹之前,动能就已经变黄了。
**参数设置:**
* **Length (周期):** 20 (标准计算周期)。
* **BB/KC Mult (倍数):** 2.0 / 1.5 (定义挤压状态的标准比率)。
* **Smoothing (平滑):** 开启 (默认3) 以减少噪音,提供更平滑的颜色转换体验。

Vector Trinity I: Structure [VWAP-DBB] This indicator is **Part 1** of the "Vector Trinity" trading system—a comprehensive, data-driven framework designed to analyze market behavior through three distinct physical dimensions:
* **I: Structure (Space):** Defines the battlefield and volatility boundaries (Current Indicator).
* **II: Impulse (Time):** Identifies momentum ignition and energy release.
* **III: Flow (Energy):** Validates the move via volume and capital flow.
**2. Core Logic: Why Rolling VWAP?**
Most standard Bollinger Bands use a Simple Moving Average (SMA) as the centerline. The flaw in SMA is that it treats every candle equally, regardless of trading activity.
**Vector Trinity I** replaces the SMA with a **Rolling VWAP (Volume-Weighted Average Price)** over a rolling window (default 20).
* **Data Logic:** Price combined with Volume represents the true "cost basis" of the market.
* **Behavior:** The centerline becomes "sticky" during high-volume nodes and moves faster when real capital enters. It represents the *True Mean* of the market structure.
**3. The Dual-Band "Highway" Structure**
Instead of a single channel, this system utilizes a Double Bollinger Band (DBB) architecture based on Standard Deviations (StdDev) from the VWAP:
* **The Noise Zone (Basis to 1.0 StdDev):** The empty space in the middle. Price action here is often choppy and directionless.
* **The Acceleration Zone (1.0 to 2.0 StdDev):** The filled "Cloud." When candles close and stay within this zone, it indicates a strong trend (The Highway).
* **The Reversion Zone (> 2.0 StdDev):** Price is statistically extended and may revert to the mean.
**4. Volatility Squeeze Detection**
The indicator integrates a mechanical "Squeeze" detection based on the relationship between the Bollinger Bands (Variance) and Keltner Channels (ATR).
* **Squeeze ON (Orange Cloud & Dots):** Daily variance is at extreme lows. Energy is compressing. Do not trade direction; prepare for a breakout.
* **Squeeze OFF (Grey Cloud):** Expansion phase. Volatility is returning to the market.
**5. How to Use**
* **Step 1:** Observe the **Purple Line (VWAP)**. Its slope dictates the dominant trend structure.
* **Step 2:** Look for **Orange Zones**. This indicates a "Squeeze." Wait for the cloud to turn Grey.
* **Step 3:** Trade the breakout when price closes inside the "Acceleration Zone" (between the inner and outer bands) accompanied by Volume.
**Settings:**
* **Rolling Length:** 20 (Standard for swing/day trading).
* **Inner/Outer Bands:** 1.0 / 2.0 (The standard trend definition).
* **Squeeze Sensitivity:** 1.5 (Standard KC Multiplier).
---
### **中文说明**
**1. 简介:矢量三位一体系统 (Vector Trinity)**
本指标是“矢量三位一体”交易系统的 **第一部分**。这是一套基于数据逻辑的综合分析框架,旨在通过三个物理维度解构市场行为:
* **I: Structure 结构 (空间):** 定义价格运行的战场边界与波动率结构(本指标)。
* **II: Impulse 脉冲 (时间):** 识别动能的点火与能量释放。
* **III: Flow 流向 (能量):** 通过成交量与资金流验证突破的真伪。
**2. 核心逻辑:为什么要用 Rolling VWAP?**
传统的布林带使用简单移动平均线 (SMA) 作为中轨。SMA 的缺陷在于它平等地对待每一根 K 线,而忽略了成交量的权重。
**Vector Trinity I** 使用 **Rolling VWAP (滚动成交量加权平均价)** 替代了 SMA。
* **数据逻辑:** 只有结合了成交量的价格,才代表市场真实的“平均持仓成本”。
* **表现特征:** 在放量交易区,中轨会表现出更强的支撑/阻力特性;在缩量区则表现平滑。它代表了市场结构的*真实均值*。
**3. 双通道“高速公路”结构**
本系统不使用单条轨道,而是基于 VWAP 的标准差 (StdDev) 构建了双重布林带 (DBB) 架构:
* **噪音区 (中轨 到 1.0 标准差):** 中间的空白区域。在此区域内的价格通常是无方向的震荡。
* **加速区 (1.0 到 2.0 标准差):** 填充颜色的“云带”。当 K 线收盘并运行于此区域时,代表趋势确立,价格进入了“高速公路”。
* **回归区 (> 2.0 标准差):** 价格在统计学上过热,可能面临均值回归。
**4. 波动率挤压监测 (Squeeze)**
指标内置了基于布林带(方差)与肯特纳通道(ATR)对比的机械化“挤压”监测。
* **挤压状态 (橙色云带 & 底部圆点):** 每日方差处于极低值 (Variance at extreme lows)。市场正在积蓄能量。此时不应猜测方向,而应等待爆发。
* **扩张状态 (灰色云带):** 挤压结束,波动率回归,趋势展开。
**5. 使用方法**
* **第一步:** 观察 **紫色中轨 (VWAP)**。它的倾斜方向决定了主要的结构趋势。
* **第二步:** 寻找 **橙色区域**。这代表“挤压”正在发生。耐心等待云带变回灰色。
* **第三步:** 当价格突破并收盘在“加速区”(内轨与外轨之间)时,配合成交量介入交易。
**参数设置:**
* **Rolling Length (周期):** 20 (波段/日内交易的标准设置)。
* **Inner/Outer Bands (内外轨):** 1.0 / 2.0 (经典的趋势定义范围)。
* **Squeeze Sensitivity (敏感度):** 1.5 (标准肯特纳通道倍数)。

Universe_Super MA [MTF & Multi-Type]**Overview**
"Universe_Super MA" is a comprehensive trend analysis tool designed to overcome indicator limits. Instead of adding 4 separate moving averages, this script allows you to monitor 4 distinct Moving Averages within a single indicator slot.
It features full **Multi-Timeframe (MTF)** capabilities, meaning you can view higher timeframe trends (e.g., Daily 200 SMA) while trading on lower timeframes (e.g., 15-minute chart).
**Default Configuration (Institutional Setup)**
The indicator comes pre-loaded with a powerful institutional trend setup:
1. **50 Period (Green):** Short-term trend and dynamic support.
2. **99 Period (Orange):** Medium-term trend filter.
3. **200 Period (Red):** The classic institutional dividing line between Bull and Bear markets.
4. **389 Period (Blue):** A long-term "Deep Trend" baseline used to identify major market cycles and heavy support/resistance levels.
**Key Features**
* **fully Customizable:** You can change the Length, Color, and Width of each line.
* **Multi-Timeframe (MTF):** Select any timeframe for any MA. (e.g., Keep MA1 on the "Chart" timeframe, but lock MA4 to the "Daily" timeframe).
* **6 MA Types:** Choose between SMA, EMA, WMA, HMA (Hull), RMA, and VWMA for each line independently.
* **Clean Interface:** Toggle any line On/Off via settings without removing the indicator.
**Usage & Interpretation**
* **Trend Identification:** The 200 (Red) and 389 (Blue) lines are designed to visualize the long-term market bias. In technical analysis, price action sustaining above these levels is generally considered a bullish context, while price below suggests a bearish context.
* **Crossover Monitoring:** The script facilitates the observation of interactions between short-term and long-term averages (e.g., the 50 crossing the 200), allowing users to easily spot common technical patterns like the "Golden Cross".
* **Dynamic Levels:** The 99 and 200-period lines act as dynamic levels that may align with technical support or resistance zones during market retracements.
**Settings**
* **Timeframe:** Leave empty to use the current chart's timeframe, or select a specific one (e.g., "1D" or "4H").
* **Type:** Select your preferred calculation method (SMA is default).
**Disclaimer**
This tool is for educational purposes and trend visualization only. Always manage your risk.

STAR MTF OB FVGstill working out some bugs for it to work on lower tf than 10. so for now >10m.
FVG and OB

Risk & Order Size Calculatorhello,
this will calculate the risk and you may change the script as per your risk appetite, my advise do not risk more than 2% of your capital.
Thank you

MTF Key Levels Pro [Confluence & Flow]MTF Key Levels Pro is an all-in-one market structure and context toolkit designed to reduce chart noise and surface the price levels that matter most. It combines multi-timeframe trend alignment, institutional-style reference levels (VWAP anchors, pivots, volume POC, prior day levels), and confluence detection so you can quickly identify where price is likely to react—and whether the broader flow supports continuation or reversal.
This script is intentionally modular: you can enable only what you trade (scalping, day trading, swing, position) while keeping the chart readable via selective plotting and a compact MTF dashboard.
What It Does
1) Key Levels Engine (Core Map)
The indicator plots a “key-level stack” from multiple methodologies so you are not relying on a single lens:
Volume Profile POC (Point of Control) over a configurable lookback (highest traded activity zone).
Daily Pivot Levels calculated from prior day H/L/C (PP, R1, S1 and extended levels in the logic).
Fibonacci Retracements from recent swing range (38.2 / 50 / 61.8).
Moving Averages (three configurable MAs for trend structure).
Previous Day High/Low (PDH/PDL) for intraday reference points.
ATH/ATL tracking (optional) for macro context.
2) Anchored VWAP Suite (Flow Anchors)
A multi-anchor VWAP system that resets and recalculates at the start of each period:
Hourly VWAP (scalping / micro-structure)
Daily VWAP (day trading standard reference)
Weekly VWAP (swing context)
Monthly VWAP (position context)
3) Multi-Timeframe Alignment Dashboard (Trend Consensus)
The dashboard pulls 5 configurable timeframes (defaults: 5m, 30m, 1h, 4h, D) and displays:
Price snapshot per timeframe
Trend direction (simple momentum/trend comparison vs lookback)
Volume
% change
Alignment status (BULL ALIGNED / BEAR ALIGNED / MIXED), including bars since alignment began
Use this to avoid trading against higher timeframe pressure and to time entries when multiple timeframes agree.
4) Order-Flow Lite (Volume & Delta)
A practical “flow confirmation” layer using candle-based volume classification:
Buy vs sell volume approximation (close vs open)
Delta strength label (Strong Buy / Strong Sell / Neutral)
Volume surge detection vs SMA(volume) with a configurable multiplier
Optional background shading on surge events
5) Confluence Zones (Signal Compression)
Confluence zones automatically form when multiple independent levels cluster together within a configurable tolerance:
You choose tolerance % and minimum levels required (e.g., 3+).
Zones are plotted as highlighted regions and listed in the dashboard with proximity markers (AT / NEAR).
This is the “decision layer”: the script doesn’t just draw levels—it tells you where multiple reasons to react overlap.
How to Use It (Practical Outline)
Typical Workflow
Check dashboard alignment: trade with alignment for continuation setups; treat MIXED as caution/mean-reversion regime.
Identify nearest confluence zones: prioritize trades at/near zones versus isolated single levels.
Use VWAP anchor + PDH/PDL + Pivot as the intraday framework, then confirm with volume surge/delta bias.
Manage risk around zones: zones are natural areas for rejection, breakout, or retest logic.
Recommended Configurations (Quick Start)
Scalping (1m–5m chart): Hourly VWAP + Daily VWAP + Daily Pivots + Confluence
Day Trading (5m–1h): Daily VWAP + Pivots + PDH/PDL + Confluence + Alignment dashboard
Swing (1h–4h): Weekly VWAP + MA50/MA200 + Confluence + Alignment
Position (D/W): Monthly VWAP + MA200 + ATH/ATL + Confluence
Alerts Included
Confluence Touch: triggers when price is within proximity of a confluence zone.
Trend Change: triggers when the alignment state changes (e.g., MIXED → BULL ALIGNED).
Volume Spike: triggers on surge events versus the configured baseline.
Notes / Intended Use
This indicator is built for context and decision support (key levels + trend consensus + flow cues). It is not a standalone “buy/sell system” by design; instead, it provides a structured map for entries, invalidation, and target planning around areas of highest market agreement.
If you want, I can also produce a TradingView-ready “Description + Feature bullets + How to trade + Settings guide + Alert guide” in the exact formatting style commonly used on public TradingView scripts (including a short disclaimer and a clean feature list).

Varun's StrategyBuy and Sell strategy designed for a 1 minute chart to buy when RSI drops under 25 and sell when RSI exceeds 75

SMAHiLO- 2 EMA/SMA can be used for trend following default value is 50 and 200
- green box and red box incorporated to chart for visual representation for Week ,Daily, H4, H2,H1
- blue line representation for opening candle, previous low and previous high and by clicking prev. close open alert at setting it will alert if prev. low or high are reach and current opening candle is breakdown or breakout
settings:
- engulfing alert it will alert bullish engulfing entry if 50 is above 200 vise versa
- harami alert it will alert bullish harami if 50 is above 200 vise versa
- pullback alert it will alert bullish pullback if 50 is above 200 or bearish pullback if 50 below 200
- mcd ob/os alert it will display green circle above candle if macd getting weaker from bearish to bullish vise versa
- spot play alert most of the time buy alert only no sell alert.
- engul/harami alert it will alert if harami or engulfing is met unlike on engulfing alert and harami alert it will follow the trend if 50 above 200 vise versa.

NSE Swing Breadth NSE Swing Breadth – Market Health Dashboard (0–200, % from Neutral)
Overview
NSE Swing Breadth – Market Health Dashboard is a market-wide health and regime indicator designed to track internal strength and participation across Large-, Mid-, and Small-cap indices in the Indian equity market.
Instead of focusing on price alone, this tool measures how strongly each segment is behaving relative to its own swing trend, normalizes those movements, and combines them into a single Market Health score. The result is a clean, objective dashboard that helps traders identify Risk-On, Caution, and Risk-Off regimes.
This indicator is best used for position sizing, exposure control, and timing aggressiveness, rather than individual stock entries.
Data Used
The indicator internally tracks three broad NSE indices:
Large Caps → NIFTY100EQUALWEIGHT
Mid Caps → NIFTYMIDCAP150
Small Caps → NIFTYSMLCAP250
Using equal-weighted and broad indices ensures the signal reflects true market participation, not just index heavyweights.
Core Logic
1. Swing Strength Model
For each index, the script calculates normalized swing strength:
Price is compared to its EMA swing baseline
The deviation from the EMA is normalized using the EMA of absolute deviations
This creates a volatility-adjusted strength value, allowing fair comparison across market regimes
This answers the question:
Is this segment pushing meaningfully above or below its recent trend?
2. Strength Converted to % from Neutral (Baseline = 100)
Each segment’s strength is converted into percentage-style points around a neutral baseline of 100:
100 = Neutral
+15 = +15% strength above neutral
–20 = –20% weakness below neutral
These values are plotted as three smooth lines:
Blue → Large Caps
Orange → Mid Caps
Purple → Small Caps
This makes relative leadership and divergence immediately visible.
3. Market Health Score (0–100)
The indicator combines all three segments into a single Market Health score:
Large Caps → 40% weight
Mid Caps → 35% weight
Small Caps → 25% weight
Extreme values are clamped to avoid distortion, and the final score is normalized to a 0–100 scale:
70–100 → Strong, broad participation
40–69 → Mixed / unstable participation
0–39 → Weak, risk-off conditions
Visual Components
📊 Market Health Histogram
A vertical histogram displays Market Health (0–100) with enhanced visibility:
🟢 Green (≥ 70) → Strong Risk-On regime
🟠 Orange (40–69) → Caution / Transition
🔴 Red (< 40) → Risk-Off regime
The histogram is visually compact and designed to reflect true market health, not exaggerated spikes.
📈 Strength Lines (Baseline = 100)
Three strength lines show % deviation from neutral:
Above 100 → Positive internal strength
Below 100 → Internal weakness
These lines help identify:
Leadership (which segment is driving the market)
Early deterioration (small/mid caps weakening first)
Broad confirmation (all segments rising together)
Dashboard Tables
📌 Market Regime Table (Bottom-Left)
Displays the current market regime:
🟢 RISK ON
🟡 CAUTION
🔴 RISK OFF
Along with the exact Market Health score (0–100).
📌 Strength Table (Top-Right)
Shows Large / Mid / Small cap strength as % from neutral, for example:
+18% → 18% above neutral
–12% → 12% below neutral
This avoids misleading interpretations and keeps values intuitive and actionable.
How to Use This Indicator
Risk-On (Green)
Favor full position sizes, trend-following strategies, and broader participation trades.
Caution (Orange)
Reduce leverage, tighten stops, and be selective. Expect choppiness.
Risk-Off (Red)
Prioritize capital protection, reduce exposure, and avoid aggressive longs.
This indicator is not an entry signal — it is a market environment filter.
⚠️ Important Style Setting (Required)
For correct visualization:
Settings → Style → Uncheck “Labels on price scale”
This prevents the indicator’s internal 0–200 model scale from interfering with the chart’s price scale and keeps the pane clean and readable.
Summary
NSE Swing Breadth – Market Health Dashboard provides a clear, objective view of market internals, helping traders align their risk with the true underlying condition of the market — not just price movement.
It is especially effective for:
Market regime identification
Exposure management
Avoiding false breakouts in weak breadth environments

Auction Imbalance And Rebalance IndicatorThis indicator marks areas of Internal Range Liquidity along with Ecternal Range Liquidity

Ace Algo [Anson5129]🏆 Exclusive Indicator: Ace Algo
📈 Works for stocks, forex, crypto, indices
📈 Easy to use, real-time alerts, no repaint
📈 No grid, no martingale, no hedging
📈 One position at a time
----------------------------------------------------------------------------------------
Ace Algo
A trend-following TradingView strategy using a confluence of technical indicators and time-based rules for structured long/short entries and exits:
----------------------------------------------------------------------------------------
Parameters Explanation
Moving Average Length
Indicates the number of historical data points used for the average price calculation.
Shorter = volatile (short-term trends); longer = smoother (long-term trends, less noise).
Default: 20
Entry delay in bars
After a trade is closed, delay the next entry in bars. The lower the number, the more trades you will get.
Default: 4
Take Profit delay in bars
After a trade is opened, delay the take profit in bars. The lower the number, the more trades you will get.
Default: 3
Enable ADX Filter
No order will be placed when ADX < 20
Default: Uncheck
Block Period
Set a block period during which no trading will take place.
----------------------------------------------------------------------------------------
Entry Condition:
Only Long when the price is above the moving average (Orange line).
Only Short when the price is below the moving average (Orange line).
* Also, with some hidden parameter that I set in the backend.
Exit Condition:
When getting profit:
Trailing Stop Activates after a position has been open for a set number of bars (to avoid premature exits).
When losing money:
In a long position, when the price falls below the moving average, and the conditions for a short position are met, the long position will be closed, and the short position will be opened.
In a short position, when the price rises above the moving average, and the conditions for a long position are met, the short position will be closed, and the long position will be opened.
----------------------------------------------------------------------------------------
How to get access to the strategy
Read the author's instructions on the right to learn how to get access to the strategy.

UK Public OnesideRSI + Stochastic V1 (Moderate) Strategy
This strategy combines RSI, Stochastic Oscillator, and a 50 EMA trend filter to identify moderate-risk trading opportunities in trending markets.
How it works:
Long entries occur when RSI and Stochastic are in oversold conditions while price is above the 50 EMA.
Short entries occur when RSI and Stochastic are in overbought conditions while price is below the 50 EMA.
Trades are confirmed on the previous candle, avoiding premature entries and exits.
Risk management is handled using fixed percentage stop-loss with configurable risk-to-reward targets.
Optional RSI-based exits close positions early during overbought or oversold conditions.
Key Features:
Trend-filtered entries using EMA 50
Non-repainting logic (confirmed candle signals)
Configurable stop-loss and reward ratio
Works well for scalping and intraday trading
Suitable for crypto, forex, and indices
Recommended Timeframes:
5m, 15m, 30m
Note:
This strategy is designed for educational and research purposes. Always forward-test and apply proper risk management before using in live trading.

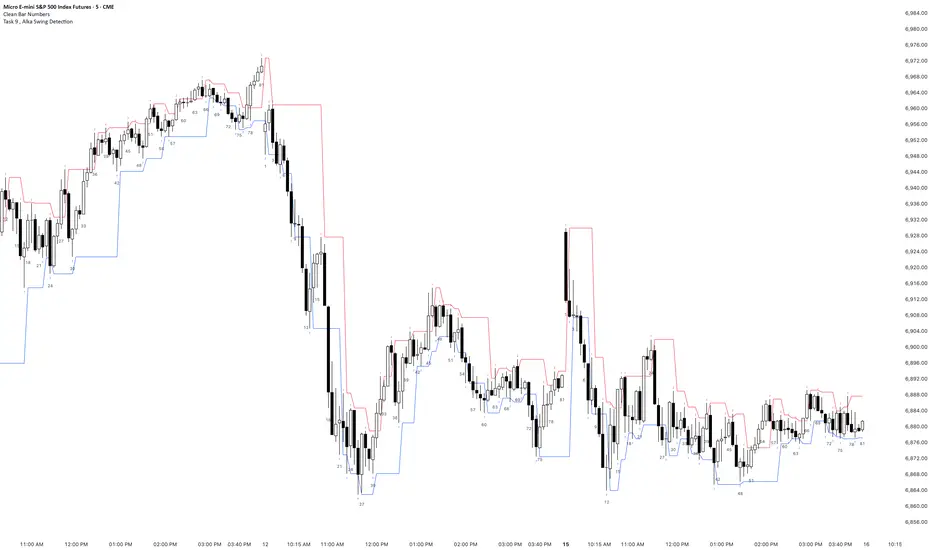
Task 9 , Alka Swing DetectionFirst swing detection code First swing detection code, inspired by Alka, Trading view is asking me to write more description First swing detection code, inspired by Alka, Trading view is asking me to write more description First swing detection code, inspired by Alka, Trading view
GARCH Adaptive Volatility & Momentum Predictor
💡 I. Indicator Concept: GARCH Adaptive Volatility & Momentum Predictor
-----------------------------------------------------------------------------
The GARCH Adaptive Momentum Speed indicator provides a powerful, forward-looking
view on market risk and momentum. Unlike standard moving averages or static
volatility indicators (like ATR), GARCH forecasts the Conditional Volatility (σ_t)
for the next bar, based on the principle of volatility clustering.
The indicator consists of two essential components:
1. GARCH Volatility (Level): The primary forecast of the expected magnitude of
price movement (risk).
2. Vol. Speed (Momentum): The first derivative of the GARCH forecast, showing
whether market risk is accelerating or decelerating. This component is the
main visual signal, displayed as a dynamic histogram.
⚙️ II. Key Features and Adaptive Logic
-----------------------------------------------------------------------------
* Dynamic Coefficient Adaptation: The indicator automatically adjusts the GARCH
coefficients (α and β) based on the chart's timeframe (TF):
- Intraday TFs (M1-H4): Uses higher α and lower β for quicker reaction
to recent shocks.
- Daily/Weekly TFs (D, W): Uses lower α and higher β for a smoother,
more persistent long-term forecast.
* Momentum Visualization: The Vol. Speed component is plotted as a dynamic
histogram (fill) that automatically changes color based on the direction of
acceleration (Green for up, Red for down).
📊 III. Interpretation Guide
-----------------------------------------------------------------------------
- GARCH Volatility (Blue Line): The predicted level of market risk. Use this to
gauge overall position sizing and stop loss width.
- Vol. Speed (Green Histogram): Momentum is ACCELERATING (Risk is increasing rapidly).
A strong signal that momentum is building, often preceding a breakout.
- Vol. Speed (Red Histogram): Momentum is DECELERATING (Risk is contracting).
Indicates momentum is fading, often associated with market consolidation.
🎯 IV. Trading Application
-----------------------------------------------------------------------------
- Breakout Timing: Look for a strong, high GREEN histogram bar. This suggests
the volatility pressure is increasing rapidly, and a breakout may be imminent.
- Consolidation: Small, shrinking RED histogram bars signal that market energy
is draining, ideal for tight consolidation patterns.

Entry / TP / SL Alert Bands (Simple & Stable)
Get an alert before you reach your take profit or stop loss. Set as a percentage over the distance to your stop loss and take profit and improve your Money Management

FX Session High/Low Bands - Last 5 EST Days
FX Session High/Low Bands - Last 5 Days
Description:
This indicator plots horizontal bands representing the high and low price levels from the major forex trading sessions over the last 5 days. It helps traders identify key support and resistance zones based on recent session activity.
Features:
Multiple Session Tracking: Displays high/low levels for major FX sessions:
Asian Session (Tokyo)
European Session (London)
US Session (New York)
5-Day Lookback: Captures the highest high and lowest low from each session over the previous 5 trading days
Visual Bands: Clear horizontal lines or filled zones showing session boundaries
Dynamic Updates: Automatically recalculates as new session data becomes available
How to Use:
Support/Resistance: Previous session highs/lows often act as key price levels
Breakout Trading: Watch for price breaking above/below session bands
Range Trading: Trade within the bands during consolidation periods
Session Overlap: Pay attention to multiple session bands converging
Ideal For:
Forex day traders
Session-based trading strategies
Support/resistance identification
Multi-timeframe analysis

Ingenuity Crazy Strategy Advance IntraThis indicator works — IF you use it correctly.
Wrong settings = bad results.
That’s why we keep:
🔥 The exact settings
🔥 Market-specific presets
🔥 Live trade examples
INSIDE OUR DISCORD ONLY.
🚫 Do not guess
🚫 Do not freestyle settings
👉 Join the Discord and trade it the way it’s meant to be traded.
discord.gg

Day of WeekDay of Week is an indicator that runs in a separate panel and colors the panel background according to the day of the week.
Main Features
Colors the background of the lower panel based on the day of the week
Includes all days, from Monday to Sunday
Customizable colors
Time Offset Correction
TradingView calculates the day of the week using the exchange’s timezone, which can cause visual inconsistencies on certain symbols.
To address this, the indicator includes a configurable time offset that allows the user to synchronize the calculated day with the day displayed on the chart.
By simply adjusting the Time Offset (hours) parameter, the background will align correctly with the visible chart calendar.
