SB - RSI EW OscillatorAdd EW with RSI.
Makes sense take a call if RSI is above 50 and EW turns green and vice versa.
Indicators and strategies

Reversal Strength with Momentum Ratings on 4hr charts Here's a quick breakdown of what you'll see on your chart and how to actually use the indicator!
Reversal Labels:
↑ = Bullish reversal (price reversing upward)
↓ = Bearish reversal (price reversing downward)
STRONG (bright green/red) = High-confidence reversal (score > 65)
weak (faded green/red) = Low-confidence reversal (score ≤ 65)
Number on label = Reversal strength score (0-100)
Momentum Table (Top Right):
Overall Score (0-100) = Total momentum strength
Green (80+) = Very strong momentum
Yellow (40-60) = Moderate momentum
Orange/Red (<40) = Weak/stalling momentum
Individual Momentum Scores (each worth 0-20 points):
Volume = How much trading activity vs average
Price ROC = How fast price is moving (rate of change)
MA Spacing = How spread out the moving averages are (trend strength)
ADX = Directional movement indicator (trend conviction)
RSI Mom. = How far RSI is from neutral 50 (momentum extreme)
Status Indicators:
🔥 STRONG = Momentum > 70 (strong move happening)
📈 BUILDING = Momentum 50-70 (gaining strength)
⚠️ WEAK = Momentum 30-50 (losing steam)
💤 STALLING = Momentum < 30 (very weak/choppy)
Background Tint:
Light green background = Strong momentum (>70)
Light red background = Very weak momentum (<30)
The key is: look for STRONG reversal labels when momentum is building/strong for the best trade setups! Also this is mainly for the 4hr time frame.

Forexsebi - NASDAQ Psychological Levels - TrendflowTrendflow is an advanced TradingView indicator combining psychological price levels with trend and multi-timeframe analysis.
The indicator automatically plots psychological levels in around the current price. Each level is visualized using horizontal lines and price zones (boxes) to clearly highlight potential support and resistance areas.
Psychological Levels – Trendflow ist ein fortschrittlicher TradingView-Indikator , der wichtige psychologische Preislevel mit einer klaren Trend- und Multi-Timeframe-Analyse kombiniert.
Trend Analysis with SMAs
SMA 50 & SMA 200 plotted directly on the chart
Individually toggleable
Clear color separation for fast trend recognition
Multi-Timeframe SMA Trend Table
Trend status (BULLISH / BEARISH / NEUTRAL) across:
5M, 15M, 1H, 4H, 1D
Logic: Price relative to SMA 50 & SMA 200
Color-coded, easy-to-read table
Info Box
Current Gold price
Nearest psychological level above and below price
Alert System
Alerts when price approaches a psychological level
User-defined alert distance

RCI4linesRCI4lines plots four Rank Correlation Index (RCI) lines in a single panel to help you read momentum and trend conditions at a glance.
It shows two short-term RCIs (default: 7 and 9), a middle-term RCI (26), and a long-term RCI (52).
The script also draws shaded threshold zones between +80 to +95 and -80 to -95, making it easier to spot potential overbought / oversold areas and compare short-term moves with the bigger trend.
Useful for scalping to day trading, and for checking whether short-term momentum is aligned with mid/long-term direction.

Parabolic SAR (PSAR) - Basit//@version=5
indicator("Parabolic SAR (PSAR) - Basit", overlay=true)
start = input.float(0.02, "Start (Step)", step=0.01)
increment = input.float(0.02, "Increment", step=0.01)
maximum = input.float(0.2, "Maximum", step=0.01)
showDots = input.bool(true, "Dotları Göster")
showLine = input.bool(false, "PSAR Çizgisi Göster")
bgTrend = input.bool(true, "Arka planı trende göre renklendir")
psar = ta.sar(start, increment, maxim
bull = close > psar
bear = close < psar
psarColor = bull ? color.green : color.
plot(showLine ? psar : na, title="PSAR Line", color=psarColor, linewi
plotshape(showDots and bull, title="PSAR Bull Dot", location=location.belowbar, style=shape.circle, size=size.tiny, color=color.green)
plotshape(showDots and bear, title="PSAR Bear Dot", location=location.abovebar, style=shape.circle, size=size.tiny, color=color.red)
bgcolor(bgTrend ? (bull ? color.new(color.green, 90) : color.new(color.red, 90)) : n
buySignal = ta.crossover(close, psar)
sellSignal = ta.crossunder(close, psa
plotshape(buySignal, title="AL Sinyali", location=location.belowbar, style=shape.triangleup, size=size.small, color=color.green)
plotshape(sellSignal, title="SAT Sinyali", location=location.abovebar, style=shape.triangledown, size=size.small, color=color.red)
alertcondition(buySignal, title="AL (PSAR flip)", message="PSAR flip: AL sinyali")
alertcondition(sellSignal, title="SAT (PSAR flip)", message="PSAR flip: SAT sinyali")

ZLSMA//@version=5
indicator("T3 Al-Sat Sinyalli", overlay=true, shorttitle="T3 Signal")
// Kullanıcı ayarları
length = input.int(14, minval=1, title="Periyot")
vFactor = input.float(0.7, minval=0.0, maxval=1.0, title="Volatility Factor (0-1)")
// EMA hesaplamaları
ema1 = ta.ema(close, length)
ema2 = ta.ema(ema1, length)
ema3 = ta.ema(ema2, length)
// T3 hesaplaması
c1 = -vFactor * vFactor * vFactor
c2 = 3 * vFactor * vFactor + 3 * vFactor * vFactor * vFactor
c3 = -6 * vFactor * vFactor - 3 * vFactor - 3 * vFactor * vFactor * vFactor
c4 = 1 + 3 * vFactor + vFactor * vFactor * vFactor + 3 * vFactor * vFactor
t3 = c1 * ema3 + c2 * ema2 + c3 * ema1 + c4 * close
// T3 çizimi
plot(t3, color=color.new(color.blue, 0), linewidth=2, title="T3")
// Mum renkleri
barcolor(close > t3 ? color.new(color.green, 0) : color.new(color.red, 0))
// Al-Sat sinyalleri
buySignal = ta.crossover(close, t3)
sellSignal = ta.crossunder(close, t3)
// Okları çiz
plotshape(buySignal, title="Al", location=location.belowbar, color=color.green, style=shape.triangleup, size=size.small)
plotshape(sellSignal, title="Sat", location=location.abovebar, color=color.red, style=shape.triangledown, size=size.small)

Heikin-Ashi Bar & Line with Signals//@version=6
indicator("Heikin-Ashi Bar & Line with Signals", overlay=true)
// Heikin-Ashi hesaplamaları
var float haOpen = na // İlk değer için var kullanıyoruz
haClose = (open + high + low + close) / 4
haOpen := na(haOpen) ? (open + close)/2 : (haOpen + haClose )/2
haHigh = math.max(high, haOpen, haClose)
haLow = math.min(low, haOpen, haClose)
// Renkler
haBull = haClose >= haOpen
haColor = haBull ? color.new(color.green, 0) : color.new(color.red, 0)
// HA Barları
plotcandle(haOpen, haHigh, haLow, haClose, color=haColor, wickcolor=haColor)
// HA Line
plot(haClose, title="HA Close Line", color=color.yellow, linewidth=2)
// Trend arka planı
bgcolor(haBull ? color.new(color.green, 85) : color.new(color.red, 85))
// Al/Sat sinyalleri
longSignal = haBull and haClose > haOpen and haClose < haOpen
shortSignal = not haBull and haClose < haOpen and haClose > haOpen
plotshape(longSignal, title="Al Sinyali", style=shape.triangleup, location=location.belowbar, color=color.green, size=size.small)
plotshape(shortSignal, title="Sat Sinyali", style=shape.triangledown, location=location.abovebar, color=color.red, size=size.small)

Unsurpassed Close LevelsThis indicator identifies and visually highlights previous candle close prices that have not yet been surpassed by any subsequent higher high — creating dynamic horizontal resistance levels based purely on closing prices.
How it works:
For every confirmed candle, a dashed horizontal ray is drawn from its close price extending to the right.
The ray remains visible as long as no future candle's high reaches or exceeds that previous close level.
As soon as price makes a new high that touches or surpasses the level, the ray is automatically removed.
Duplicate levels (exact same close price already active) are skipped to keep the chart clean.
A built-in limit of 50 active levels prevents overload on very long timeframes.
Use cases:
Spot potential resistance zones formed by previous closes that price has failed to reclaim on the upside.
Helpful in downtrends or ranging markets to visualize "overhead supply" levels where sellers previously stepped in at the close.
Great complement to traditional swing highs or supply/demand zones — focuses exclusively on close-based resistance.
Works on any timeframe and any instrument.
Visuals:
Dashed red horizontal rays extending right from unsurpassed closes.
Clean and lightweight — lines disappear automatically when invalidated.
Simple, effective, and fully automatic. No inputs required.
Feel free to customize the color, style, or max levels count in the code if desired.
EMA Color Cross + Trend Arrows V6//@version=5
indicator("EMA Color Cross + Trend Arrows V6", overlay=true, max_bars_back=500)
// === Inputs ===
fastLen = input.int(9, "Hızlı EMA")
slowLen = input.int(21, "Yavaş EMA")
// === EMA Hesapları ===
emaFast = ta.ema(close, fastLen)
emaSlow = ta.ema(close, slowLen)
// Trend Yönü
trendUp = emaFast > emaSlow
trendDown = emaFast < emaSlow
// === Çizgi Renkleri ===
lineColor = trendUp ? color.new(color.green, 0) : color.new(color.red, 0)
// === EMA Çizgileri (agresif kalın) ===
plot(emaFast, "Hızlı EMA", lineColor, 4)
plot(emaSlow, "Yavaş EMA", color.new(color.gray, 70), 2)
// === Ok Sinyalleri ===
buySignal = ta.crossover(emaFast, emaSlow)
sellSignal = ta.crossunder(emaFast, emaSlow)
// Büyük Oklar
plotshape(buySignal, title="AL", style=shape.triangleup, color=color.green, size=size.large, location=location.belowbar)
plotshape(sellSignal, title="SAT", style=shape.triangledown, color=color.red, size=size.large, location=location.abovebar)
// === Trend Bar Color ===
barcolor(trendUp ? color.green : color.red)

EMA Color Cross + Trend Bars//@version=5
indicator("EMA Color Cross + Trend Bars", overlay=true)
// EMA ayarları
shortEMA = input.int(9, "Short EMA")
longEMA = input.int(21, "Long EMA")
emaShort = ta.ema(close, shortEMA)
emaLong = ta.ema(close, longEMA)
// Trend yönü
trendUp = emaShort > emaLong
trendDown = emaShort < emaLong
// EMA çizgileri trend yönüne göre renk değiştirsin
plot(emaShort, color=trendUp ? color.green : color.red, linewidth=2)
plot(emaLong, color=trendUp ? color.green : color.red, linewidth=2)
// Barları trend yönüne göre renklendir
barcolor(trendUp ? color.green : color.red)
// Kesişim sinyalleri ve oklar
longSignal = ta.crossover(emaShort, emaLong)
shortSignal = ta.crossunder(emaShort, emaLong)
plotshape(longSignal, title="Long", style=shape.triangleup, location=location.belowbar, color=color.green, size=size.large)
plotshape(shortSignal, title="Short", style=shape.triangledown, location=location.abovebar, color=color.red, size=size.large)

Pair Creation🙏🏻 The one and only pair construction tech you need, unlike others:
Applies one consistent operation to all the data features (not only prices). Then, the script outputs these, so you can apply other calculations on these outputs.
calculates a very fast and native volatility based hedge ratio, that also takes into account point value (think SPY vs ES) so you can easily use it in position sizing
Has built-in forward pricing aka cost of carry model , so you can de-drift pairs from cost of carry, discover spot price of oil based on futures, and ofc find arbitrage opportunities
Also allows to make a pair as a product of 2 series, useful for triangular arbitrage
This script can make a pair in 2 ways:
Ratio, by dividing leg 1 by leg 2
Product, by multiplying leg 1 by leg 2
The real mathematically right way to construct a pair is a ratio/product (Spreads are in fact = 2 legged portfolio, but I ain't told ya that ok). Why? Because a pair of 2 entities has a mathematically unique beauty, it allows direct comparisons and relationship analysis, smth you can't do directly with 3 and more components.
Multiplication (think inversions like (EURUSD -> USDEUR), and use cases for triangular arbitrage) is useful sometimes too.
...
Quickguide:
First, "Legs" are pair components: make a pair of related assets. Don’t be guided exclusively by clustering, cointegrations, mutual information etc. Common sense and exogenous info can easily made them all Forward pricing model: is useful when u work with spot vs futures pairs. Otherwise: put financing, storage and yield all on zeros, this way u will turn it off and have a pure ratio/product of 2 legs.
Look at the 2 numbers on the script’s status line: the first one would always be 1), and the second one is a variable.
First number (always 1) is multiplier for your position size on leg 1
The second number is the multiplier for your position size on leg 2 in the opposite direction.
If both legs are related, trading your sizes with these multipliers makes you do statistical arbitrage -> trading ~ volatility in risk free mode, while the relationship between the assets is still in place.
Also guys srsly, nobody ‘ever’ made a universal law that somewhy somehow for whatever secret conspiracy reason one shall only trade pairs in mean reverting style xd. You can do whatever you want:
Tilt hedge ratio significantly based on relative strength of legs
Trade the pair in momentum style
Ignore hedge ratio all together
And more and more, the limit is your imagination, e.g.:
Anticipate hedge ratio changes based on exogenous info and act accordingly
Scalp a pair just like any other asset
Make a pair out of 2 pairs
Like I mean it, whatever you desire
About forward pricing model:
It’s applied only to leg 2;
Direct: takes spot price and finds out implied futures price
Inverse: takes futures price and finds out implied spot price (try on oil)
Pls read online how to choose parameters, it’s open access reliable info
About the hedge ratio I use:
You prolly noticed the way I prefer to use inferred volumes vs the “real” ones. In pairs it’s especially meaningful, because real volumes lose sense in pair creation. And while volumes are closely tied to volatility, the inferred volumes ‘Are’ volatility irl (and later can be converted to currency space by using point value, allowing direct comparisons symbol vs symbol).
This hedge ratio is a good example of how discovering the real nature of entities beats making 100s of inventions, why domain knowledge and proper feature engineering beats difficult bulky models, neural networks etc. How simple data understanding & operations on it is all you need.
This script simply does this:
Takes inferred volume delta of both assets, makes a ratio, normalizes it by tick sizes and points values of both legs, calculates a typical value of this series.
That’s it, no step 2, we’re done. No Kalman filters, no TLS regression, no vine copulas, or whatever new fancy keywords you can come up with etc.
...
^^ comparing real ES prices vs theoretical ones by forward-pricing model. Financing: 0.04, yield 0.0175
^^ EURUSD, 6E futures with theoretical futures price calculated with interest rate differential 0.02 (4% USD - 2% EUR interest rates)
^^4 different pairs (RTY/ES, YM/ES, NQ/ES, ES/ZN) each with different plot style (pick one you like in script's Style settings)
^^ YM/RTY pair, each plot represents ratio of different features: ratio of prices, ratio of inferred volume deltas, ratio of inferred volumes, ratio of inferred tick counts (also can be turned on/off in Style settings)
...
How can u upgrade it and make a step forward yourself:
On tradingview missing values are automatically fixed by backfilling, and this never becomes a thing until you hit high frequency data. You can do better and use Kalman filter for filling missing values.
Script contains the functions I use everywhere to calculate inferred volume delta, inferred volume, and inferred tick count.
...
∞

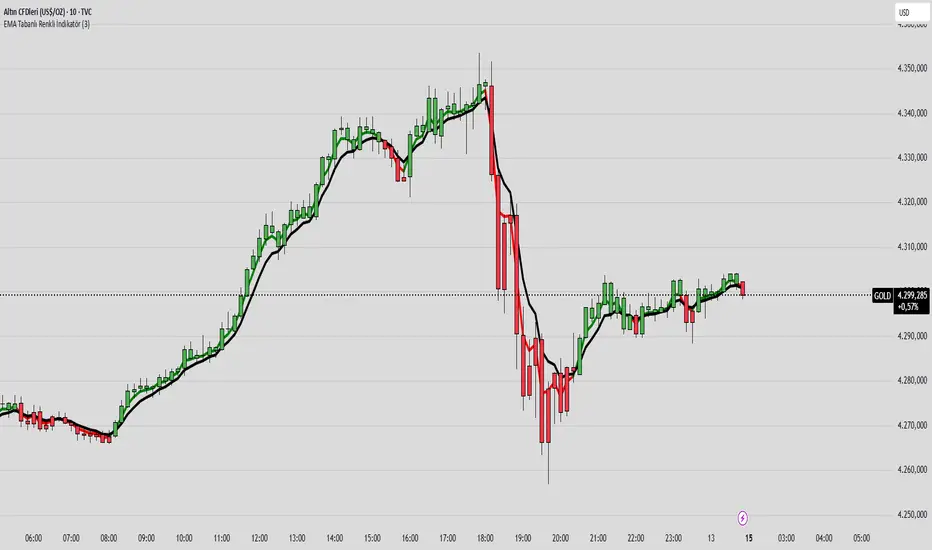
EMA COLOR BUY SELL
indicator("EMA Tabanlı Renkli İndikatör", overlay=true)
emaLength = input.int(21, "EMA Periyodu")
fastEMA = ta.ema(close, emaLength)
slowEMA = ta.ema(close, emaLength * 2)
trendUp = fastEMA > slowEMA
trendDown = fastEMA < slowEMA
barcolor(trendUp ? color.new(color.green, 0) : trendDown ? color.new(color.red, 0) : color.gray)
plot(fastEMA, color=trendUp ? color.green : color.red, title="Fast EMA", linewidth=2)
plot(slowEMA, color=color.blue, title="Slow EMA", linewidth=2)
Magical Thirteen Turns - The Greedy SnakeThe number 9 appears:
Meaning: Warning signal. The rise may encounter resistance and a cautious pullback is about to begin.
Operation: Consider reducing your holdings (selling a portion) to lock in profits and avoid experiencing wild fluctuations.
The number 13 appears:
Meaning: Strong sell signal. The upward momentum is likely to be exhausted, which is also known as "bull exhaustion".
Operation: It is recommended to liquidate your positions or significantly reduce them. Short sell (if you are trading contracts).

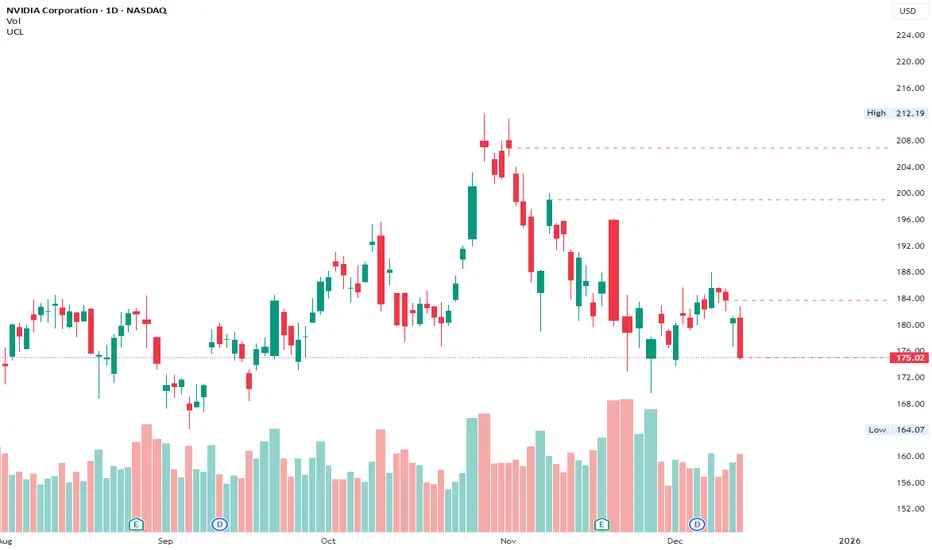
Trinity Real Move Detector DashboardRelease Notes (critical)
1. This code "will" require tweaks for different timeframes to the multiplier, do not assume the data in the table is accurate, cross check it with the Trinity Real Move Detector or another ATR tool, to validate the values in the table and ensure you have set the correct values.
2. I mention this below. But please understand that pine code has a limitation in the number of security calls (40 request.security() calls per script). This code is on the limit of that threshold and I would encourage developers to see if they can find a way around this to improve the script and release further updates.
What do we have...
The Trinity Real Move Detector Dashboard is a powerful TradingView indicator designed to scan multiple assets at once and show when each one has genuine short-term volatility "energy" — the kind that makes directional options trades (especially 0DTE or short-dated) have a high probability of follow-through, and can be used for swing trading as well. It combines a simple ATR-based volatility filter with a SuperTrend-style bias to tell you not only if the market is "awake" but also in which direction the momentum is leaning.
At its core, the indicator calculates the current ATR on your chosen timeframe and compares it to a user-defined percentage of the asset's daily ATR. When the short-term ATR spikes above that threshold, it signals "enough energy" — meaning the underlying is moving with real force rather than choppy noise. The SuperTrend logic then determines bullish or bearish bias, so the status shows "BULLISH ENERGY" (green) or "BEARISH ENERGY" (red) when energy is on, or "WAIT" when it's not. It also counts how many bars the energy has been active and shows the current ATR vs threshold for quick visual confirmation.
The dashboard displays all this in a clean table with columns for Symbol, Multiplier, Current ATR, Threshold, Status, Bars Active, and Bias (UP/DOWN). It's perfect for 3-minute charts but works on any timeframe — just adjust the multiplier based on the hints in the settings.
Editing symbols and multipliers is straightforward and user-friendly. In the indicator settings, you'll see numbered inputs like "1. Symbol - NVDA" and "1. Multiplier". To change an asset, simply type the new ticker in the symbol field (e.g., replace "NVDA" with "TSLA", "AVGO", or "ADAUSD"). You can also adjust the multiplier for each asset individually in the corresponding "Multiplier" field to make it more or less sensitive — lower numbers give more signals, higher numbers give stricter, higher-quality ones. This lets you customize the dashboard to your watchlist without any coding. For example, if you switch to a 4-hour chart or a slower-moving stock like AVGO, you may need to raise the multiplier (e.g., to 0.3–0.4) to avoid false "bullish" signals during minor bounces in a larger downtrend.
One important note about the multiplier and timeframes: the default values are optimized for fast intraday charts (like 3-minute or 5-minute). On higher timeframes (15-minute, 1-hour, 4-hour, or daily), the SuperTrend bias can be too sensitive with low multipliers (1.0 default in the code), leading to situations like the AVGO 4-hour example — where price is clearly downtrending, but the dashboard shows "BULLISH ENERGY" because the tight bands flip on small bounces. To fix this, you need to manually increase the multiplier for that asset (or all assets) in the settings. For 4-hour or daily charts, 0.25–0.35 is often better to match smoother SuperTrend indicators like Trinity. Always test on your timeframe and asset — crypto usually needs slightly lower multipliers than stocks due to higher volatility.
TradingView has a hard limit of 40 request.security() calls per script. Each asset in the dashboard requires several calls (current ATR, daily ATR, SuperTrend components, etc.), so with the full ATR-based bias, you can safely monitor about 6–8 assets before hitting the limit. Adding more symbols increases the number of calls and will trigger the "too many securities" error. This is a platform restriction to prevent excessive server load, and there's no official way around it in a single script. Some advanced coders use tricks like caching or lower-timeframe requests to squeeze in a few more, but for reliability, sticking to 6–8 assets is recommended. If you need more, the common workaround is to create two separate indicators (e.g., one for stocks, one for crypto) and add both to the same chart.
Overall, this dashboard gives you a professional-grade multi-asset scanner that filters out low-energy noise and highlights real momentum opportunities across stocks and crypto — all in one glance. It's especially valuable for options traders who want to avoid theta decay on weak moves and only strike when the market has true fuel. By tweaking the per-symbol multipliers in the settings, you can perfectly adapt it to any timeframe or asset behavior, avoiding issues like the AVGO false bullish signal on higher timeframes.

Neosha Concept V4 (NY Time)
Imagine the financial market as a huge ocean. Millions of traders throw orders into it every second. But beneath all the noise, there is a powerful current that quietly controls where the waves move. That current is not a person, not a trader, and not random—it is an algorithm.
This algorithm is called the Interbank Price Delivery Algorithm (IPDA).
Think of it as the “navigation system” that guides price through the market.
IPDA has one job:
to move prices in a way that keeps the market efficient and liquid.
To do this, it constantly looks for two things:
1. Where liquidity is hiding
Liquidity is usually found above highs and below lows—where traders place stop losses. The algorithm moves price there first to collect that liquidity.
2. Where price became unbalanced
Sometimes price moves too fast and creates gaps or imbalances. IPDA returns to those areas later to “fix” the missing orders.
Once you start looking at the charts with this idea in mind, everything makes more sense:
Why price suddenly spikes above a high and crashes down
Why big moves leave gaps that price later fills
Why the market reverses right after taking stops
Why trends begin only after certain levels are hit
These are not accidents.
They are the algorithm doing its job.
Price moves in a repeating cycle:
Gather liquidity
Make a strong move (displacement)
Return to fix inefficiency
Deliver to the next target
Most beginners only see the candles.
But once you understand IPDA, you see the intention behind the candles.
Instead of guessing where price might go, you begin to understand why it moves there.
And once you understand the “why,” your trading becomes clearer, calmer, and far more accurate.

RSI WMA Crossover Momentum w/ HighlightRSI WMA Crossover Momentum
This is a momentum indicator that tracks the RSI. Its principle is to use the WMA line to determine the trend of the RSI, and from the RSI, the price trend can be determined.

Hicham tight/wild rangeHere’s a complete Pine Script indicator that draws colored boxes around different types of ranges!
Main features:
📦 Types of ranges detected:
Tight Range (30–60 pips): Gray boxes
Wild Range (80+ pips): Yellow boxes

X-trend Volume Anomaly 📊 X-TREND Volume Anomaly: Advanced VSA Analysis
Effective market analysis requires understanding the relationship between Price Action and Volume. X-Trend Volume Anomaly is a technical instrument that simplifies Volume Spread Analysis (VSA) into a clear, visual system. It allows traders to instantly decode the footprint of "Smart Money" by analyzing the correlation between Relative Volume (RVOL) and Candle Range.
The algorithm automatically classifies market behavior into three distinct states:
1. 🟢🔴 Impulse (Trend Validation)
Logic: High Relative Volume + High Price Range.
Interpretation: Represents genuine market intent. Institutional aggregators are aggressively pushing price. This confirms the validity of a breakout or trend continuation.
2. 🟠 Absorption / Churn (Reversal Warning)
Logic: Ultra-High Relative Volume + Low Price Range (Doji, Pin-bar).
Interpretation: The critical signal. This indicates a major divergence between Effort (Volume) and Result (Price Movement). Large players are absorbing liquidity via limit orders, halting the trend. This is often a precursor to an immediate reversal. (See the Orange candle in the chart examples).
3. 👻 Ghost Mode (Noise Reduction)
Logic: Candles with low/insignificant volume are rendered in a transparent gray scale.
Utility: Eliminates visual noise, allowing the trader to focus exclusively on significant liquidity events and institutional activity.
⚙️ SYSTEM SYNERGY
While this indicator provides robust standalone volume analysis, it is engineered to function as the Volume Confirmation Layer within the X-Trend Ecosystem. For a complete institutional trading setup, we recommend pairing this tool with:
X-Trend Reversal (PRO): For precise, non-repainting entry signals.
X-Trend Liquidation Heatmap: For identifying high-probability price targets.

MP SESSIONS, DST, OTTMP SESSIONS, DST, OTT – What this indicator does
This script is a multi-session market timing tool that:
Draws full trading sessions on the chart (Asia, Sydney, Tokyo, Shanghai, Europe, London, New York, NYSE)
Automatically adjusts for Daylight Saving Time (DST) for Sydney, London, and New York
Shows a live info table with session times, DST status, and whether each session is currently open or closed
Adds optional custom “OTT” vertical lines at user-defined intraday times (for your own models, killzones, or time blocks)
Main Features (high level)
1. Market mode & time zone handling
Market Mode:
Forex
Stock
User Custom (you type your own session ranges)
TFlab suggestion (predefined “optimized” session times)
Time Zone Mode:
UTC
Session Local Time (local exchange time: Sydney, Tokyo, London, New York etc.)
Your Time Zone (converts to the user-selected TZ, e.g. UTC-4:00)
Handles separate time zones for:
Asia, Sydney, Tokyo, Shanghai, Europe, London, New York, NYSE
Has logic to recalculate session start/end depending on DST and the chosen mode.
2. Daylight Saving Time (DST) engine
The function DST_Detector:
Calculates when DST starts and ends for:
Australia/Sydney
Europe/London
America/New_York
Detects the correct Sunday (2nd, 4th, etc.) for start/end using day-of-week and week counts.
Returns 'Active' or 'Inactive' for each region.
These values are then used to shift the sessions (e.g. New York 13:00–21:00 vs 12:00–20:00 in UTC).
The script can also draw vertical lines on the chart when DST starts/ends and label them:
“Sydney DST Started / Ended”
“London DST Started / Ended”
“New York DST Started / Ended”
3. Session timing & sessions on the chart
The function Market_TimeZone_Calculator:
Based on Market Mode + Time Zone Mode + DST state, it returns:
Time ranges for: Sydney, Tokyo, Shanghai, Asia (combined), Europe, London, New York, NYSE
These ranges are in "HHMM-HHMM" format.
Then the script:
Converts these to time() conditions using the proper time zone
Creates boolean series like On_sesAsia, On_sesEurope, On_sesNewYork, etc., which are 1 when the session is open and 0 when closed.
4. Session high/low boxes & labels
The function LowHighSessionDetector:
Tracks high and low of each session while it’s active.
When a new session starts:
Resets and starts recording the session high/low.
While session is active:
Updates High with the max of current bar high and previous session high.
Updates Low with the min of current bar low and previous session low.
When the session is "on":
Draws a box from session low to high (box.new) and extends it to the right as long as the session continues.
Places a label with session name (Asia, London, New York, etc.) near the high:
Style depends on the session (down/right/left).
You have visibility toggles per session:
Asia Session, Sydney Session, Tokyo Session, Shanghai Session, Europe Session, London Session, New York Session, NYSE (for TFlab mode).
So you visually see:
A shaded box for each session
The full H/L range for that session
A text label with the session name.
5. Info table
The indicator builds a table in a corner of the chart showing:
Header:
“FOREX Session”, “Stock Market Trading Hours”, “User Custom Session”, or “TFlab suggestion” depending on mode.
Columns:
Session name (Asia, Sydney, Tokyo, Shanghai, Europe, London, New York, NYSE)
DST status for that region (“Active 🌞 / Inactive 🍂 / Not Observed”)
Session start time
Session end time
Current status (“Open / Closed”, with green/red background)
The function SplitFunction:
Parses the "HHMM-HHMM" strings for each session.
Converts them into:
Either raw times (if viewing in UTC/session local)
Or converted times in Your Time Zone using timestamp and hour/ minute with YourTZ.
Returns formatted Start and End strings like 9:30, 13:00, etc.
So the table is effectively a live session schedule that:
Auto-adjusts to DST
Can show times in your own time zone
Shows which session is open right now.
6. OTT vertical lines (custom intraday markers)
At the bottom, there is an OTT section which lets you draw up to three sets of vertical lines at specific times:
Each OTT block has:
Enable toggle (Enable OTT 1/2/3)
Start hour & minute
End hour & minute
Color
Global OTT settings:
Line style: Solid / Dashed / Dotted
Line width
Toggle: “Show OTT Labels?”
Logic:
is_ott_time() checks if current bar’s hour and minute match the OTT input time.
draw_ott():
When the bar time matches, draws a vertical line through the candle from low to high (extend.both).
Optionally adds a label above the bar, like "OTT1 Start", "OTT1 End", etc.
Use cases:
Marking open/close of your trading session
Defining killzones, news times, or custom model windows
Visual anchors for your intraday routine (NY open, 10 AM candle, etc.)

Renko Average Bricks This indicator calculates the average RENKO brick streaks. Streaks=consecutive bricks of the same color. EX. G= 1 streak of 1. GGG = 1 streak of 3. RR 1 streak of 2. Single bricks count. There is the option for look back period which can be changed but Defaults to 50. Calculates the last 50 completed green streaks and then averages them. Same with red streaks. Only closed bricks count.
Very Simple and can be used for targets, ect.
Cheers

VX Levels and Ranch Ranges with SPY/SPX price converterThis is a indicator for all Vexly subscribers to plot the following:
1. Plot SPY/SPX levels on your ES chart. Or QQQ levels on your NQ chart
2. VX levels obtained from vx_levels command. SPY on ES chart and QQQ on NQ chart
3. Ranch Range levels from the discord channel for ES and NQ chart.
You can enable/disable any of them at your discretion.

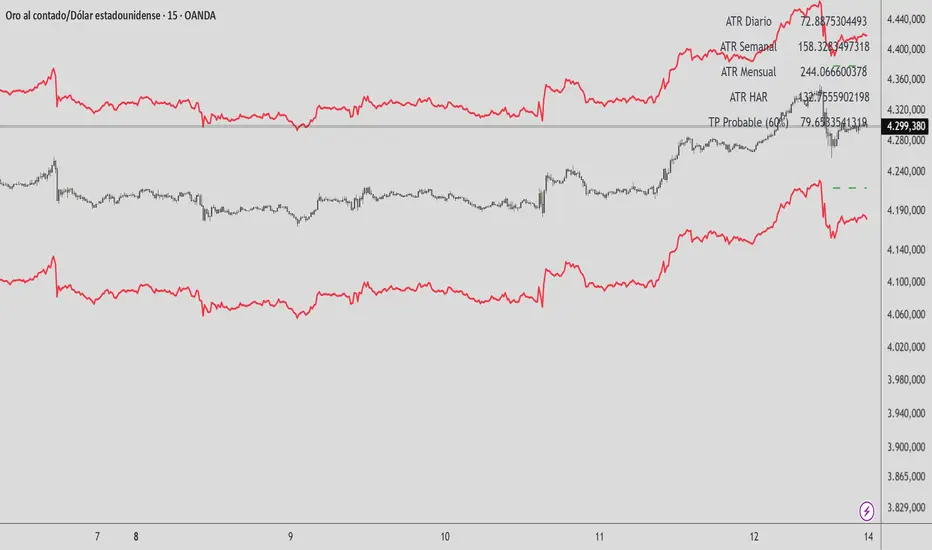
HAR Volatility ATR v1.0 (Andreus Villalobos)
Indicator based on the HAR (Hyper-Realized Volatility) model.
Combines daily, weekly, and monthly ATRs to project:
– Most probable price range (90%)
– Most probable take profit (60%)
Does not generate entry signals.
Designed for use in conjunction with:
market structure, liquidity, and price action.
Works on Forex, Indices, Gold, and Cryptocurrencies.
Advanced Rainbow EMA + SMMA SystemAdvanced Rainbow EMA + SMMA System
This custom indicator overlays eight rainbow‑colored EMAs (20, 25, 30, 35, 40, 45, 50, 55) together with two Smoothed Moving Averages (SMMA 50 in white, SMMA 200 in red).
Features:
🌈 Rainbow EMAs: Smooth gradient from yellow → gold → orange → dark orange → tomato → crimson → red → blue, showing short‑ to medium‑term momentum.
⚪🔴 Smoothed Moving Averages: Thick white SMMA (50) and thick red SMMA (200) for long‑term trend context.
🟩🟥 Background shading: Green when EMAs align bullish and SMMA 50 > SMMA 200, red when bearish.
📈📉 Signal arrows: “BUY” labels on Golden Cross (SMMA 50 crossing above SMMA 200), “SELL” labels on Death Cross (SMMA 50 crossing below SMMA 200).
🔔 Alerts: Built‑in TradingView alerts for Golden/Death Cross and for strong bullish/bearish EMA alignment.
Use case: This tool helps traders quickly visualize short‑term momentum against long‑term smoothed trend direction. It highlights strong trending conditions, potential reversals, and crossover signals, making it suitable for swing trading, trend following, and confirmation of entries/exits.
