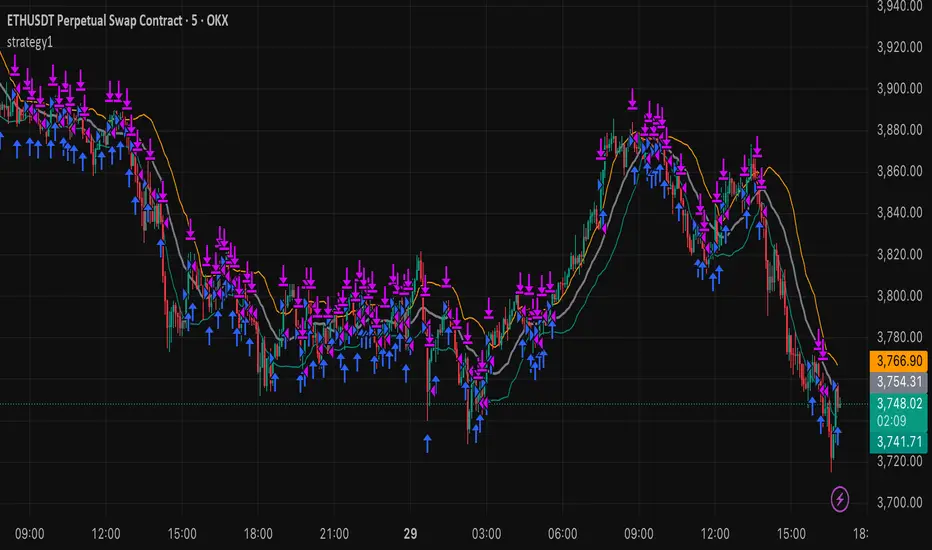
Setup: Smooth Gaussian + Adaptive Supertrend (Manual Vol)Overview
This strategy combines two powerful trend-based tools originally developed by Algo Alpha: the Smooth Gaussian Trend (simulated) and the Adaptive Supertrend. The objective is to capture sustained bullish movements in periods of controlled volatility by filtering for high-probability entries.
Entry Logic
Long Entry Conditions:
The closing price is above the Smooth Gaussian Trend line (with length = 75), and
The volatility setting from the Adaptive Supertrend is manually defined as either 2 or 3
Exit Condition:
The closing price falls below the Smooth Gaussian Trend line
This script uses a simulated version of the Gaussian Trend line via double-smoothed SMA, as the original Algo Alpha indicator is protected and cannot be accessed directly in code.
Features
Plots entry and exit signals directly on the chart
Manual toggle to enable or disable the volatility filter
Lightweight design to allow flexible backtesting even without access to proprietary indicators
Important Note
This strategy does not connect to the actual Adaptive Supertrend from Algo Alpha. Users must manually input the volatility level based on what they observe on the chart when the original indicator is also applied. The Smooth Gaussian Trend is approximated and may differ slightly from the original.
Suggested Use
Recommended timeframes: 1H, 4H, or Daily
Best used alongside the original indicators displayed on the chart
Consider incorporating additional structure, momentum, or volume filters to enhance performance
If you have suggestions or would like to contribute improvements, feel free to reach out or fork the script.
Indicators and strategies

Supertrend Long-Only Strategy for QQQThis strategy is meant to use Micro Momentum to give good Buy and Sell signals in trending markets

Long and Short Strategy with Multi Indicators [B1P5]Long and Short Strategy with RSI, ROC, MA Selection, Exit Visualization, and Strength Indicator

Intraday Combo Strategy HHStochastic RSI Momentum/Reversal quickly identifies overbought/oversold zones
MACD Momentum/Trend confirms a trend reversal, a late but powerful signal
Supertrend Trend Tracking provides clear and concise buy/sell signals
Bollinger Bands Volatility shows price deviation during breakouts/squeezes
ADX Trend Strength measures trend strength to filter out false signals

Open Close Cross Strategy R5 Delay//@version=5
//
strategy(title='Open Close Cross Strategy R5.1 revised by JustUncleL', shorttitle='OCC Strategy R5.1', overlay=true, pyramiding=0, default_qty_type=strategy.percent_of_equity, default_qty_value=10, calc_on_every_tick=false)
//
// Revision: 5
// Original Author: @JayRogers
// Revision Author: JustUncleL revisions 3, 4, 5
//
// *** USE AT YOUR OWN RISK ***
// - There are drawing/painting issues in pinescript when working across resolutions/timeframes that I simply
// cannot fix here.. I will not be putting any further effort into developing this until such a time when
// workarounds become available.
// NOTE: Re-painting has been observed infrequently with default settings and seems OK up to Alternate
// multiplier of 5.
// Non-repainting mode is available by setting "Delay Open/Close MA" to 1 or more, but the reported
// performance will drop dramatically.
//
// R5.1 Changes by JustUncleL
// - Upgraded to Version 3 Pinescript.
// - Added option to select Trade type (Long, Short, Both or None)
// - Added bar colouring work around patch.
// - Small code changes to improve efficiency.
// - NOTE: To enable non-Repainting mode set "Delay Open/Close MA" to 1 or more.
// 9-Aug-2017
// - Correction on SuperSmooth MA calculation.
//
// R5 Changes by JustUncleL
// - Corrected cross over calculations, sometimes gave false signals.
// - Corrected Alternate Time calculation to allow for Daily,Weekly and Monthly charts.
// - Open Public release.
// R4 Changes By JustUncleL
// - Change the way the Alternate resolution in selected, use a Multiplier of the base Time Frame instead,
// this makes it easy to switch between base time frames.
// - Added TMA and SSMA moving average options. But DEMA is still giving the best results.
// - Using "calc_on_every_tick=false" ensures results between backtesting and real time are similar.
// - Added Option to Disable the coloring of the bars.
// - Updated default settings.
//
// R3 Changes by JustUncleL:
// - Returned a simplified version of the open/close channel, it shows strength of current trend.
// - Added Target Profit Option.
// - Added option to reduce the number of historical bars, overcomes the too many trades limit error.
// - Simplified the strategy code.
// - Removed Trailing Stop option, not required and in my opion does not work well in Trading View,
// it also gives false and unrealistic performance results in backtesting.
//
// R2 Changes:
// - Simplified and cleaned up plotting, now just shows a Moving Average derived from the average of open/close.
// - Tried very hard to alleviate painting issues caused by referencing alternate resolution..
//
// Description:
// - Strategy based around Open-Close Crossovers.
// Setup:
// - I have generally found that setting the strategy resolution to 3-4x that of the chart you are viewing
// tends to yield the best results, regardless of which MA option you may choose (if any) BUT can cause
// a lot of false positives - be aware of this
// - Don't aim for perfection. Just aim to get a reasonably snug fit with the O-C band, with good runs of
// green and red.
// - Option to either use basic open and close series data, or pick your poison with a wide array of MA types.
// - Optional trailing stop for damage mitigation if desired (can be toggled on/off)
// - Positions get taken automagically following a crossover - which is why it's better to set the resolution
// of the script greater than that of your chart, so that the trades get taken sooner rather than later.
// - If you make use of the stops, be sure to take your time tweaking the values. Cutting it too fine
// will cost you profits but keep you safer, while letting them loose could lead to more drawdown than you
// can handle.
// - To enable non-Repainting mode set "Delay Open/Close MA" to 1 or more.
//
// === INPUTS ===
useRes = input(defval=true, title='Use Alternate Resolution?')
intRes = input(defval=3, title='Multiplier for Alernate Resolution')
stratRes = timeframe.ismonthly ? str.tostring(timeframe.multiplier * intRes, '###M') : timeframe.isweekly ? str.tostring(timeframe.multiplier * intRes, '###W') : timeframe.isdaily ? str.tostring(timeframe.multiplier * intRes, '###D') : timeframe.isintraday ? str.tostring(timeframe.multiplier * intRes, '####') : '60'
basisType = input.string(defval='SMMA', title='MA Type: ', options= )
basisLen = input.int(defval=8, title='MA Period', minval=1)
offsetSigma = input.int(defval=6, title='Offset for LSMA / Sigma for ALMA', minval=0)
offsetALMA = input.float(defval=0.85, title='Offset for ALMA', minval=0, step=0.01)
scolor = input(false, title='Show coloured Bars to indicate Trend?')
delayOffset = input.int(defval=1, title='Delay Open/Close MA (Forces Non-Repainting)', minval=0, step=1)
tradeType = input.string('BOTH', title='What trades should be taken : ', options= )
// === /INPUTS ===
// Constants colours that include fully non-transparent option.
green100 = #008000FF
lime100 = #00FF00FF
red100 = #FF0000FF
blue100 = #0000FFFF
aqua100 = #00FFFFFF
darkred100 = #8B0000FF
gray100 = #808080FF
// === BASE FUNCTIONS ===
// Returns MA input selection variant, default to SMA if blank or typo.
variant(type, src, len, offSig, offALMA) =>
v1 = ta.sma(src, len) // Simple
v2 = ta.ema(src, len) // Exponential
v3 = 2 * v2 - ta.ema(v2, len) // Double Exponential
v4 = 3 * (v2 - ta.ema(v2, len)) + ta.ema(ta.ema(v2, len), len) // Triple Exponential
v5 = ta.wma(src, len) // Weighted
v6 = ta.vwma(src, len) // Volume Weighted
v7 = 0.0
sma_1 = ta.sma(src, len) // Smoothed
v7 := na(v7 ) ? sma_1 : (v7 * (len - 1) + src) / len
v8 = ta.wma(2 * ta.wma(src, len / 2) - ta.wma(src, len), math.round(math.sqrt(len))) // Hull
v9 = ta.linreg(src, len, offSig) // Least Squares
v10 = ta.alma(src, len, offALMA, offSig) // Arnaud Legoux
v11 = ta.sma(v1, len) // Triangular (extreme smooth)
// SuperSmoother filter
// © 2013 John F. Ehlers
a1 = math.exp(-1.414 * 3.14159 / len)
b1 = 2 * a1 * math.cos(1.414 * 3.14159 / len)
c2 = b1
c3 = -a1 * a1
c1 = 1 - c2 - c3
v12 = 0.0
v12 := c1 * (src + nz(src )) / 2 + c2 * nz(v12 ) + c3 * nz(v12 )
type == 'EMA' ? v2 : type == 'DEMA' ? v3 : type == 'TEMA' ? v4 : type == 'WMA' ? v5 : type == 'VWMA' ? v6 : type == 'SMMA' ? v7 : type == 'HullMA' ? v8 : type == 'LSMA' ? v9 : type == 'ALMA' ? v10 : type == 'TMA' ? v11 : type == 'SSMA' ? v12 : v1
// security wrapper for repeat calls
reso(exp, use, res) =>
security_1 = request.security(syminfo.tickerid, res, exp, gaps=barmerge.gaps_off, lookahead=barmerge.lookahead_on)
use ? security_1 : exp
// === /BASE FUNCTIONS ===
// === SERIES SETUP ===
closeSeries = variant(basisType, close , basisLen, offsetSigma, offsetALMA)
openSeries = variant(basisType, open , basisLen, offsetSigma, offsetALMA)
// === /SERIES ===
// === PLOTTING ===
// Get Alternate resolution Series if selected.
closeSeriesAlt = reso(closeSeries, useRes, stratRes)
openSeriesAlt = reso(openSeries, useRes, stratRes)
//
trendColour = closeSeriesAlt > openSeriesAlt ? color.green : color.red
bcolour = closeSeries > openSeriesAlt ? lime100 : red100
barcolor(scolor ? bcolour : na, title='Bar Colours')
closeP = plot(closeSeriesAlt, title='Close Series', color=trendColour, linewidth=2, style=plot.style_line, transp=20)
openP = plot(openSeriesAlt, title='Open Series', color=trendColour, linewidth=2, style=plot.style_line, transp=20)
fill(closeP, openP, color=trendColour, transp=80)
// === /PLOTTING ===
//
//
// === ALERT conditions
xlong = ta.crossover(closeSeriesAlt, openSeriesAlt)
xshort = ta.crossunder(closeSeriesAlt, openSeriesAlt)
longCond = xlong // alternative: longCond ? false : (xlong or xlong ) and close>closeSeriesAlt and close>=open
shortCond = xshort // alternative: shortCond ? false : (xshort or xshort ) and close 0 ? tpPoints : na
SL = slPoints > 0 ? slPoints : na
// Make sure we are within the bar range, Set up entries and exit conditions
if (ebar == 0 or tdays <= ebar) and tradeType != 'NONE'
strategy.entry('long', strategy.long, when=longCond == true and tradeType != 'SHORT')
strategy.entry('short', strategy.short, when=shortCond == true and tradeType != 'LONG')
strategy.close('long', when=shortCond == true and tradeType == 'LONG')
strategy.close('short', when=longCond == true and tradeType == 'SHORT')
strategy.exit('XL', from_entry='long', profit=TP, loss=SL)
strategy.exit('XS', from_entry='short', profit=TP, loss=SL)
// === /STRATEGY ===
// eof

Frosty Alerts❄️ Frosty Alerts — Smart Long & Short Signals for Renko Traders
By @AutomatedMatt
Cut through market noise with Frosty Alerts — a clean, rule-based trading strategy built specifically for Renko charts. Designed for trend-following traders who value simplicity, flexibility, and automation, this tool is ideal for those seeking clarity in volatile markets.
Whether you’re trading futures, crypto, forex, or stocks, Frosty Alerts helps identify high-quality long and short opportunities with customizable logic and built-in risk management features.
🔧 Features:
✅ Designed for Renko Charts (usable on candles as well)
⚙️ Customizable Entry Logic: Choose between single or dual signal confirmation
📈 Clear Long & Short Alerts
💎 Static Take Profit & Stop Loss Options
📉 Optional Trailing Stop
📆 Daily Max Trade Limit to avoid overtrading
💬 Fully Alert-Ready: Compatible with TradingView alert automation
⚙️ Ideal For:
Renko chart traders
Trend followers
Strategy testers
Automation builders
Futures, crypto, and FX scalpers or swing traders
💡 How to Use:
Switch your chart to a Renko bar style
Load Frosty Alerts on your chart
Configure your preferred signal logic and risk settings
Set alerts directly from TradingView for hands-free trading
📬 Get Involved:
This is a free tool — no paywalls, no upsells.
If you find value in it, consider:
Subscribing to my YouTube: YouTube.com/@AutomatedMatt
❗ General Disclaimer:
This script is provided for educational purposes only. It is not financial advice. Always do your own research and manage your risk.

EMA Grid + Martingale Strategy (Long-Only) with CooldownTitle:
EMA Grid + Martingale Strategy (Long-Only) with Cooldown
Short Summary:
A long-only strategy combining EMA trend filters, grid-based entries, optional martingale sizing, and a cooldown feature to manage position timing and exits.
Full Description:
This strategy uses a 4-EMA trend confirmation system to detect bullish momentum, then deploys a grid-style entry method with optional martingale position sizing. It includes a cooldown mechanism to prevent reentry too soon after a completed trade cycle.
How It Works
1. Trend Confirmation: Two EMA groups (fast/slow) determine whether market conditions are bullish.
2. Initial Entry: A new position is entered when both EMA groups confirm an uptrend and no position is currently active.
3. Grid Entries: Additional long entries are placed when price drops by a defined pip distance from the last entry, respecting the maximum number of entries.
4. Martingale Sizing (Optional): Grid orders can increase in size with each level using a customizable multiplier.
5. Weighted-Average Exit: All positions close once price reaches or exceeds the average entry price plus a buffer.
6. Cooldown Timer: After closing a position set, the strategy waits a defined number of bars before opening a new grid.
Key Features
• 4 customizable EMAs for trend confirmation.
• Dynamic grid-style long entries based on pip intervals.
• Optional martingale-style position sizing.
• Weighted-average price exit logic with buffer control.
• Cooldown bar period to limit overtrading.
• Suitable for optimization and backtesting with full control over inputs.
Use Cases
• Designed for trending markets where pullbacks present entry opportunities.
• Helps manage staged entries while avoiding premature reentry.
• Ideal for testing martingale and grid-based strategies with exit precision.
Note: This strategy is for testing and educational purposes only. It does not guarantee profits and is not financial advice.

200 SMA (5%/-3% Buffer) for SPY & QQQ In my testing TQQQ is an absolute monster of an ETF that performs extremely well even from a buy and hold standpoint over long periods of time, its largest drawback is the massive drawdown exposure that it faces which can be easily sidestepped with this strategy.
This strategy is meant to basically abuse TQQQ's insane outperformance while augmenting the typical 200SMA strategy in a way that uses all of its strengths while avoiding getting whipsawed in sideways markets.
The strategy BUYS when price crosses 5% over the 200SMA and then SELLS when price drops 3% below the 200SMA. Between trades I'll be parking my entire account in SGOV.
So maximizing profit while minimizing risk.
You use the strategy based off of QQQ and then make the trades on TQQQ when it tells you to BUY/SELL.
Here are some reasons why I will be using this strategy:
Simple emotionless BUY and SELL signals where I don't care who the president is, what is happening in the world, who is bombing who, who the leadership team is, no attachment to individual companies and diversified across the NASDAQ.
~85% win percentage and when it does lose the loses are nothing compared to the wins and after a loss you're basically set up for a massive win in the next trade.
Max drawdown of around 53% when using TQQQ
You benefit massively when the market is doing well and when there is a recession you basically sit in SGOV for a year and then are set up for a monster recovery with a clear easy BUY signal. So as long as you're patient you win regardless of what happens.
The trades are often very long term resulting in you taking advantage of Long Term Capital Gains tax advantage which could mean saving up to 15-20% in taxes.
With only a few trades you can spend time doing other stuff and don't have to track or pay attention to anything that is happening.
Simple, easy, and massively profitable.

逆勢布林+RSI策略 for SOL可以直接套用到 SOLUSDT, SOLPERP, 或其他 SOL 合約。
在策略回測介面中選擇 5min 或 15min 看策略表現。
若要調整停利%或 RSI 數值,改變 rsi < 25 與 (shortEntryPrice - close) / shortEntryPrice >= 0.035 即可。
This can be directly applied to SOLUSDT, SOLPERP, or other SOL futures.
In the strategy backtesting interface, select 5-minute or 15-minute periods to view strategy performance.
To adjust the take-profit percentage or RSI value, set RSI < 25 and (shortEntryPrice - close) / shortEntryPrice >= 0.035.

Max Profit Min Loss Options Strategyoption when to buy and sell calls and puts indicator. it uses the rsi macd and volume indicators. it has high profit and low loses
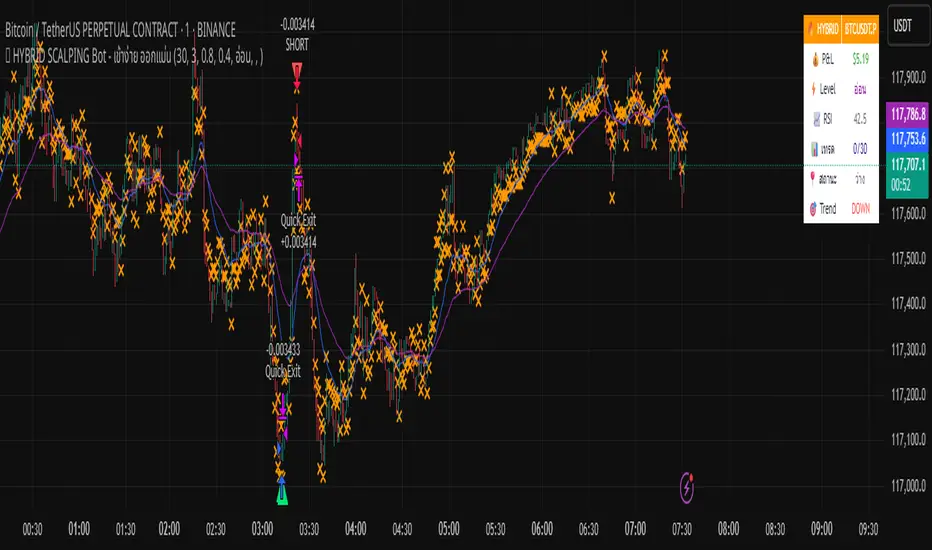
🔥 HYBRID SCALPING Bot - เข้าง่าย ออกแม่นA tool bot that helps analyze charts accurately, focusing on profits.
CE XAU/USDT Strategy📌 Auto-Trading Strategy Using CE on XAU/USDT (5M)
Indicator: CE
Parameters:
• ATR Period: 1
• ATR Multiplier: 1.85
Timeframe: 5 minutes
Instrument: Gold (XAU/USD)
🔁 Logic:
• Buy signal → Close short, open long
• Sell signal → Close long, open short
⚙️ Automation:
1. CE indicator on TradingView generates signals
2. Signals are sent via webhook to a Python bot
3. The bot opens/closes trades in MT5 accordingly
✅ Advantages:
• Full automation
• Operates 24/7 without manual intervention
⚠️ Important:
• Always test on a demo account
• Manage risk and position size properly
📌 Стратегия автоторговли по CE на XAU/USDT (5М)
Индикатор: CE
Параметры:
• ATR Period: 1
• ATR Множитель: 1.85
Таймфрейм: 5 минут
Инструмент: Золото (XAU/USD)
🔁 Логика:
• Buy сигнал → закрыть шорт, открыть лонг
• Sell сигнал → закрыть лонг, открыть шорт
⚙️ Автоматизация:
1. CE в TradingView генерирует сигналы
2. Webhook отправляет их в Python-бот
3. Бот открывает/закрывает сделки в MT5
✅ Плюсы:
• Полная автоматизация
• Работа 24/7 без вмешательства
⚠️ Важно:
• Тестируй на демо
• Управляй рисками и лотами

SwingTrade ADX Strategy v6This is a swing trading strategy that combines VWAP (Volume Weighted Average Price), ADX (Average Directional Index) for trend strength, and volume ratios to generate long/short entry and exit signals. It's designed for daily charts but can be adapted.
#### Key Features:
- **Entries**: Based on VWAP crossovers, rising/falling delta (price deviation from VWAP), ADX trend confirmation, and volume ratios.
- **Exits**: Dynamic exits when VWAP delta reverses after a peak.
- **Filters**: Optional toggles for VWAP signals, ADX, and volume. Backtest date range for custom periods.
- **Visuals**: VWAP line, signal shapes/labels, and an info panel showing key metrics (VWAP Delta %, ADX, Volume Ratio).
- **Alerts**: Built-in alerts for buy/sell entries and exits.
#### How to Use:
1. Apply to your chart (e.g., stocks, forex, crypto).
2. Adjust parameters in the settings (e.g., ADX threshold, volume period).
3. Enable/disable indicators as needed.
4. Backtest using the date filters and review equity curve.
**Disclaimer**: This is for educational purposes only. Past performance is not indicative of future results. Not financial advice—trade at your own risk. Backtest thoroughly and use with proper risk management.
Feedback welcome! If you find it useful, give it a like.

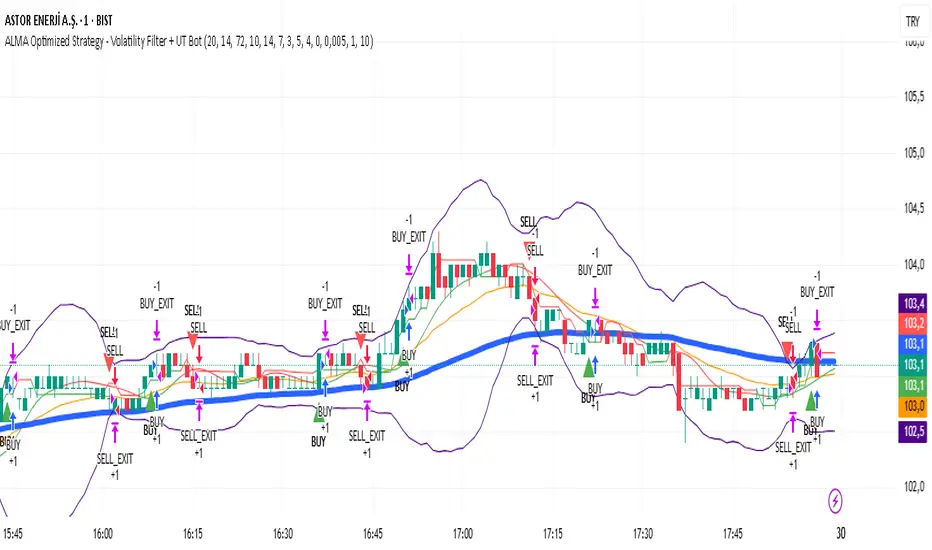
ALMA Optimized Strategy - Volatility Filter + UT BotThe strategy you provided is an ALMA Optimized Strategy implemented in Pine Script™ version 5 for TradingView. Here is a brief English summary of what it is and how it works:
It is a trend-following strategy combining multiple technical indicators to optimize trade entries and exits.
The core moving average used is the ALMA (Arnaud Legoux Moving Average), known for smoother and less lagging price smoothing compared to traditional EMAs or SMAs.
The strategy also uses other indicators:
Fast EMA (Exponential Moving Average)
EMA 50
ATR (Average True Range) for volatility measurement and dynamic stop loss and take profit levels
RSI (Relative Strength Index) for momentum with overbought/oversold levels
ADX (Average Directional Index) for confirming trend strength
Bollinger Bands as a volatility filter
Buy signals trigger when volatility is sufficient (ATR filter), price is above EMA 50 and ALMA, RSI indicates bullish momentum, ADX confirms trend strength, price is below the upper Bollinger Band, and there is a cooldown period to prevent repeated buys within a short time.
Sell signals are generated when price crosses below the fast EMA.
The strategy manages position entries and exits dynamically, applying ATR-based stop loss and take profit levels, and optionally a time-based exit.
Additionally, the script integrates the UT Bot, an ATR-based trailing stop and signal system, enhancing trade exit precision.
Buy and sell signals are visually marked on the chart with colored triangles for easy identification.
In essence, this strategy blends advanced smoothing (ALMA) with volatility filters and trend/momentum indicators to generate reliable buy and sell signals, while managing risk dynamically through ATR-based stops and profit targets. It aims to adapt to changing market conditions by filtering noise and confirming trends before entering trades.
strategy15min bar, short-term and scalp strategy, eth, using stdev as trend line, long when price hits the lower line, short when price hits the upper line.
World-Class Crypto Strategy version 9 - BTC/ETH/SOL/XRP + MLScript intended to mirror BlackRock strategies and be used with fully integrated trading bot

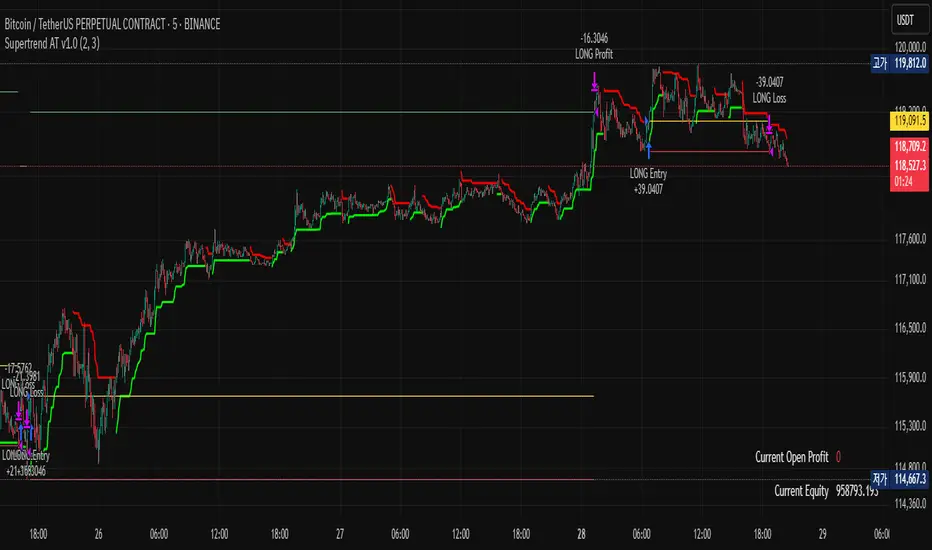
Supertrend AT v1.0### Overview
"Supertrend AT v1.0" is an automated trading strategy based on the Supertrend indicator, designed to detect trend reversals and execute entries accordingly. This script supports both **long and short** positions and includes customizable risk management features such as **RPT (Risk Per Trade)** and **RR (Risk/Reward ratio)**.
### Key Features
- 📈 **Supertrend-based Entry Logic**:
- Enters a **long position** when the Supertrend flips from red to green (downtrend → uptrend).
- Enters a **short position** when the Supertrend flips from green to red (uptrend → downtrend).
- 💰 **Auto-Calculated Position Sizing**:
- Quantity is automatically calculated to ensure that loss per trade (including commission) matches the specified risk percentage (RPT).
- 🎯 **Take-Profit and Stop-Loss**:
- Both targets are dynamically computed using the RR ratio and account for commission fees.
- 📊 **Visual Elements**:
- Entry, stop, and target prices are plotted on the chart.
- Real-time PnL and account equity are shown in a dashboard.
- Optional on-screen README guide explains the strategy and key terms.
### Inputs
- **RPT (%)**: Risk per transaction (based on account equity).
- **RR**: Reward-to-risk ratio.
- **Commission (%)**: Used in all calculations (must match the Properties tab).
- **Supertrend Settings**: Adjustable factor and length.
- **Market Decimal Places**: For accurate quantity rounding according to exchange rules.
- **Time Filter**: Set start and end time for trading logic activation.
### Risk Management Logic
This strategy calculates trade size and targets using a formula that considers both the price distance between entry and stop-loss and the effect of commission fees. This ensures:
- Consistent risk across trades
- Realistic take-profit levels
- Exchange-compliant order quantities
### Notes
- ⚠️ Be sure to set the **correct commission rate** and **decimal precision** for your exchange.
- ⚠️ If trade quantity is smaller than your exchange’s minimum unit, orders may be rejected.
- 🔧 For strategy to behave as intended in automation, double-check both **input tab** and **Properties tab** settings.
### Disclaimer
This strategy is for educational and research purposes only. It does not constitute financial advice. Always test on paper before using in a live environment.
⚡ QuantSignals 0DTE Gap Reversal Pro⚡ QuantSignals 0DTE Gap Reversal Pro (QS‑GAP‑0DTE)
Short Title: QS‑GAP‑0DTE
Script Type: Strategy (Overlay)
Recommended Qty Setting: 100% Equity
🔥 Overview
QuantSignals’ 0DTE Gap Reversal Pro is a professional-grade Pine Script strategy engineered for high-frequency gap setups on the day options trade revolves around. Sharpened for real-world 0DTE (zero days to expiration) opportunities, it fuses gap detection, price‑action pattern recognition, and AI‑inspired momentum analytics—ideal for elite retail and institutional traders alike.
💡 Core Features
Smart Gap Detection
Identify tradable gap range, direction, and fill-level against customizable thresholds.
Pattern Recognition (9:30–9:55 AM)
Recognize consolidation, drop, or rise patterns following a gap, weighted by historical win probabilities (up to 80%).
Optional Reversal Confirmation
Require confirmation with first 5-minute candle if enabled.
AI‑Style Momentum & Volume Filters
Use RSI-based momentum, volume-spike detection, and ATR-driven volatility filters for cleaner entries.
Advanced Risk Control
Configurable max gap size, take‑profit percentage, and automatic daily force‑exit.
📊 Professional Visualization
Customizable Gap Lines (solid, dashed, dotted) and labeling.
Entry Signal Labels: Includes pattern name and win‑rate estimate.
Performance Dashboard: Displays cumulative P&L, win rate, position status, gap data, and more.
Fully branded with QuantSignals color scheme and style.
🔔 Smart Alerts
Built-in alert conditions for:
Gap detection events (Gap UP/DOWN)
Valid entry signals (pattern‑filtered long/short)
Profit targets and gap‑fill exits
Volume spikes and momentum triggers
High‑probability pattern formations (e.g. 80% dip‑buy or fade setups)
Risk warnings if gap exceeds allowance
Alerts are customizable and clearly labeled for professional, hands‑free trading workflows.
🛠 Configurable Inputs
Category Example Inputs
Gap Strategy Threshold %, max gap %, TP %, reversal toggle
QuantSignals AI Momentum period, volume threshold, volatility filter
Session Options Trading window, pattern analysis window, force‑exit time
Visuals Toggle gap lines, entry labels, chart styling
Alerts Enable or disable gap/entry/exit/momentum alerts
All inputs are logically grouped and accessible in the TradingView UI for maximum flexibility.
🧠 Why It Stands Out
Combines quantitative edge with rich visual context
Professional-grade logic live‑traded by advanced 0DTE traders
AI‑inspired filters for precise, low‑noise decision making
Fully production‑ready: robust alerts, excellent visuals, modular input design
Great for backtesting, live signaling, and integration into Discord or trade bots
🚀 Ideal For
Active traders capturing short‑duration inefficiencies
Institutions and prop desks trading SPY, QQQ, IWM options
Quantitative traders leveraging pattern + sentiment momentum
Anyone wanting robust alerts, professional dashboards, and trade-quality execution
✅ Summary
QuantSignals’ 0DTE Gap Reversal Pro is the ultramodern strategy built for the edge-hunting, low-latency 0DTE environment. From pattern detection (with up to 80% win probabilities) to real-time alerts and sleek dashboards—every element is engineered for clarity, precision, and performance. Backtest, deploy, and customize on TradingView—your gateway to advanced gap‑based trading with confidence.
Join the movement—quant trade like a pro.
Visit quantsignals.xyz or join Discord /quantsignals for advanced features, real-time strategies, and a thriving 0DTE trading community.

GOLD DR Long with , TP2 & 8 WAVE E🎯 GOLD DR LONG E8 – Smart Timing.
Sharp Entries. Clean Exits.
🔍 Built for serious long traders who know the difference between chasing noise and catching real moves.
📊 The algorithm filters market conditions and waits for true momentum before acting — giving you high-quality signals with built-in discipline.
📈 Features:
• Real-time bullish divergence detection 💎
• Trend-filtered long entries only ✅
• Strategic profit targets with Fibonacci precision 🎯
• Automatic position averaging on real weakness 🔄
• Adaptive stop-loss logic for market crashes ⚠️
⏳ No rushing. No guessing. Just clean, calculated moves.
If you're tired of messy charts and false signals — this is your edge.
🧠 Inspired by market structure. Powered by logic.
Only for traders who understand that timing beats noise.

【教學範本】RSI Breakout X2_TradeSoEasy【策略簡介】
本策略屬於基於技術指標RSI的突破型趨勢交易策略。
適合用於多頭趨勢環境中尋找多單進出場機會。
【參數說明】
本策略開放兩個參數供用戶調整,以方便個人化交易風格:
1. RSI 計算週期(影響指標靈敏度)
2. RSI 突破門檻(設定進場判斷點)
其餘進階參數為付費版本專屬,用以解鎖更多設定選項,強化策略彈性與整體效能。
【風險揭露】
本策略僅供學習和回測用途,不構成投資建議或獲利保證。
交易涉及高風險,可能導致全部資金損失,請謹慎評估自身風險承受能力。
使用者需自行承擔因交易操作所產生的風險與責任。
【版權聲明】
本策略由 TradeSoEasy.com 製作,嚴禁未經授權轉載、販售或商業使用。
感謝您的支持,祝交易順利!
📱IG 尋找我們 → @tradesoeasy
TradeSoEasy © 2025 All Rights Reserved.
-----------------------------------------------------------------------------
【Strategy Overview】
This is a breakout trend trading strategy based on the RSI technical indicator.
Suitable for finding long entry and exit opportunities in bullish trends.
【Parameter Description】
This strategy offers two parameters for user customization to suit individual trading styles:
1. RSI calculation period (affects indicator sensitivity)
2. RSI breakout threshold (sets entry signal points)
Other advanced parameters are available in the paid version, unlocking enhanced flexibility and performance optimization.
【Risk Disclosure】
This strategy is for educational and backtesting purposes only and does not constitute investment advice or guarantee profit.
Trading carries high risk and may result in loss of all capital. Please carefully assess your own risk tolerance.
Users assume full responsibility for any risks or losses arising from trading activities.
【Copyright Notice】
This strategy is produced by TradeSoEasy.com and unauthorized reproduction, resale, or commercial use is strictly prohibited.
Thank you for your support and wish you successful trading!
📱IG → @TradeSoEasy-signal
TradeSoEasy © 2025 All Rights Reserved.

💲 Most Profitable Strategy (HTF) edegrano - Buy/Sell SelectableA selectable timeframe for maximum profit yield for you Buy and Sell choices.

Opening-Range BreakoutNote: Default trading date range looks mediocre. Set date range to "Entire History" to see full effect of the strategy. 50.91% profitable trades, 1.178 profit factor, steady profits and limited drawdown. Total P&L: $154,141.18, Max Drawdown: $18,624.36. High R^2
█ Overview
The Opening-Range Breakout strategy is a mechanical, session‑based day‑trading system designed to capture the initial burst of directional momentum immediately following the market open. It defines a user‑configurable “opening range” window, measures its high and low boundaries, then places breakout stop orders at those levels once the range closes. Built‑in filters on minimum range width, reward‑to‑risk ratios, and optional reversal logic help refine entries and manage risk dynamically.
█ How It Works
Opening‑Range Formation
Between 9:30–10:15 AM ET (configurable), the script tracks the highest high and lowest low to form the day’s opening range box.
On the first bar after the range window closes, the range high (OR_high) and low (OR_low) are “locked in.”
Range‑Width Filter
To avoid false breakouts in low‑volatility mornings, the range must be at least X% of the current price (default 0.35%).
If the measured opening-range width < minimum threshold, no orders are placed that day.
Entry & Order Placement
Long: a stop‑buy order at the opening‑range high.
Short: a stop‑sell order at the opening‑range low.
Only one side can trigger (or both if reverse logic is enabled after a losing trade).
Risk Management
Once triggered, each trade uses an ATR‑style stop-loss defined as a percentage retracement of the range (default 50% of range width).
Profit target is set at a configurable Reward/Risk Ratio (default 1.1×).
Optional: Reverse on Stop‑Loss – if the initial breakout loses, immediately reverse into the opposite side on the same day.
Session Exit
Any open positions are closed at the end of the regular trading day (default 3:45 PM ET window end, with hard flat at session close).
Visual cues are provided via green (range high) and red (range low) step‑line plots directly on the chart, allowing you to see the range box and breakout triggers in real time.
█ Why It Works
Early Momentum Capture: The first 15 – 60 minutes of trading encapsulate overnight news digestion and institutional order flow, creating a well‑defined volatility “range.”
Mechanical Discipline: Clear, rule‑based entries and exits remove emotional guesswork, ensuring consistency.
Volatility Filtering: By requiring a minimum range width, the system avoids choppy, low‑range days where false breakouts are common.
Dynamic Sizing: Stops and targets scale with the opening range, adapting automatically to each day’s volatility environment.
█ How to Use
Set Your Instruments & Timeframe
-Apply to any futures contract on a 1‑ to 5‑minute chart.
-Ensure chart timezone is set to America/New_York.
Configure Inputs
-Opening‑Range Window: e.g. “0930-1015” for a 45‑minute range.
-Min. OR Width (%): e.g. 0.35 for 0.35% of current price.
-Reward/Risk Ratio: e.g. 1.1 for a modest profit target above your stop.
-Max OR Retracement %: e.g. 50 to set stop at 50% of range width.
-One Trade Per Day: toggle to limit to a single breakout.
-Reverse on Stop Loss: toggle to flip direction after a losing breakout.
Monitor the Chart
-Watch the green and red range boundaries form during the session open.
-Orders will automatically submit on the first bar after the range window closes, conditioned on your filters.
Review & Adjust
-Backtest across multiple months to validate performance on your preferred contract.
-Tweak range duration, minimum width, and R/R multiple to fit your risk tolerance and desired win‑rate vs. expectancy balance.
█ Settings Reference
Input Defaults
Opening‑Range Window - Time window to form OR (HHMM-HHMM) - 0930–1015
Regular Trading Day - Full session for EOD flat (HHMM-HHMM) - 0930–1545
Min. OR Width (%) - Minimum OR size as % of close to trigger orders - 0.35
Reward/Risk Ratio - Profit target multiple of stop‑loss distance - 1.1
Max OR Retracement (%) - % of OR width to use as stop‑loss distance - 50
One Trade Per Day - Limit to a single breakout order per day - false
Reverse on Stop Loss - Reverse direction immediately after a losing trade - true
Disclaimer
This strategy description and any accompanying code are provided for educational purposes only and do not constitute financial advice or a solicitation to trade. Futures trading involves substantial risk, including possible loss of capital. Past performance is not indicative of future results. Traders should assess their own risk tolerance and conduct thorough backtesting and forward-testing before committing real capital.

💲 Most Profitable Strategy (HTF) edegrano - Buy/Sell SelectableOffer the best choice for buy and sell with a selectable timeframe to obtain the highest yield of income.
