Supertrend Long-Only Strategy for QQQThis strategy is meant to use Micro Momentum to give good Buy and Sell signals in trending markets
Indicators and strategies

Long and Short Strategy with Multi Indicators [B1P5]Long and Short Strategy with RSI, ROC, MA Selection, Exit Visualization, and Strength Indicator

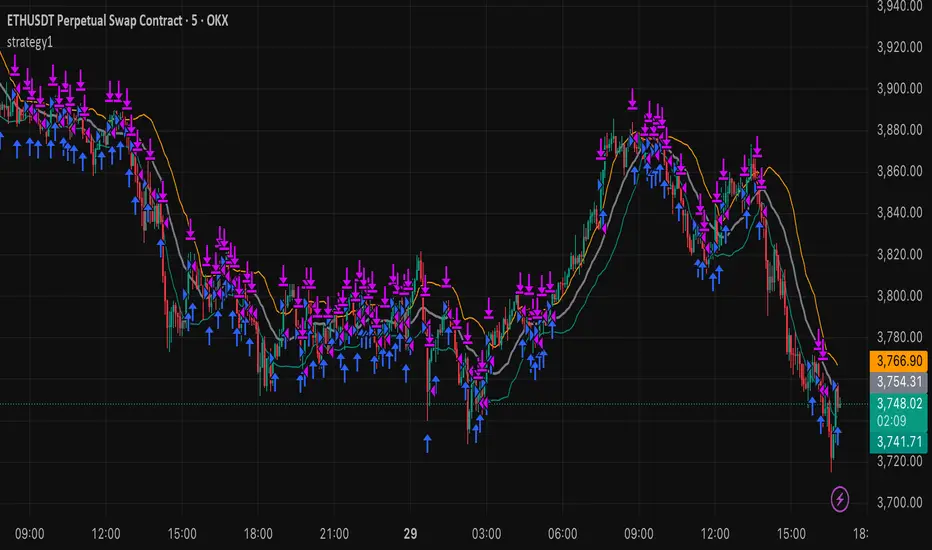
strategy15min bar, short-term and scalp strategy, eth, using stdev as trend line, long when price hits the lower line, short when price hits the upper line.
Opening-Range BreakoutNote: Default trading date range looks mediocre. Set date range to "Entire History" to see full effect of the strategy. 50.91% profitable trades, 1.178 profit factor, steady profits and limited drawdown. Total P&L: $154,141.18, Max Drawdown: $18,624.36. High R^2
█ Overview
The Opening-Range Breakout strategy is a mechanical, session‑based day‑trading system designed to capture the initial burst of directional momentum immediately following the market open. It defines a user‑configurable “opening range” window, measures its high and low boundaries, then places breakout stop orders at those levels once the range closes. Built‑in filters on minimum range width, reward‑to‑risk ratios, and optional reversal logic help refine entries and manage risk dynamically.
█ How It Works
Opening‑Range Formation
Between 9:30–10:15 AM ET (configurable), the script tracks the highest high and lowest low to form the day’s opening range box.
On the first bar after the range window closes, the range high (OR_high) and low (OR_low) are “locked in.”
Range‑Width Filter
To avoid false breakouts in low‑volatility mornings, the range must be at least X% of the current price (default 0.35%).
If the measured opening-range width < minimum threshold, no orders are placed that day.
Entry & Order Placement
Long: a stop‑buy order at the opening‑range high.
Short: a stop‑sell order at the opening‑range low.
Only one side can trigger (or both if reverse logic is enabled after a losing trade).
Risk Management
Once triggered, each trade uses an ATR‑style stop-loss defined as a percentage retracement of the range (default 50% of range width).
Profit target is set at a configurable Reward/Risk Ratio (default 1.1×).
Optional: Reverse on Stop‑Loss – if the initial breakout loses, immediately reverse into the opposite side on the same day.
Session Exit
Any open positions are closed at the end of the regular trading day (default 3:45 PM ET window end, with hard flat at session close).
Visual cues are provided via green (range high) and red (range low) step‑line plots directly on the chart, allowing you to see the range box and breakout triggers in real time.
█ Why It Works
Early Momentum Capture: The first 15 – 60 minutes of trading encapsulate overnight news digestion and institutional order flow, creating a well‑defined volatility “range.”
Mechanical Discipline: Clear, rule‑based entries and exits remove emotional guesswork, ensuring consistency.
Volatility Filtering: By requiring a minimum range width, the system avoids choppy, low‑range days where false breakouts are common.
Dynamic Sizing: Stops and targets scale with the opening range, adapting automatically to each day’s volatility environment.
█ How to Use
Set Your Instruments & Timeframe
-Apply to any futures contract on a 1‑ to 5‑minute chart.
-Ensure chart timezone is set to America/New_York.
Configure Inputs
-Opening‑Range Window: e.g. “0930-1015” for a 45‑minute range.
-Min. OR Width (%): e.g. 0.35 for 0.35% of current price.
-Reward/Risk Ratio: e.g. 1.1 for a modest profit target above your stop.
-Max OR Retracement %: e.g. 50 to set stop at 50% of range width.
-One Trade Per Day: toggle to limit to a single breakout.
-Reverse on Stop Loss: toggle to flip direction after a losing breakout.
Monitor the Chart
-Watch the green and red range boundaries form during the session open.
-Orders will automatically submit on the first bar after the range window closes, conditioned on your filters.
Review & Adjust
-Backtest across multiple months to validate performance on your preferred contract.
-Tweak range duration, minimum width, and R/R multiple to fit your risk tolerance and desired win‑rate vs. expectancy balance.
█ Settings Reference
Input Defaults
Opening‑Range Window - Time window to form OR (HHMM-HHMM) - 0930–1015
Regular Trading Day - Full session for EOD flat (HHMM-HHMM) - 0930–1545
Min. OR Width (%) - Minimum OR size as % of close to trigger orders - 0.35
Reward/Risk Ratio - Profit target multiple of stop‑loss distance - 1.1
Max OR Retracement (%) - % of OR width to use as stop‑loss distance - 50
One Trade Per Day - Limit to a single breakout order per day - false
Reverse on Stop Loss - Reverse direction immediately after a losing trade - true
Disclaimer
This strategy description and any accompanying code are provided for educational purposes only and do not constitute financial advice or a solicitation to trade. Futures trading involves substantial risk, including possible loss of capital. Past performance is not indicative of future results. Traders should assess their own risk tolerance and conduct thorough backtesting and forward-testing before committing real capital.

Casper SMC 5min ORB - Roboquant AI🚀 Key Features:
Opening Range (09:30–09:35 EST) breakout detection
Configurable entry type: Instant or Retracement
Adjustable Risk:Reward multiplier and contract sizing
Optional Trailing Stop Loss using ATR
Second-Chance trades if the first breakout fails
Visual markers for entries, SL/TP, trade status, and breakout validation
Day filter: Trade only on selected weekdays
Session management with configurable close time
Breakout validation using:
Wick percentage filters
Distance filters based on OR range size
🧠 AI-Style Logic Enhancements:
Smart filters for avoiding overextended or noisy breakouts
Full support for lookahead-safe logic via barstate.isconfirmed
Clean box-style trade visualization (entry, SL, TP zones)
Custom alerts for long and short entries
⚙️ Recommended Settings:
Use on 5-minute chart
Best for US indices/ Futures
📌 Note:
This script is for educational purposes only.
Performance preview on Tradingview is not accurate
Yoou need to adjust the settings and run a 1 year report
Always backtest thoroughly and consult your financial advisor before live trading.

NQ Phantom Scalper Pro# 👻 NQ Phantom Scalper Pro
**Advanced VWAP Mean Reversion Strategy with Volume Confirmation**
## 🎯 Strategy Overview
The NQ Phantom Scalper Pro is a sophisticated mean reversion strategy designed specifically for Nasdaq 100 (NQ) futures scalping. This strategy combines Volume Weighted Average Price (VWAP) bands with intelligent volume spike detection to identify high-probability reversal opportunities during optimal market hours.
## 🔧 Key Features
### VWAP Band System
- **Dynamic VWAP Bands**: Automatically adjusting standard deviation bands based on intraday volatility
- **Multiple Band Levels**: Configurable Band #1 (entry trigger) and Band #2 (profit target reference)
- **Flexible Anchoring**: Choose from Session, Week, Month, Quarter, or Year-based VWAP calculations
### Volume Intelligence
- **Volume Spike Detection**: Only triggers entries when volume exceeds SMA by configurable multiplier
- **Relative Volume Display**: Real-time volume strength indicator in info panel
- **Optional Volume Filter**: Can be disabled for testing alternative setups
### Advanced Time Management
- **12-Hour Format**: User-friendly time inputs (9 AM - 4 PM default)
- **Lunch Filter**: Automatically avoids low-liquidity lunch period (12-2 PM)
- **Visual Time Zones**: Color-coded background for active/inactive periods
- **Market Hours Focus**: Optimized for peak NQ trading sessions
### Smart Risk Management
- **ATR-Based Stops**: Volatility-adjusted stop losses using Average True Range
- **Dual Exit Strategy**: VWAP mean reversion + fixed profit targets
- **Adjustable Risk-Reward**: Configurable target ratio to opposite VWAP band
- **Position Sizing**: Percentage-based equity allocation
### Optional Trend Filter
- **EMA Trend Alignment**: Optional trend filter to avoid counter-trend trades
- **Configurable Period**: Adjustable EMA length for trend determination
- **Toggle Functionality**: Enable/disable based on market conditions
## 📊 How It Works
### Entry Logic
**Long Entries**: Triggered when price touches lower VWAP band + volume spike during active hours
**Short Entries**: Triggered when price touches upper VWAP band + volume spike during active hours
### Exit Strategy
1. **VWAP Mean Reversion**: Early exit when price returns to VWAP center line
2. **Profit Target**: Fixed target based on percentage to opposite VWAP band
3. **Stop Loss**: ATR-based protective stop
### Visual Elements
- **VWAP Center Line**: Blue line showing volume-weighted fair value
- **Green Bands**: Entry trigger levels (Band #1)
- **Red Bands**: Extended levels for target reference (Band #2)
- **Orange EMA**: Trend filter line (when enabled)
- **Background Colors**: Yellow (lunch), Gray (after hours), Clear (active trading)
- **Info Panel**: Real-time metrics display
## ⚙️ Recommended Settings
### Timeframes
- **Primary**: 1-5 minute charts for scalping
- **Validation**: Test on 15-minute for swing applications
### Market Conditions
- **Best Performance**: Ranging/choppy markets with good volume
- **Trend Markets**: Enable trend filter to avoid counter-trend trades
- **High Volatility**: Increase ATR multiplier for stops
### Session Optimization
- **Pre-Market**: Generally avoided (low volume)
- **Morning Session**: 9:30 AM - 12:00 PM (high activity)
- **Lunch Period**: 12:00 PM - 2:00 PM (filtered by default)
- **Afternoon Session**: 2:00 PM - 4:00 PM (good volume)
- **After Hours**: Generally avoided (wide spreads)
## ⚠️ Risk Disclaimer
This strategy is for educational purposes only and does not constitute financial advice. Past performance does not guarantee future results. Trading futures involves substantial risk of loss and is not suitable for all investors. Users should:
- Thoroughly backtest on historical data
- Start with small position sizes
- Understand the risks of leveraged trading
- Consider transaction costs and slippage
- Never risk more than you can afford to lose
## 📈 Performance Tips
1. **Volume Threshold**: Adjust volume multiplier based on average NQ volume patterns
2. **Band Sensitivity**: Modify band multipliers for different volatility regimes
3. **Time Filters**: Customize trading hours based on your timezone and preferences
4. **Trend Alignment**: Use trend filter during strong directional markets
5. **Risk Management**: Always maintain consistent position sizing and risk parameters
**Version**: 6.0 Compatible
**Asset**: Optimized for NASDAQ 100 Futures (NQ)
**Style**: Mean Reversion Scalping
**Frequency**: High-Frequency Trading Ready

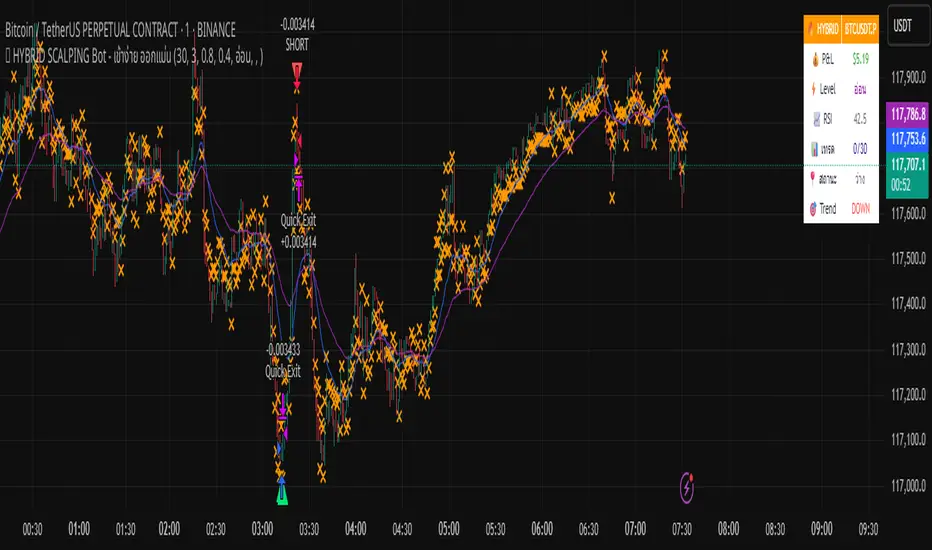
🔥 HYBRID SCALPING Bot - เข้าง่าย ออกแม่นA tool bot that helps analyze charts accurately, focusing on profits.
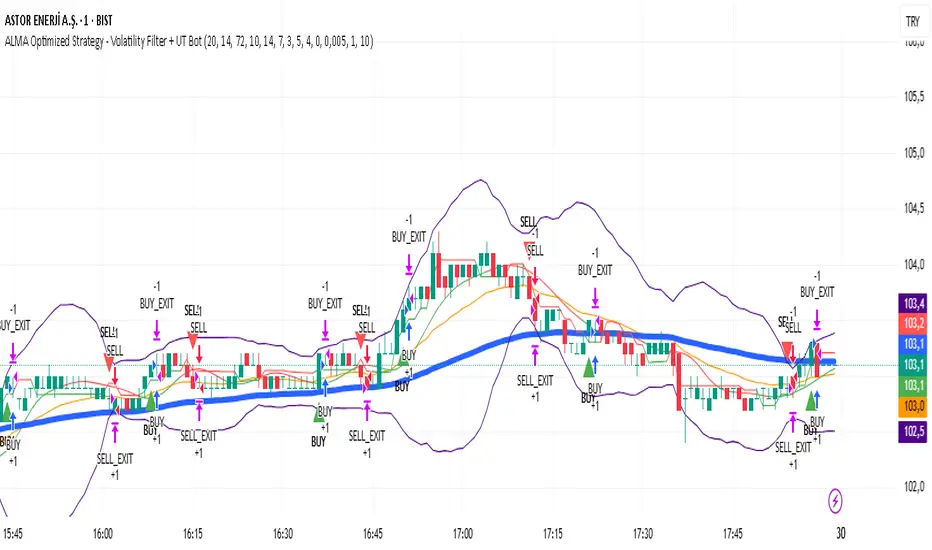
ALMA Optimized Strategy - Volatility Filter + UT BotThe strategy you provided is an ALMA Optimized Strategy implemented in Pine Script™ version 5 for TradingView. Here is a brief English summary of what it is and how it works:
It is a trend-following strategy combining multiple technical indicators to optimize trade entries and exits.
The core moving average used is the ALMA (Arnaud Legoux Moving Average), known for smoother and less lagging price smoothing compared to traditional EMAs or SMAs.
The strategy also uses other indicators:
Fast EMA (Exponential Moving Average)
EMA 50
ATR (Average True Range) for volatility measurement and dynamic stop loss and take profit levels
RSI (Relative Strength Index) for momentum with overbought/oversold levels
ADX (Average Directional Index) for confirming trend strength
Bollinger Bands as a volatility filter
Buy signals trigger when volatility is sufficient (ATR filter), price is above EMA 50 and ALMA, RSI indicates bullish momentum, ADX confirms trend strength, price is below the upper Bollinger Band, and there is a cooldown period to prevent repeated buys within a short time.
Sell signals are generated when price crosses below the fast EMA.
The strategy manages position entries and exits dynamically, applying ATR-based stop loss and take profit levels, and optionally a time-based exit.
Additionally, the script integrates the UT Bot, an ATR-based trailing stop and signal system, enhancing trade exit precision.
Buy and sell signals are visually marked on the chart with colored triangles for easy identification.
In essence, this strategy blends advanced smoothing (ALMA) with volatility filters and trend/momentum indicators to generate reliable buy and sell signals, while managing risk dynamically through ATR-based stops and profit targets. It aims to adapt to changing market conditions by filtering noise and confirming trends before entering trades.
Trading Report Generator from CSVMany people use the Trading Panel. Unfortunately, it doesn't have a Performance Report. However, TradingView has strategies, and they have a Performance Report :-D
What if we combine the first and second? It's easy!
This script is a special strategy that parses transactions in csv format from Paper Trading (and it will also work for other brokers) and “plays” them. As a result, we get a Performance Report for a specific instrument based on our real trades in Paper or another broker.
How to use it :
First, we need to get a CSV file with transactions. To do this, go to the Trading Panel and connect the desired broker. Select the History tab, then the Filled sub-tab, and configure the columns there, leaving only: Side, Qty, Fill Price, Closing Time. After that, open the Export data dialog, select History, and click Export. Open the downloaded CSV file in a regular text editor (Notepad or similar). It will contain a text like this:
Symbol,Side,Qty,Fill Price,Closing Time
FX:EURUSD,Buy,1000,1.0938700000000001,2023-04-05 14:29:23
COINBASE:ETHUSD,Sell,1,1332.05,2023-01-11 17:41:33
CME_MINI:ESH2023,Sell,1,3961.75,2023-01-11 17:30:40
CME_MINI:ESH2023,Buy,1,3956.75,2023-01-11 17:08:53
Next select all the text (Ctrl+A) and copy it to the clipboard.
Now apply the "Trading Report Generator from CSV" strategy to the chart with the desired symbol and TF, open the settings/input dialog, paste the contents of the clipboard into the single text input field of the strategy, and click Ok.
That's it.
In the Strategy Tester, we see a detailed Performance Report based on our real transactions.
P.S. The CSV file may contain transactions for different instruments, for example, you may have transactions for CRYPTO:BTCUSD and NASDAQ:AAPL. To view the report is based on CRYPTO:BTCUSD trades, simply change the symbol on the chart to CRYPTO:BTCUSD. To view the report is based on NASDAQ:AAPL trades, simply change the symbol on the chart to NASDAQ:AAPL. No changes to the strategy are required.
How it works :
At the beginning of the calculation, we parse the csv once, create trade objects (Trade) and sort them in chronological order. Next, on each bar, we check whether we have trades for the time period of the next bar. If there are, we place a limit order for each trade, with limit price == Fill Price of the trade. Here, we assume that if the trade is real, its execution price will be within the bar range, and the Pine strategy engine will execute this order at the specified limit price.

EUR/USD Multi-Layer Statistical Regression StrategyStrategy Overview
This advanced EUR/USD trading system employs a triple-layer linear regression framework with statistical validation and ensemble weighting. It combines short, medium, and long-term regression analyses to generate high-confidence directional signals while enforcing strict risk controls.
Core Components
Multi-Layer Regression Engine:
Parallel regression analysis across 3 customizable timeframes (short/medium/long)
Projects future price values using prediction horizons
Statistical significance filters (R-squared, correlation, slope thresholds)
Signal Validation System:
Lookback validation tests historical prediction accuracy
Ensemble weighting of layer signals (adjustable influence per timeframe)
Confidence scoring combining statistical strength, layer agreement, and validation accuracy
Risk Management:
Position sizing scaled by signal confidence (1%-100% of equity)
Daily loss circuit breaker (halts trading at user-defined threshold)
Forex-tailored execution (pip slippage, percentage-based commissions)
Visual Intelligence:
Real-time regression line plots (3 layered colors)
Projection markers for short-term forecasts
Background coloring for market bias indication
Comprehensive statistics dashboard (R-squared metrics, validation scores, P&L)
Key Parameters
Category Settings
Regression Short/Med/Long lengths (20/50/100 bars)
Statistics Min R² (0.65), Correlation (0.7), Slope (0.0001)
Validation 30-bar lookback, 10-bar projection
Risk Controls 50% position size, 12% daily loss limit, 75% confidence threshold
Trading Logic
Entries require:
Ensemble score > |0.5|
Confidence > threshold
Short & medium-term significance
Active daily loss limit not breached
Exits triggered by:
Opposite high-confidence signals
Daily loss limit violation (emergency exit)
The strategy blends quantitative finance techniques with practical trading safeguards, featuring a self-optimizing design where signal quality directly impacts position sizing. The visual dashboard provides real-time feedback on model performance and market conditions.

CCI-MACD Strategy 4.2
I cerchi si basano sull'oscillatore CCI (Commodity Channel Index).
L’indicatore CCI ci permette di osservare se il livello attuale del prezzo è particolarmente al di sopra o al di sotto di una certa media mobile, avente un numero di periodi scelto da noi.
Più la deviazione dal prezzo medio nel breve termine è forte, e maggiormente l’indicatore si allontanerà dallo 0: verso l’alto in caso di uptrend, o verso il basso in caso di downtrend.
Il segnale viene dato quando il valore del CCI supera la linea dello zero.
Il tutto è filtrato con un altro indicatore, il MACD, acronimo di "Moving Average Convergence Divergence", usato per identificare cambiamenti nel momentum del prezzo.
The circles are based on the CCI (Commodity Channel Index) oscillator.
The CCI indicator allows us to observe whether the current price level is significantly above or below a certain moving average, with a number of periods chosen by us.
The greater the deviation from the short-term average price, the further the indicator will deviate from 0: upwards in the case of an uptrend, or downwards in the case of a downtrend.
The signal is given when the CCI value crosses the zero line.
This is all filtered through another indicator, the MACD, which stands for "Moving Average Convergence Divergence," used to identify changes in price momentum.

Intraday Combo Strategy HHStochastic RSI Momentum/Reversal quickly identifies overbought/oversold zones
MACD Momentum/Trend confirms a trend reversal, a late but powerful signal
Supertrend Trend Tracking provides clear and concise buy/sell signals
Bollinger Bands Volatility shows price deviation during breakouts/squeezes
ADX Trend Strength measures trend strength to filter out false signals

Open Close Cross Strategy R5 Delay//@version=5
//
strategy(title='Open Close Cross Strategy R5.1 revised by JustUncleL', shorttitle='OCC Strategy R5.1', overlay=true, pyramiding=0, default_qty_type=strategy.percent_of_equity, default_qty_value=10, calc_on_every_tick=false)
//
// Revision: 5
// Original Author: @JayRogers
// Revision Author: JustUncleL revisions 3, 4, 5
//
// *** USE AT YOUR OWN RISK ***
// - There are drawing/painting issues in pinescript when working across resolutions/timeframes that I simply
// cannot fix here.. I will not be putting any further effort into developing this until such a time when
// workarounds become available.
// NOTE: Re-painting has been observed infrequently with default settings and seems OK up to Alternate
// multiplier of 5.
// Non-repainting mode is available by setting "Delay Open/Close MA" to 1 or more, but the reported
// performance will drop dramatically.
//
// R5.1 Changes by JustUncleL
// - Upgraded to Version 3 Pinescript.
// - Added option to select Trade type (Long, Short, Both or None)
// - Added bar colouring work around patch.
// - Small code changes to improve efficiency.
// - NOTE: To enable non-Repainting mode set "Delay Open/Close MA" to 1 or more.
// 9-Aug-2017
// - Correction on SuperSmooth MA calculation.
//
// R5 Changes by JustUncleL
// - Corrected cross over calculations, sometimes gave false signals.
// - Corrected Alternate Time calculation to allow for Daily,Weekly and Monthly charts.
// - Open Public release.
// R4 Changes By JustUncleL
// - Change the way the Alternate resolution in selected, use a Multiplier of the base Time Frame instead,
// this makes it easy to switch between base time frames.
// - Added TMA and SSMA moving average options. But DEMA is still giving the best results.
// - Using "calc_on_every_tick=false" ensures results between backtesting and real time are similar.
// - Added Option to Disable the coloring of the bars.
// - Updated default settings.
//
// R3 Changes by JustUncleL:
// - Returned a simplified version of the open/close channel, it shows strength of current trend.
// - Added Target Profit Option.
// - Added option to reduce the number of historical bars, overcomes the too many trades limit error.
// - Simplified the strategy code.
// - Removed Trailing Stop option, not required and in my opion does not work well in Trading View,
// it also gives false and unrealistic performance results in backtesting.
//
// R2 Changes:
// - Simplified and cleaned up plotting, now just shows a Moving Average derived from the average of open/close.
// - Tried very hard to alleviate painting issues caused by referencing alternate resolution..
//
// Description:
// - Strategy based around Open-Close Crossovers.
// Setup:
// - I have generally found that setting the strategy resolution to 3-4x that of the chart you are viewing
// tends to yield the best results, regardless of which MA option you may choose (if any) BUT can cause
// a lot of false positives - be aware of this
// - Don't aim for perfection. Just aim to get a reasonably snug fit with the O-C band, with good runs of
// green and red.
// - Option to either use basic open and close series data, or pick your poison with a wide array of MA types.
// - Optional trailing stop for damage mitigation if desired (can be toggled on/off)
// - Positions get taken automagically following a crossover - which is why it's better to set the resolution
// of the script greater than that of your chart, so that the trades get taken sooner rather than later.
// - If you make use of the stops, be sure to take your time tweaking the values. Cutting it too fine
// will cost you profits but keep you safer, while letting them loose could lead to more drawdown than you
// can handle.
// - To enable non-Repainting mode set "Delay Open/Close MA" to 1 or more.
//
// === INPUTS ===
useRes = input(defval=true, title='Use Alternate Resolution?')
intRes = input(defval=3, title='Multiplier for Alernate Resolution')
stratRes = timeframe.ismonthly ? str.tostring(timeframe.multiplier * intRes, '###M') : timeframe.isweekly ? str.tostring(timeframe.multiplier * intRes, '###W') : timeframe.isdaily ? str.tostring(timeframe.multiplier * intRes, '###D') : timeframe.isintraday ? str.tostring(timeframe.multiplier * intRes, '####') : '60'
basisType = input.string(defval='SMMA', title='MA Type: ', options= )
basisLen = input.int(defval=8, title='MA Period', minval=1)
offsetSigma = input.int(defval=6, title='Offset for LSMA / Sigma for ALMA', minval=0)
offsetALMA = input.float(defval=0.85, title='Offset for ALMA', minval=0, step=0.01)
scolor = input(false, title='Show coloured Bars to indicate Trend?')
delayOffset = input.int(defval=1, title='Delay Open/Close MA (Forces Non-Repainting)', minval=0, step=1)
tradeType = input.string('BOTH', title='What trades should be taken : ', options= )
// === /INPUTS ===
// Constants colours that include fully non-transparent option.
green100 = #008000FF
lime100 = #00FF00FF
red100 = #FF0000FF
blue100 = #0000FFFF
aqua100 = #00FFFFFF
darkred100 = #8B0000FF
gray100 = #808080FF
// === BASE FUNCTIONS ===
// Returns MA input selection variant, default to SMA if blank or typo.
variant(type, src, len, offSig, offALMA) =>
v1 = ta.sma(src, len) // Simple
v2 = ta.ema(src, len) // Exponential
v3 = 2 * v2 - ta.ema(v2, len) // Double Exponential
v4 = 3 * (v2 - ta.ema(v2, len)) + ta.ema(ta.ema(v2, len), len) // Triple Exponential
v5 = ta.wma(src, len) // Weighted
v6 = ta.vwma(src, len) // Volume Weighted
v7 = 0.0
sma_1 = ta.sma(src, len) // Smoothed
v7 := na(v7 ) ? sma_1 : (v7 * (len - 1) + src) / len
v8 = ta.wma(2 * ta.wma(src, len / 2) - ta.wma(src, len), math.round(math.sqrt(len))) // Hull
v9 = ta.linreg(src, len, offSig) // Least Squares
v10 = ta.alma(src, len, offALMA, offSig) // Arnaud Legoux
v11 = ta.sma(v1, len) // Triangular (extreme smooth)
// SuperSmoother filter
// © 2013 John F. Ehlers
a1 = math.exp(-1.414 * 3.14159 / len)
b1 = 2 * a1 * math.cos(1.414 * 3.14159 / len)
c2 = b1
c3 = -a1 * a1
c1 = 1 - c2 - c3
v12 = 0.0
v12 := c1 * (src + nz(src )) / 2 + c2 * nz(v12 ) + c3 * nz(v12 )
type == 'EMA' ? v2 : type == 'DEMA' ? v3 : type == 'TEMA' ? v4 : type == 'WMA' ? v5 : type == 'VWMA' ? v6 : type == 'SMMA' ? v7 : type == 'HullMA' ? v8 : type == 'LSMA' ? v9 : type == 'ALMA' ? v10 : type == 'TMA' ? v11 : type == 'SSMA' ? v12 : v1
// security wrapper for repeat calls
reso(exp, use, res) =>
security_1 = request.security(syminfo.tickerid, res, exp, gaps=barmerge.gaps_off, lookahead=barmerge.lookahead_on)
use ? security_1 : exp
// === /BASE FUNCTIONS ===
// === SERIES SETUP ===
closeSeries = variant(basisType, close , basisLen, offsetSigma, offsetALMA)
openSeries = variant(basisType, open , basisLen, offsetSigma, offsetALMA)
// === /SERIES ===
// === PLOTTING ===
// Get Alternate resolution Series if selected.
closeSeriesAlt = reso(closeSeries, useRes, stratRes)
openSeriesAlt = reso(openSeries, useRes, stratRes)
//
trendColour = closeSeriesAlt > openSeriesAlt ? color.green : color.red
bcolour = closeSeries > openSeriesAlt ? lime100 : red100
barcolor(scolor ? bcolour : na, title='Bar Colours')
closeP = plot(closeSeriesAlt, title='Close Series', color=trendColour, linewidth=2, style=plot.style_line, transp=20)
openP = plot(openSeriesAlt, title='Open Series', color=trendColour, linewidth=2, style=plot.style_line, transp=20)
fill(closeP, openP, color=trendColour, transp=80)
// === /PLOTTING ===
//
//
// === ALERT conditions
xlong = ta.crossover(closeSeriesAlt, openSeriesAlt)
xshort = ta.crossunder(closeSeriesAlt, openSeriesAlt)
longCond = xlong // alternative: longCond ? false : (xlong or xlong ) and close>closeSeriesAlt and close>=open
shortCond = xshort // alternative: shortCond ? false : (xshort or xshort ) and close 0 ? tpPoints : na
SL = slPoints > 0 ? slPoints : na
// Make sure we are within the bar range, Set up entries and exit conditions
if (ebar == 0 or tdays <= ebar) and tradeType != 'NONE'
strategy.entry('long', strategy.long, when=longCond == true and tradeType != 'SHORT')
strategy.entry('short', strategy.short, when=shortCond == true and tradeType != 'LONG')
strategy.close('long', when=shortCond == true and tradeType == 'LONG')
strategy.close('short', when=longCond == true and tradeType == 'SHORT')
strategy.exit('XL', from_entry='long', profit=TP, loss=SL)
strategy.exit('XS', from_entry='short', profit=TP, loss=SL)
// === /STRATEGY ===
// eof

SwingTrade ADX Strategy v6This is a swing trading strategy that combines VWAP (Volume Weighted Average Price), ADX (Average Directional Index) for trend strength, and volume ratios to generate long/short entry and exit signals. It's designed for daily charts but can be adapted.
#### Key Features:
- **Entries**: Based on VWAP crossovers, rising/falling delta (price deviation from VWAP), ADX trend confirmation, and volume ratios.
- **Exits**: Dynamic exits when VWAP delta reverses after a peak.
- **Filters**: Optional toggles for VWAP signals, ADX, and volume. Backtest date range for custom periods.
- **Visuals**: VWAP line, signal shapes/labels, and an info panel showing key metrics (VWAP Delta %, ADX, Volume Ratio).
- **Alerts**: Built-in alerts for buy/sell entries and exits.
#### How to Use:
1. Apply to your chart (e.g., stocks, forex, crypto).
2. Adjust parameters in the settings (e.g., ADX threshold, volume period).
3. Enable/disable indicators as needed.
4. Backtest using the date filters and review equity curve.
**Disclaimer**: This is for educational purposes only. Past performance is not indicative of future results. Not financial advice—trade at your own risk. Backtest thoroughly and use with proper risk management.
Feedback welcome! If you find it useful, give it a like.

逆勢布林+RSI策略 for SOL可以直接套用到 SOLUSDT, SOLPERP, 或其他 SOL 合約。
在策略回測介面中選擇 5min 或 15min 看策略表現。
若要調整停利%或 RSI 數值,改變 rsi < 25 與 (shortEntryPrice - close) / shortEntryPrice >= 0.035 即可。
This can be directly applied to SOLUSDT, SOLPERP, or other SOL futures.
In the strategy backtesting interface, select 5-minute or 15-minute periods to view strategy performance.
To adjust the take-profit percentage or RSI value, set RSI < 25 and (shortEntryPrice - close) / shortEntryPrice >= 0.035.

Max Profit Min Loss Options Strategyoption when to buy and sell calls and puts indicator. it uses the rsi macd and volume indicators. it has high profit and low loses
200 SMA (5%/-3% Buffer) for SPY & QQQ In my testing TQQQ is an absolute monster of an ETF that performs extremely well even from a buy and hold standpoint over long periods of time, its largest drawback is the massive drawdown exposure that it faces which can be easily sidestepped with this strategy.
This strategy is meant to basically abuse TQQQ's insane outperformance while augmenting the typical 200SMA strategy in a way that uses all of its strengths while avoiding getting whipsawed in sideways markets.
The strategy BUYS when price crosses 5% over the 200SMA and then SELLS when price drops 3% below the 200SMA. Between trades I'll be parking my entire account in SGOV.
So maximizing profit while minimizing risk.
You use the strategy based off of QQQ and then make the trades on TQQQ when it tells you to BUY/SELL.
Here are some reasons why I will be using this strategy:
Simple emotionless BUY and SELL signals where I don't care who the president is, what is happening in the world, who is bombing who, who the leadership team is, no attachment to individual companies and diversified across the NASDAQ.
~85% win percentage and when it does lose the loses are nothing compared to the wins and after a loss you're basically set up for a massive win in the next trade.
Max drawdown of around 53% when using TQQQ
You benefit massively when the market is doing well and when there is a recession you basically sit in SGOV for a year and then are set up for a monster recovery with a clear easy BUY signal. So as long as you're patient you win regardless of what happens.
The trades are often very long term resulting in you taking advantage of Long Term Capital Gains tax advantage which could mean saving up to 15-20% in taxes.
With only a few trades you can spend time doing other stuff and don't have to track or pay attention to anything that is happening.
Simple, easy, and massively profitable.

4H Bollinger Breakout StrategyThis strategy leverages Bollinger Bands on the 4-hour timeframe for long and short trades in trending or ranging markets. Entries trigger on BB breakouts with optional filters for volume, trend, and RSI. Exits occur on opposite BB crosses. Customizable for long-only, short-only, or indicator mode via code comments. Supports forex, stocks, or crypto with full equity allocation and 0.1% commission.
Length (Default: 20): Period for BB basis and std dev; shorter for sensitivity, longer for smoothing.
Basis MA Type (Default: SMA): Selects MA for middle band (SMA, EMA, etc.); EMA for faster response.
Source (Default: Close): Price input for calculations; use close for standard accuracy.
StdDev Multiplier (Default: 1.8): Band width control; higher for fewer signals, lower for more.
Offset (Default: 0): Shifts BB plots; typically unchanged.
Use Filters (Default: True): Applies volume, trend, RSI checks to filter signals.
Volume MA Length (Default: 20): For volume filter (long: >105% avg, short: >120%).
Trend MA Length (Default: 80): SMA for trend filter (long: above MA, short: below).
RSI Length (Default: 14): For short filter (entry if RSI <85).
Use Long/Short Signals (Defaults: True): Toggles directions; long entry on lower BB crossover, short on upper crossunder.
Visuals: BB plots (blue basis, red upper, green lower), orange trend MA, filled background.
Labels/Alerts: Green/red for long entry/exit, yellow/purple for short; alert conditions included.

EasyTrader PRO++ v2 (All-in-One Forex SMC Edition)📈 EasyTrader PRO++ v2 – All-in-One Forex SMC Strategy (15m & 1h Optimized)
🚀 The Ultimate Smart Money Concept Strategy – Built for Simplicity, Power, and Precision
EasyTrader PRO++ v2 is a next-generation strategy script developed exclusively for Forex trading. It combines institutional concepts, price action, volume logic, and precision risk management into one powerful tool – all optimized for 15-minute and 1-hour timeframes.
💡 Core Features:
✅ Smart Money Entry Score System – 6-point scoring logic with real-time visual output
✅ Micro Orderblocks – visual levels with breakout confirmation
✅ Liquidity Sweeps – detects stop hunts & fakeouts automatically
✅ SuperTrend + EMA + HMA + TRIX confirmation system
✅ Volume Impulse Filter for explosive moves
✅ Session Filter for London/NY only (toggleable)
✅ Fully adjustable Risk/Reward ratio with auto TP/SL
🧠 Built-in Intelligence:
🟢 Buy/Sell signals optimized for clarity and entry precision
🎯 Info Panel showing signal strength, trend direction, liquidity status, and more
⚙️ Debug Mode: Allows instant backtest verification in Strategy Tester
🕹️ Customizable display options: choose your modules (OB, EMA, TRIX etc.)
🧪 Optimized for:
✅ Strategy Tester (fully Pine v6 compliant)
✅ Manual & algorithmic traders
✅ Visual clarity & educational transparency
✅ Beginner-friendly UI with Pro-level backend logic
🔓 No repainting. No lagging indicators. Just clean, optimized logic.
If you're serious about Forex entries that make sense, this is your new daily driver.
Try it on EURUSD, GBPUSD, XAUUSD and see the entry logic unfold live.

Double MACD StrategyDouble MACD Strategy (Default Settings)
This automated strategy uses two independent MACD indicators to flip between long and short positions.
How It Works
• Fast MACD (MACD 1) captures rapid micro-trends
• Slow MACD (MACD 2) confirms broader momentum
• Long Entry when both MACD lines cross above their signal lines
• Short Entry when both MACD lines cross below their signal lines
• Existing opposing trades are closed before opening new ones
Default Input Settings
• Fast MACD (MACD 1)
• Fast Length 1: 12
• Slow Length 1: 26
• Signal Length 1: 9
• MA Type 1: EMA
• Slow MACD (MACD 2)
• Fast Length 2: 24
• Slow Length 2: 52
• Signal Length 2: 9
• MA Type 2: EMA
• Position Sizing: 100 % of equity
• Pyramiding: 1 concurrent entry per direction
Usage
1. Apply to any chart on your desired timeframe.
2. Monitor background shading (green for bullish, red for bearish bias).
3. Manage risk with your own stop loss, take profit, and position-sizing rules.
Disclaimer
This script is provided for educational purposes only. It is not financial advice or a recommendation to buy or sell any instrument. All trading involves risk, and any losses incurred are the sole responsibility of the trader.

TPC Strategy XAUUSD - M5 with Fixed SL/TPThis script implements a trend-following strategy for XAUUSD on the 5-minute chart, using 200 EMA and 21 EMA to filter direction. Entries are triggered based on RSI, MACD crossovers, and price action alignment. It includes fixed Stop Loss (15 pips) and Take Profit (22.5 pips) with visual SL/TP lines, BUY/SELL labels, and alert conditions for automated notifications. Designed for intraday scalping and low-risk entries during trending conditions.
World-Class Crypto Strategy version 9 - BTC/ETH/SOL/XRP + MLScript intended to mirror BlackRock strategies and be used with fully integrated trading bot

EMA Grid + Martingale Strategy (Long-Only) with CooldownTitle:
EMA Grid + Martingale Strategy (Long-Only) with Cooldown
Short Summary:
A long-only strategy combining EMA trend filters, grid-based entries, optional martingale sizing, and a cooldown feature to manage position timing and exits.
Full Description:
This strategy uses a 4-EMA trend confirmation system to detect bullish momentum, then deploys a grid-style entry method with optional martingale position sizing. It includes a cooldown mechanism to prevent reentry too soon after a completed trade cycle.
How It Works
1. Trend Confirmation: Two EMA groups (fast/slow) determine whether market conditions are bullish.
2. Initial Entry: A new position is entered when both EMA groups confirm an uptrend and no position is currently active.
3. Grid Entries: Additional long entries are placed when price drops by a defined pip distance from the last entry, respecting the maximum number of entries.
4. Martingale Sizing (Optional): Grid orders can increase in size with each level using a customizable multiplier.
5. Weighted-Average Exit: All positions close once price reaches or exceeds the average entry price plus a buffer.
6. Cooldown Timer: After closing a position set, the strategy waits a defined number of bars before opening a new grid.
Key Features
• 4 customizable EMAs for trend confirmation.
• Dynamic grid-style long entries based on pip intervals.
• Optional martingale-style position sizing.
• Weighted-average price exit logic with buffer control.
• Cooldown bar period to limit overtrading.
• Suitable for optimization and backtesting with full control over inputs.
Use Cases
• Designed for trending markets where pullbacks present entry opportunities.
• Helps manage staged entries while avoiding premature reentry.
• Ideal for testing martingale and grid-based strategies with exit precision.
Note: This strategy is for testing and educational purposes only. It does not guarantee profits and is not financial advice.
