Advanced Breakout System v2.0Advanced Breakout System v2.0
Developed by: Mohammed Bedaiwi
This script hunts for high-probability breakouts by combining price consolidation zones, volume spikes vs. average volume, smart money flow (OBV), and a Momentum Override for explosive moves that skip consolidation. Additionally, it automatically identifies and plots Support and Resistance levels with price labels to help you visualize market structure.
The system follows a "Watch & Confirm" logic: it first prints a WATCH setup, then a BUY only if price confirms strength.
💡 JUSTIFICATION OF CONCEPTS (MASHUP & ORIGINALITY)
This script is an original mashup combining several analytical concepts to address common breakout failures:
Volatility Compression Engine: Uses built-in functions like ta.highest() and ta.lowest() to mathematically define the setup phase where price volatility is compressed below a user-defined threshold.
Volume Spike Confirmation: The breakout must be confirmed by a volume increase greater than a moving average of volume, signaling strong market interest.
Smart Volume Filter (OBV): This is the key component. By checking if ta.obv is above its own Moving Average, we confirm that accumulation has been occurring during the consolidation period, suggesting institutional positioning before the price break.
Multi-Exit Risk System: Employs dynamic exits (EMA cross, volume dump, bearish pattern) instead of static stop-losses to manage risk adaptively based on real-time market action.
Market Structure Visualization: The script also includes a Support & Resistance engine to plot key swing pivots and price labels for visual context.
✅ STRATEGY RESULTS & POLICY COMPLIANCE
To ensure non-misleading and transparent backtesting results, this strategy is published with the following fully compliant properties:
Dataset Compliance: The backtest is performed on the CMTL Daily (1D) chart across a long history, generating 201 total trades. This significantly exceeds the minimum requirement of 100 trades, providing a robust test dataset.
Risk Control: The strategy uses a conservative order size set to 2% of equity (default_qty_value=2), strictly adhering to the sustainable risk recommendation of 5-10% of equity per trade.
Transaction Costs: Realistic trading conditions are modeled using 0.07% commission and 3 ticks slippage to prevent the overestimation of profitability.
⚙️ VISUAL GUIDE & SIGNAL LOGIC
Key Color Legend (Visual Guide):
WATCH – Setup (Yellow Arrow Down): Potential breakout setup detected.
BUY – Confirmation (Green Arrow Up): Confirmed breakout, triggered when price trades above the high of the WATCH candle.
SELL – Break (Orange Arrow): Short-term trend weakness, triggered when price closes below the Fast EMA (9).
SELL – Dump (Dark Red Arrow): Distribution / volume dump, triggered by a bearish candle with abnormally high volume.
SELL – Pattern (Purple Arrow): Bearish price-action pattern (such as a bearish engulfing).
Support & Resistance Lines (Red/Green): Small horizontal lines plotted at key swing points with exact price labels.
⌨️ INPUTS (DEFAULT SETTINGS)
Entry settings: Consolidation Lookback (default 20) = bars used to detect consolidation. Consolidation Range % (default 12%) = max allowed range size. Volume Spike Multiplier (default 1.2) = factor above average volume to count as a spike. Force Signal on Big Moves (default ON) = forces a WATCH signal on high-momentum moves.
Exit settings: Enable Fast Exit (EMA 9) toggles the SELL – Break signal. Dump Volume Multiplier defines what counts as “dump” volume.
Support & Resistance: Adjustable Pivot Left/Right bars control the sensitivity of the support and resistance lines.
⚠️ Disclaimer Trading involves significant risk of loss. This script is for educational and informational purposes only and is not financial advice or a recommendation to buy or sell any asset. BUY and SELL signals are rule-based and derived from historical behavior and do not guarantee future performance. Always use your own analysis and risk management. This is an open-source strategy; users are encouraged to test it across different symbols and timeframes.
Indicators and strategies

ALT Risk Metric StrategyHere's a professional write-up for your ALT Risk Strategy script:
ALT/BTC Risk Strategy - Multi-Crypto DCA with Bitcoin Correlation Analysis
Overview
This strategy uses Bitcoin correlation as a risk indicator to time entries and exits for altcoins. By analyzing how your chosen altcoin performs relative to Bitcoin, the strategy identifies optimal accumulation periods (when alt/BTC is oversold) and profit-taking opportunities (when alt/BTC is overbought). Perfect for traders who want to outperform Bitcoin by strategically timing altcoin positions.
Key Innovation: Why Alt/BTC Matters
Most traders focus solely on USD price, but Alt/BTC ratios reveal true altcoin strength:
When Alt/BTC is low → Altcoin is undervalued relative to Bitcoin (buy opportunity)
When Alt/BTC is high → Altcoin has outperformed Bitcoin (take profits)
This approach captures the rotation between BTC and alts that drives crypto cycles
Key Features
📊 Advanced Technical Analysis
RSI (60% weight): Primary momentum indicator on weekly timeframe
Long-term MA Deviation (35% weight): Measures distance from 150-period baseline
MACD (5% weight): Minor confirmation signal
EMA Smoothing: Filters noise while maintaining responsiveness
All calculations performed on Alt/BTC pairs for superior market timing
💰 3-Tier DCA System
Level 1 (Risk ≤ 70): Conservative entry, base allocation
Level 2 (Risk ≤ 50): Increased allocation, strong opportunity
Level 3 (Risk ≤ 30): Maximum allocation, extreme undervaluation
Continuous buying: Executes every bar while below threshold for true DCA behavior
Cumulative sizing: L3 triggers = L1 + L2 + L3 amounts combined
📈 Smart Profit Management
Sequential selling: Must complete L1 before L2, L2 before L3
Percentage-based exits: Sell portions of position, not fixed amounts
Auto-reset on re-entry: New buy signals reset sell progression
Prevents premature full exits during volatile conditions
🤖 3Commas Automation
Pre-configured JSON webhooks for Custom Signal Bots
Multi-exchange support: Binance, Coinbase, Kraken, Bitfinex, Bybit
Flexible quote currency: USD, USDT, or BUSD
Dynamic order sizing: Automatically adjusts to your tier thresholds
Full webhook documentation compliance
🎨 Multi-Asset Support
Pre-configured for popular altcoins:
ETH (Ethereum)
SOL (Solana)
ADA (Cardano)
LINK (Chainlink)
UNI (Uniswap)
XRP (Ripple)
DOGE
RENDER
Custom option for any other crypto
How It Works
Risk Metric Calculation (0-100 scale):
Fetches weekly Alt/BTC price data for stability
Calculates RSI, MACD, and deviation from 150-period MA
Normalizes MACD to 0-100 range using 500-bar lookback
Combines weighted components: (MACD × 0.05) + (RSI × 0.60) + (Deviation × 0.35)
Applies 5-period EMA smoothing for cleaner signals
Color-Coded Risk Zones:
Green (0-30): Extreme buying opportunity - Alt heavily oversold vs BTC
Lime/Yellow (30-70): Accumulation range - favorable risk/reward
Orange (70-85): Caution zone - consider taking initial profits
Red/Maroon (85-100+): Euphoria zone - aggressive profit-taking
Entry Logic:
Buys execute every candle when risk is below threshold
As risk decreases, position sizing automatically scales up
Example: If risk drops from 60→25, you'll be buying at L1 rate until it hits 50, then L2 rate, then L3 rate
Exit Logic:
Sells only trigger when in profit AND risk exceeds thresholds
Sequential execution ensures partial profit-taking
If new buy signal occurs before all sells complete, sell levels reset to L1
Configuration Guide
Choosing Your Altcoin:
Select crypto from dropdown (or use CUSTOM for unlisted coins)
Pick your exchange
Choose quote currency (USD, USDT, BUSD)
Risk Metric Tuning:
Long Term MA (default 150): Higher = more extreme signals, Lower = more frequent
RSI Length (default 10): Lower = more volatile, Higher = smoother
Smoothing (default 5): Increase for less noise, decrease for faster reaction
Buy Settings (Aggressive DCA Example):
L1 Threshold: 70 | Amount: $5
L2 Threshold: 50 | Amount: $6
L3 Threshold: 30 | Amount: $7
Total L3 buy = $18 per candle when deeply oversold
Sell Settings (Balanced Exit Example):
L1: 70 threshold, 25% position
L2: 85 threshold, 35% position
L3: 100 threshold, 40% position (final exit)
3Commas Setup
Bot Configuration:
Create Custom Signal Bot in 3Commas
Set trading pair to your altcoin/USD (e.g., ETH/USD, SOL/USDT)
Order size: Select "Send in webhook, quote" to use strategy's dollar amounts
Copy Bot UUID and Secret Token
Script Configuration:
Paste credentials into 3Commas section inputs
Check "Enable 3Commas Alerts"
Save and apply to chart
TradingView Alert:
Create Alert → Condition: "alert() function calls only"
Webhook URL: api.3commas.io
Enable "Webhook URL" checkbox
Expiration: Open-ended
Strategy Advantages
✅ Outperform Bitcoin: Designed specifically to beat BTC by timing alt rotations
✅ Capture Alt Seasons: Automatically accumulates when alts lag, sells when they pump
✅ Risk-Adjusted Sizing: Buys more when cheaper (better risk/reward)
✅ Emotional Discipline: Systematic approach removes fear and FOMO
✅ Multi-Asset: Run same strategy across multiple altcoins simultaneously
✅ Proven Indicators: Combines RSI, MACD, and MA deviation - battle-tested tools
Backtesting Insights
Optimal Timeframes:
Daily chart: Best for backtesting and signal generation
Weekly data is fetched internally regardless of display timeframe
Historical Performance Characteristics:
Accumulates heavily during bear markets and BTC dominance periods
Captures explosive altcoin rallies when BTC stagnates
Sequential selling preserves capital during extended downtrends
Works best on established altcoins with multi-year history
Risk Considerations:
Requires capital reserves for extended accumulation periods
Some altcoins may never recover if fundamentals deteriorate
Past correlation patterns may not predict future performance
Always size positions according to personal risk tolerance
Visual Interface
Indicator Panel Displays:
Dynamic color line: Green→Lime→Yellow→Orange→Red as risk increases
Horizontal threshold lines: Dashed lines mark your buy/sell levels
Entry/Exit labels: Green labels for buys, Orange/Red/Maroon for sells
Real-time risk value: Numerical display on price scale
Customization:
All threshold lines are adjustable via inputs
Color scheme clearly differentiates buy zones (green spectrum) from sell zones (red spectrum)
Line weights emphasize most extreme thresholds (L3 buy and L3 sell)
Strategy Philosophy
This strategy is built on the principle that altcoins move in cycles relative to Bitcoin. During Bitcoin rallies, alts often bleed against BTC (high sell, accumulate). When Bitcoin consolidates, alts pump (take profits). By measuring risk on the Alt/BTC chart instead of USD price, we time these rotations with precision.
The 3-tier system ensures you're always averaging in at better prices and scaling out at better prices, maximizing your Bitcoin-denominated returns.
Advanced Tips
Multi-Bot Strategy:
Run this on 5-10 different altcoins simultaneously to:
Diversify correlation risk
Capture whichever alt is pumping
Smooth equity curve through rotation
Pairing with BTC Strategy:
Use alongside the BTC DCA Risk Strategy for complete portfolio coverage:
BTC strategy for core holdings
ALT strategies for alpha generation
Rebalance between them based on BTC dominance
Threshold Calibration:
Check 2-3 years of historical data for your chosen alt
Note where risk metric sat during major bottoms (set buy thresholds)
Note where it peaked during euphoria (set sell thresholds)
Adjust for your risk tolerance and holding period
Credits
Strategy Development & 3Commas Integration: Claude AI (Anthropic)
Technical Analysis Framework: RSI, MACD, Moving Average theory
Implementation: pommesUNDwurst
Disclaimer
This strategy is for educational purposes only. Cryptocurrency trading involves substantial risk of loss. Altcoins are especially volatile and many fail completely. The strategy assumes liquid markets and reliable Alt/BTC price data. Always do your own research, understand the fundamentals of any asset you trade, and never risk more than you can afford to lose. Past performance does not guarantee future results. The authors are not financial advisors and assume no liability for trading decisions.
Additional Warning: Using leverage or trading illiquid altcoins amplifies risk significantly. This strategy is designed for spot trading of established cryptocurrencies with deep liquidity.
Tags: Altcoin, Alt/BTC, DCA, Risk Metric, Dollar Cost Averaging, 3Commas, ETH, SOL, Crypto Rotation, Bitcoin Correlation, Automated Trading, Alt Season
Feel free to modify any sections to better match your style or add specific backtesting results you've observed! 🚀Claude is AI and can make mistakes. Please double-check responses. Sonnet 4.5

BTC DCA Risk Metric StrategyBTC DCA Risk Strategy - Automated Dollar Cost Averaging with 3Commas Integration
Overview
This strategy combines the proven Oakley Wood Risk Metric with an intelligent tiered Dollar Cost Averaging (DCA) system, designed to help traders systematically accumulate Bitcoin during periods of low risk and take profits during high-risk conditions.
Key Features
📊 Multi-Component Risk Assessment
4-Year SMA Deviation: Measures Bitcoin's distance from its long-term mean
20-Week MA Analysis: Tracks medium-term momentum shifts
50-Day/50-Week MA Ratio: Captures short-to-medium term trend strength
All metrics are normalized by time to account for Bitcoin's maturing market dynamics
💰 3-Tier DCA Buy System
Level 1 (Low Risk): Conservative entry with base allocation
Level 2 (Lower Risk): Increased allocation as opportunity improves
Level 3 (Extreme Low Risk): Maximum allocation during rare buying opportunities
Buys execute every bar while risk remains below thresholds, enabling true DCA accumulation
📈 Progressive Profit Taking
Sell Level 1: Take initial profits as risk increases
Sell Level 2: Scale out further positions during elevated risk
Sell Level 3: Final exit during extreme market conditions
Sell levels automatically reset when new buy signals occur, allowing flexible re-entry
🤖 3Commas Integration
Fully automated webhook alerts for Custom Signal Bots
JSON payloads formatted per 3Commas API specifications
Supports multiple exchanges (Binance, Coinbase, Kraken, Gemini, Bybit)
Configurable quote currency (USD, USDT, BUSD)
How It Works
The strategy calculates a composite risk metric (0-1 scale):
0.0-0.2: Extreme buying opportunity (green zone)
0.2-0.5: Favorable accumulation range (yellow zone)
0.5-0.8: Neutral to cautious territory (orange zone)
0.8-1.0+: High risk, profit-taking zone (red zone)
Buy Logic: As risk decreases, position sizes increase automatically. If risk drops from L1 to L3 threshold, the strategy combines all three tier allocations for maximum exposure.
Sell Logic: Sequential profit-taking ensures you capture gains progressively. The system won't advance to Sell L2 until L1 completes, preventing premature full exits.
Configuration
Risk Metric Parameters:
All calculations use Bitcoin price data (any BTC chart works)
Time-normalized formulas adapt to market maturity
No manual parameter tuning required
Buy Settings:
Set risk thresholds for each tier (default: 0.20, 0.10, 0.00)
Define dollar amounts per tier (default: $10, $15, $20)
Fully customizable to your risk tolerance and capital
Sell Settings:
Configure risk thresholds for profit-taking (default: 1.00, 1.50, 2.00)
Set percentage of position to sell at each level (default: 25%, 35%, 40%)
3Commas Setup:
Create a Custom Signal Bot in 3Commas
Copy Bot UUID and Secret Token into strategy inputs
Enable 3Commas Alerts checkbox
Create TradingView alert: Condition → "alert() function calls only", Webhook → api.3commas.io
Backtesting Results
Strengths:
Systematically buys dips without emotion
Averages down during extended bear markets
Captures explosive bull run profits through tiered exits
Pyramiding (1000 max orders) allows true DCA behavior
Considerations:
Requires sufficient capital for multiple buys during prolonged downtrends
Backtest on Daily timeframe for most reliable signals
Past performance does not guarantee future results
Visual Design
The indicator pane displays:
Color-coded risk metric line: Changes from white→red→orange→yellow→green as risk decreases
Background zones: Green (buy), yellow (hold), red (sell) areas
Dashed threshold lines: Clear visual markers for each buy/sell level
Entry/Exit labels: Green buy labels and orange/red sell labels mark all trades
Credits
Original Risk Metric: Oakley Wood
Strategy Development & 3Commas Integration: Claude AI (Anthropic)
Modifications: pommesUNDwurst
Disclaimer
This strategy is for educational and informational purposes only. Cryptocurrency trading carries substantial risk of loss. Always conduct your own research and never invest more than you can afford to lose. The authors are not financial advisors and assume no responsibility for trading decisions made using this tool.

SuperTrend Crypto v2This is an advanced version of Supertrend with Capabilites to add TGT/SL/TSL in points and percentage.
User can also Fire Entry and exit qty in dollars seperately.
Buy logic triggers signal when supertrend turns from red to green and vice versa for short.
Added options module to fire orders in options in multiple exchanges like Delta, Coinswitch and more.
Added Indian intraday mode incase if users want to use it for Indian markets as well.

Fibonacci Vision ProFibonacci Precision Signals Pro | Smart Buy & Sell Alerts
━━━━━━━━━━━━━━━━━━━━━━━━━━━━━━━━━━━━━━━━━━━━━━━━━━━━
OVERVIEW
This indicator combines Fibonacci mathematics with advanced signal filtering to deliver precise buy and sell signals. It automatically detects swing structure, calculates the key 0.618 retracement level, and generates signals only when multiple confirmation factors align.
Clean. Accurate. Professional.
━━━━━━━━━━━━━━━━━━━━━━━━━━━━━━━━━━━━━━━━━━━━━━━━━━━━
HOW IT WORKS
The script identifies swing highs and lows, then calculates Fibonacci retracement levels automatically. When price interacts with the 0.618 zone and all filters confirm, a signal appears:
▲ buy — Long entry opportunity
▼ sell — Short entry opportunity
━━━━━━━━━━━━━━━━━━━━━━━━━━━━━━━━━━━━━━━━━━━━━━━━━━━━
6-LAYER CONFIRMATION SYSTEM
Every signal must pass through:
Trend Direction Analysis
Fibonacci Level Interaction
EMA Trend Filter (50-period default)
RSI Momentum Validation (14-period default)
Volume Spike Detection
Candlestick Pattern Recognition (Pin bars, Engulfing, Momentum candles)
This multi-layer approach significantly reduces false signals.
━━━━━━━━━━━━━━━━━━━━━━━━━━━━━━━━━━━━━━━━━━━━━━━━━━━━
BUILT-IN RISK MANAGEMENT
Every trade includes automatic stop loss and take profit levels:
Stop Loss: 100 pips
Take Profit: 200 pips
Risk-Reward Ratio: 1:2
Adjust these values in settings to match your trading style.
━━━━━━━━━━━━━━━━━━━━━━━━━━━━━━━━━━━━━━━━━━━━━━━━━━━━
KEY FEATURES
✅ Automatic Fibonacci calculation — no manual drawing
✅ Multi-timeframe compatibility — M15 to Daily
✅ Universal market support — Forex, Crypto, Stocks, Indices
✅ Clean minimalist signals — white triangles with text
✅ Customizable filters — adjust sensitivity to your preference
✅ Built-in alerts — never miss a signal
✅ No repainting — signals remain fixed once confirmed
━━━━━━━━━━━━━━━━━━━━━━━━━━━━━━━━━━━━━━━━━━━━━━━━━━━━
Swing Detection:
Swing Length — Controls sensitivity to market structure (default: 10)
Confirmation Bars — Bars required to confirm signal (default: 1)
Signal Filters:
EMA Trend Filter — Toggle trend confirmation on/off
EMA Length — Adjust trend filter period (default: 50)
RSI Filter — Toggle momentum confirmation on/off
RSI Length — Adjust momentum period (default: 14)
Volume Filter — Toggle volume confirmation on/off
Volume Multiplier — Set volume threshold (default: 1.2x average)
Risk Management:
Stop Loss Pips — Set your stop loss distance (default: 100)
Take Profit Pips — Set your profit target (default: 200)
Pip Value — Adjust for your instrument (0.0001 for most Forex, 0.01 for JPY pairs)
Visuals:
Show Signals — Toggle signal visibility
Show Cloud — Toggle Fibonacci zone visibility
━━━━━━━━━━━━━━━━━━━━━━━━━━━━━━━━━━━━━━━━━━━━━━━━━━━━
BEST PRACTICES
Use on H1 or H4 timeframes for optimal results
Trade in direction of the higher timeframe trend
Avoid trading during major news events
Combine with proper position sizing
Always use the built-in stop loss
Be patient — quality signals over quantity
━━━━━━━━━━━━━━━━━━━━━━━━━━━━━━━━━━━━━━━━━━━━━━━━━━━━
MARKETS SUPPORTED
Forex — All major, minor, and exotic pairs
Crypto — BTC, ETH, and altcoins
Stocks — Any equity on TradingView
Indices — S&P500, NASDAQ, DAX, FTSE, etc.
Commodities — Gold, Silver, Oil, etc.
━━━━━━━━━━━━━━━━━━━━━━━━━━━━━━━━━━━━━━━━━━━━━━━━━━━━
WHY FIBONACCI?
The 0.618 ratio (Golden Ratio) is observed by traders worldwide. When price retraces to this level, it often:
Reverses direction
Finds support or resistance
Creates high-probability entry opportunities
This script automates the detection of these key moments.
━━━━━━━━━━━━━━━━━━━━━━━━━━━━━━━━━━━━━━━━━━━━━━━━━━━━
ALERTS INCLUDED
Set up notifications to receive signals on:
Mobile push notifications
Desktop popups
Email alerts
Webhook integrations
Never miss a trading opportunity again.
━━━━━━━━━━━━━━━━━━━━━━━━━━━━━━━━━━━━━━━━━━━━━━━━━━━━
WHAT MAKES THIS DIFFERENT
Most indicators give too many signals. This one focuses on quality.
Most indicators clutter your chart. This one keeps it clean.
Most indicators ignore risk management. This one includes it.
Most indicators work on one market. This one works on all.
━━━━━━━━━━━━━━━━━━━━━━━━━━━━━━━━━━━━━━━━━━━━━━━━━━━━
DISCLAIMER
This indicator is a trading tool, not financial advice. Trading involves substantial risk of loss. Past performance does not guarantee future results. Always use proper risk management and never trade with money you cannot afford to lose. Test on a demo account before trading live.

Market Dynamics - Backtest Engine [NeuraAlgo]Market Dynamics – Backtest Engine
Market Dynamics – Backtest Engine is an advanced research-grade trading framework engineered by NeuraAlgo.
🔹 Core Engine – Dynamic Trend Model
The strategy leverages the NeuraAlgo – Market Dynamics indicator as its foundation, providing intelligent insights to guide trading decisions. It is designed to automatically identify the optimal settings for the NeuraAlgo – Market Dynamics indicator, helping traders fine-tune their strategy for maximum efficiency, accuracy, and profitability. This engine dynamically adapts to market conditions, ensuring your strategy stays optimized in real-time.
🔹 Optimization Engine
A built-in optimization module allows automatic testing of:
Winrate-focused configurations
Profit-focused configurations
Sensitivity ranges
Step sizes
Main Entry, Main Filter, Feature Filter, and Risk Manager categories
This enables rapid identification of optimal parameters similar to a lightweight AI optimizer.
This Backtesting + Auto Optimization Engine includes an integrated optimizer that automatically tests sensitivity ranges:
Maximize Winrate
Maximize Profits
Optimize Main Entries, Risk Manager, or Feature Filters
Users can set:
start sensitivity
step size
parameter category
The engine autonomously computes which parameter delivers the strongest performance.
🔹 How To Use
1. Identify the Parameters
First, you need to know which indicator parameters can be optimized. For the NeuraAlgo – Market Dynamics indicator, these might include:
Trend sensitivity
Smoothing periods
Threshold values for bullish/bearish signals
These parameters are the inputs your engine will test.
2. Define a Range
For each parameter, define a range of values to test. Example:
Sensitivity: 2 → 10
Trend period: 14 → 50
Threshold: 0.1 → 1.0
The more granular the range, the more precise the optimization—but it will also take longer.
3. Run Backtest Optimization
Attach the strategy to a chart.
Select optimization mode in your engine (or set the range for each parameter).
Start the backtest: the engine will simulate trades for every combination of parameter values.
The system will automatically record key metrics for each run:
Net profit
Win rate
Profit factor
Max drawdown
4. Analyze the Results
After the backtest, your engine will display a results table or chart showing performance for each parameter combination. Look for:
Highest net profit
Highest win rate
Or a combination depending on your strategy goals
Some engines will highlight the “best” parameter set automatically.
5. Apply Optimal Settings
Once identified:
Select the best-performing parameter values.
Apply them to your live strategy or paper trade.
Optionally, forward test to confirm they work on unseen market data.
Congratulations! The setup is now optimized.
🔹 Conclusion
The backtest optimization process helps you find the best parameter values for the NeuraAlgo – Market Dynamics indicator by systematically testing different settings and measuring their performance. By analyzing metrics like net profit, win rate, and drawdown, you can select optimized parameters that are more likely to perform consistently in real trading. Proper optimization ensures your strategy is data-driven, adaptable, and reduces guesswork, giving you a stronger edge in the market.

Tariq Supertrend StrategyThis Strategy which points out the best time to enter in Long Trade or Short Trade

MirrorPip ST Rolling Reversal This Strategy is a mean reversal strategy that focus on high gamma scripts.
You can set a condition for a X% move in Y candles and when that conditon is met, it will wait for supertrend to reverse.
For aggressive traders we have also added Martingale feature in it.
+ martingale is arithmatic martingale
* martingale is geometric martingale.
we have also added options mode, just incase you wish to trade in options as both buyer and seller.
The option mode also gives you flexibility to be a choose dynamic ATM/ITM/OTM strikes.
0 = ATM
LESS THAN 0 = ITM
GREATER THAN 0 = OTM
Additonal advanced settings :
We have added an optional reference supertrend, where you can refer to other script and its supertrend direction as dual confirmation.
you can even set the reference chart with other time frame than of current chart.
Also while firing order, you can fire orders in LOTS/DOLLARS.
There is a smart dashboard that helps you see the live P/L as well.

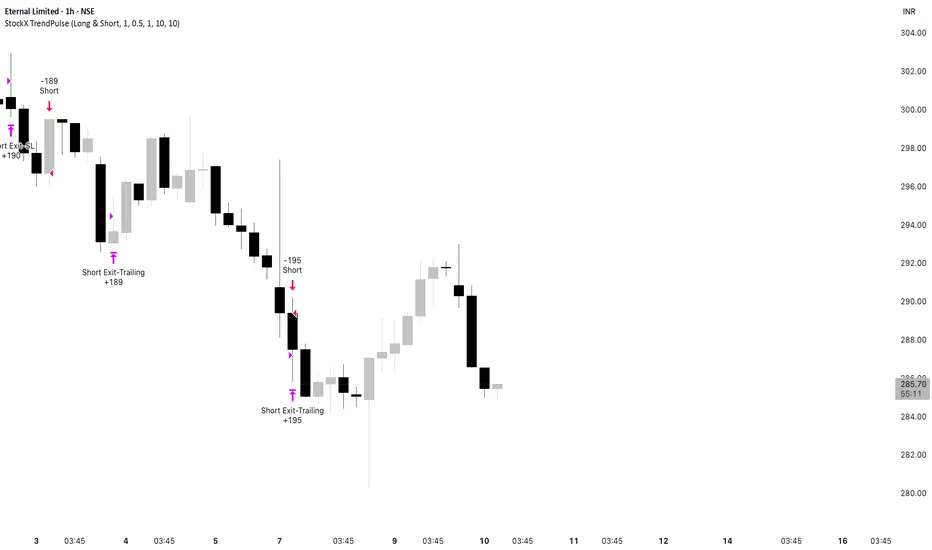
StockX TrendPulseThis is one of our premium, high-grade trading scripts built specifically for highly liquid stocks. It’s a fully automated system designed to deliver consistent performance, adapt to changing market conditions, and maintain strict risk control. With enhanced trade management and built-in performance tracking, it provides a reliable, disciplined framework for stock traders who demand precision and robustness.
StockX TrendPulse removes emotion from trading decisions and provides complete transparency through detailed performance metrics. The strategy is fully backtested and ready for live deployment.
Ready to Trade Like a Pro?
StockX TrendPulse is a premium strategy with limited availability.
Email brijamohanjha@gmail.com
to request access and pricing.
MA Strategy: Dual Entry FilterConfigurable MA Dual-Filter Strategy
This strategy is an enhanced and highly configurable Moving Average (MA) Crossover system designed to mitigate false signals and align trades with the prevailing market trend. It is built to offer traders granular control over entry criteria, elevating it beyond basic, built-in MA crossover indicators.
Originality & Key Features
The script's originality and utility lie in the combination of its two primary, optional filtering mechanics:
Dual Entry Mode (Key Filter): Users can choose between two distinct methods for trade entry:
Crossover (Classic): Immediate entry when the price crosses the main MA.
Full Candle Confirmation (Unique Feature): This mode requires the entire candle body (open, high, low, and close) to be completely above or below the main MA after a crossover event to confirm the signal before entry. This strict confirmation helps to filter out weak crossovers, reducing whipsaws in choppy markets.
Optional Trend Filter: A second, slower MA (Trend Filter MA) can be activated. Trades are only permitted when the faster main MA is aligned with the slower Trend MA (i.e., long only if main MA > Trend MA), ensuring trades are executed with the established higher-timeframe direction.
How to Use the Strategy
The strategy logic is built on simple MA principles but utilizes Pine Script's switch function to allow users to select from six different MA types for both the main signal and the trend filter: SMA, EMA, WMA, HMA, VWMA, and RMA.
Core Logic:
Signal: A cross of the price over the Main MA (filtered by the chosen Entry Mode).
Directional Filter: The Trend Filter must confirm the direction (if enabled).
Exit: Trades are exited on the opposite price crossover of the Main MA.
Customizable Settings Include:
Main MA Type & Length (Default: 40 EMA): The primary signal generator.
Trend Filter MA Type & Length (Default: 70 EMA): The optional, slower trend bias.
Entry Mode: Switch between Crossover or Full Candle Confirmation.
Strategy Results and High-Risk Disclaimer
The default setting for trade size is set to 40% of equity for backtesting demonstration purposes only. This high value is used to generate a large and diverse sample size of trades for historical review on the chart.
This 40% value is NOT a recommended setting for live trading. Per TradingView guidelines, traders are strongly advised to change this input to a sustainable risk level, typically 5% to 10% of equity per trade. Past performance is not a guarantee of future results.

Gyspy Bot Trade Engine - V1.2B - Strategy 12-7-25 - SignalLynxGypsy Bot Trade Engine (MK6 V1.2B) - Ultimate Strategy & Backtest
Brought to you by Signal Lynx | Automation for the Night-Shift Nation 🌙
1. Executive Summary & Architecture
Gypsy Bot (MK6 V1.2B) is not merely a strategy; it is a massive, modular Trade Engine built specifically for the TradingView Pine Script environment. While most strategies rely on a single dominant indicator (like an RSI cross or a MACD flip) to generate signals, Gypsy Bot functions as a sophisticated Consensus Algorithm.
The engine calculates data from up to 12 distinct Technical Analysis Modules simultaneously on every bar closing. It aggregates these signals into a "Vote Count" and only executes a trade entry when a user-defined threshold of concurring signals is met. This "Voting System" acts as a noise filter, requiring multiple independent mathematical models—ranging from volume flow and momentum to cyclical harmonics and trend strength—to agree on market direction before capital is committed.
Beyond entries, Gypsy Bot features a proprietary Risk Management suite called the Dump Protection Team (DPT). This logic layer operates independently of the entry modules, specifically scanning for "Moon" (Parabolic) or "Nuke" (Crash) volatility events to force-exit positions, overriding standard stops to preserve capital during Black Swan events.
2. ⚠️ The Philosophy of "Curve Fitting" (Must Read)
One must be careful when applying Gypsy Bot to new pairs or charts.
To be fully transparent: Gypsy Bot is, by definition, a very advanced curve-fitting engine. Because it grants the user granular control over 12 modules, dozens of thresholds, and specific voting requirements, it is extremely easy to "over-fit" the data. You can easily toggle switches until the backtest shows a 100% win rate, only to have the strategy fail immediately in live markets because it was tuned to historical noise rather than market structure.
To use this engine successfully, you must adopt a specific optimization mindset:
Ignore Raw Net Profit: Do not tune for the highest dollar amount. A strategy that makes $1M in the backtest but has a 40% drawdown is useless.
Prioritize Stability: Look for a high Profit Factor (1.5+), a high Percent Profitable, and a smooth equity curve.
Regular Maintenance is Mandatory: Markets shift regimes (e.g., from Bull Trend to Crab Range). Parameters that worked perfectly in 2021 may fail in 2024. Gypsy Bot settings should be reviewed and adjusted at regular intervals (e.g., quarterly) to ensure the voting logic remains aligned with current market volatility.
Timeframe Recommendations:
Gypsy Bot is optimized for High Time Frame (HTF) trend following. It generally produces the most reliable results on charts ranging from 1-Hour to 12-Hours, with the 4-Hour timeframe historically serving as the "sweet spot" for most major cryptocurrency assets.
3. The Voting Mechanism: How Entries Are Generated
The heart of the Gypsy Bot engine is the ActivateOrders input (found in the "Order Signal Modifier" settings).
The engine constantly monitors the output of all enabled Modules.
Long Votes: GoLongCount
Short Votes: GoShortCount
If you have 10 Modules enabled, and you set ActivateOrders to 7:
The engine will ONLY trigger a Buy Entry if 7 or more modules return a valid "Buy" signal on the same closed candle.
If only 6 modules agree, the trade is rejected.
This allows you to mix "Leading" indicators (Oscillators) with "Lagging" indicators (Moving Averages) to create a high-probability entry signal that requires momentum, volume, and trend to all be in alignment.
4. Technical Deep Dive: The 12 Modules
Gypsy Bot allows you to toggle the following modules On/Off individually to suit the asset you are trading.
Module 1: Modified Slope Angle (MSA)
Logic: Calculates the geometric angle of a moving average relative to the timeline.
Function: It filters out "lazy" trends. A trend is only considered valid if the slope exceeds a specific steepness threshold. This helps avoid entering trades during weak drifts that often precede a reversal.
Module 2: Correlation Trend Indicator (CTI)
Logic: Based on John Ehlers' work, this measures how closely the current price action correlates to a straight line (a perfect trend).
Function: It outputs a confidence score (-1 to 1). Gypsy Bot uses this to ensure that we are not just moving up, but moving up with high statistical correlation, reducing fake-outs.
Module 3: Ehlers Roofing Filter
Logic: A sophisticated spectral filter that combines a High-Pass filter (to remove long-term drift) with a Super Smoother (to remove high-frequency noise).
Function: It attempts to isolate the "Roof" of the price action. It is excellent at catching cyclical turning points before standard moving averages react.
Module 4: Forecast Oscillator
Logic: Uses Linear Regression forecasting to predict where price "should" be relative to where it is.
Function: When the Forecast Oscillator crosses its zero line, it indicates that the regression trend has flipped. We offer both "Aggressive" and "Conservative" calculation modes for this module.
Module 5: Chandelier ATR Stop
Logic: A volatility-based trend follower that hangs a "leash" (ATR multiple) from the highest high (for longs) or lowest low (for shorts).
Function: Used here as an entry filter. If price is above the Chandelier line, the trend is Bullish. It also includes a "Bull/Bear Qualifier" check to ensure structural support.
Module 6: Crypto Market Breadth (CMB)
Logic: This is a macro-filter. It pulls data from multiple major tickers (BTC, ETH, and Perpetual Contracts) across different exchanges.
Function: It calculates a "Market Health" percentage. If Bitcoin is rising but the rest of the market is dumping, this module can veto a trade, ensuring you don't buy into a "fake" rally driven by a single asset.
Module 7: Directional Index Convergence (DIC)
Logic: Analyzes the convergence/divergence between Fast and Slow Directional Movement indices.
Function: Identifies when trend strength is expanding. A buy signal is generated only when the positive directional movement overpowers the negative movement with expanding momentum.
Module 8: Market Thrust Indicator (MTI)
Logic: A volume-weighted breadth indicator. It uses Advance/Decline data and Up/Down Volume data.
Function: This is one of the most powerful modules. It confirms that price movement is supported by actual volume flow. We recommend using the "SSMA" (Super Smoother) MA Type for the cleanest signals on the 4H chart.
Module 9: Simple Ichimoku Cloud
Logic: Traditional Japanese trend analysis using the Tenkan-sen and Kijun-sen.
Function: Checks for a "Kumo Breakout." Price must be fully above the Cloud (for longs) or below it (for shorts). This is a classic "trend confirmation" module.
Module 10: Simple Harmonic Oscillator
Logic: Analyzes the harmonic wave properties of price action to detect cyclical tops and bottoms.
Function: Serves as a counter-trend or early-reversal detector. It tries to identify when a cycle has bottomed out (for buys) or topped out (for sells) before the main trend indicators catch up.
Module 11: HSRS Compression / Super AO
Logic: Two options in one.
HSRS: Hirashima Sugita Resistance Support. Detects volatility compression (squeezes) relative to dynamic support/resistance bands.
Super AO: A combination of the Awesome Oscillator and SuperTrend logic.
Function: Great for catching explosive moves that result from periods of low volatility (consolidation).
Module 12: Fisher Transform (MTF)
Logic: Converts price data into a Gaussian normal distribution.
Function: Identifies extreme price deviations. This module uses Multi-Timeframe (MTF) logic to look at higher-timeframe trends (e.g., looking at the Daily Fisher while trading the 4H chart) to ensure you aren't trading against the major trend.
5. Global Inhibitors (The Veto Power)
Even if 12 out of 12 modules vote "Buy," Gypsy Bot performs a final safety check using Global Inhibitors. If any of these are triggered, the trade is blocked.
Bitcoin Halving Logic:
Hardcoded dates for past and projected future Bitcoin halvings (up to 2040).
Trading is inhibited or restricted during the chaotic weeks immediately surrounding a Halving event to avoid volatility crushes.
Miner Capitulation:
Uses Hash Rate Ribbons (Moving averages of Hash Rate).
If miners are capitulating (Shutting down rigs due to unprofitability), the engine flags a "Bearish" regime and can flip logic to Short-only or flat.
ADX Filter (Flat Market Protocol):
If the Average Directional Index (ADX) is below a specific threshold (e.g., 20), the market is deemed "Flat/Choppy." The bot will refuse to open trend-following trades in a flat market.
CryptoCap Trend:
Checks the total Crypto Market Cap chart. If the broad market is in a downtrend, it can inhibit Long entries on individual altcoins.
6. Risk Management & The Dump Protection Team (DPT)
Gypsy Bot separates "Entry Logic" from "Risk Management Logic."
Dump Protection Team (DPT)
This is a specialized logic branch designed to save the account during Black Swan events.
Nuke Protection: If the DPT detects a volatility signature consistent with a flash crash, it overrides all other logic and forces an immediate exit.
Moon Protection: If a parabolic pump is detected that violates statistical probability (Bollinger deviations), DPT can force a profit take before the inevitable correction.
Advanced Adaptive Trailing Stop (AATS)
Unlike a static trailing stop (e.g., "trail by 5%"), AATS is dynamic.
Penthouse Level: If price is at the top of the HSRS channel (High Volatility), the stop loosens to allow for wicks.
Dungeon Level: If price is compressed at the bottom, the stop tightens to protect capital.
Staged Take Profits
TP1: Scalp a portion (e.g., 10%) to cover fees and secure a win.
TP2: Take the bulk of profit.
TP3: Leave a "Runner" position with a loose trailing stop to catch "Moon" moves.
7. Recommended Setup Guide
When applying Gypsy Bot to a new chart, follow this sequence:
Set Timeframe: 4 Hours (4H).
Reset: Turn OFF Trailing Stop, Stop Loss, and Take Profits. (We want to see raw entry performance first).
Tune DPT: Adjust "Dump/Moon Protection" inputs first. These have the highest impact on net performance.
Tune Module 8 (MTI): This module is a heavy filter. Experiment with the MA Type (SSMA is recommended).
Select Modules: Enable/Disable modules 1-12 based on the asset's personality (Trending vs. Ranging).
Voting Threshold: Adjust ActivateOrders. A lower number = More Trades (Aggressive). A higher number = Fewer, higher conviction trades (Conservative).
Final Polish: Re-enable Stop Losses, Trailing Stops, and Staged Take Profits to smooth the equity curve and define your max risk per trade.
8. Technical Specs
Engine Version: Pine Script V6
Repainting: This strategy uses Closed Candle data for all Risk Management and Entry decisions. This ensures that Backtest results align closely with real-time behavior (no repainting of historical signals).
Alerts: This script generates Strategy alerts. If you require visual-only alerts, see the source code header for instructions on switching to "Study" (Indicator) mode.
Disclaimer:
This script is a complex algorithmic tool for market analysis. Past performance is not indicative of future results. Use this tool to assist your own decision-making, not to replace it.
9. About Signal Lynx
Automation for the Night-Shift Nation 🌙
Signal Lynx focuses on helping traders and developers bridge the gap between indicator logic and real-world automation. The same RM engine you see here powers multiple internal systems and templates, including other public scripts like the Super-AO Strategy with Advanced Risk Management.
We provide this code open source under the Mozilla Public License 2.0 (MPL-2.0) to:
Demonstrate how Adaptive Logic and structured Risk Management can outperform static, one-layer indicators
Give Pine Script users a battle-tested RM backbone they can reuse, remix, and extend
If you are looking to automate your TradingView strategies, route signals to exchanges, or simply want safer, smarter strategy structures, please keep Signal Lynx in your search.
License: Mozilla Public License 2.0 (Open Source).
If you make beneficial modifications, please consider releasing them back to the community so everyone can benefit.

ChronoPulse MS-MACD Resonance StrategyChronoPulse MS-MACD Resonance Strategy
A systematic trading strategy that combines higher-timeframe market structure analysis with dual MACD momentum confirmation, ATR-based risk management, and real-time quality assurance monitoring.
Core Principles
The strategy operates on the principle of multi-timeframe confluence, requiring agreement between:
Market structure breaks (CHOCH/BOS) on a higher timeframe
Dual MACD momentum confirmation (classic and crypto-tuned profiles)
Trend alignment via directional EMAs
Volatility and volume filters
Quality score composite threshold
Strategy Components
Market Structure Engine : Detects Break of Structure (BOS) and Change of Character (CHOCH) events using confirmed pivots on a configurable higher timeframe. Default structure timeframe is 240 minutes (4H).
Dual MACD Fusion : Requires agreement between two MACD configurations:
Classic MACD: 12/26/9 (default)
Fusion MACD: 8/21/5 (default, optimized for crypto volatility)
Both must agree on direction before trade execution. This can be disabled to use single MACD confirmation.
Trend Alignment : Uses two EMAs for directional bias:
Directional EMA: 55 periods (default)
Execution Trend Guide: 34 periods (default)
Both must align with trade direction.
ATR Risk Management : All risk parameters are expressed in ATR multiples:
Stop Loss: 1.5 × ATR (default)
Take Profit: 3.0 × ATR (default)
Trail Activation: 1.0 × ATR profit required (default)
Trail Distance: 1.5 × ATR behind price (default)
Volume Surge Filter : Optional gate requiring current volume to exceed a multiple of the volume SMA. Default threshold is 1.4× the 20-period volume SMA.
Quality Score Gate : Composite score (0-1) combining:
Structure alignment (0.0-1.0)
Momentum strength (0.0-1.0)
Trend alignment (0.0-1.0)
ATR volatility score (0.0-1.0)
Volume intensity (0.0-1.0)
Default threshold: 0.62. Trades only execute when quality score exceeds this threshold.
Execution Discipline : Trade budgeting system:
Maximum trades per session: 6 (default)
Cooldown bars between entries: 5 (default)
Quality Assurance Console : Real-time monitoring panel displaying:
Structure status (pass/fail)
Momentum confirmation (pass/fail)
Volatility readiness (pass/fail)
Quality score (pass/fail)
Discipline compliance (pass/fail)
Performance metrics (win rate, profit factor)
Net PnL
Certification requires: Win Rate ≥ 40%, Profit Factor ≥ 1.4, Minimum 25 closed trades, and positive net profit.
Integrity Suite : Optional validation panel that audits:
Configuration sanity checks
ATR data readiness
EMA hierarchy validity
Performance realism checks
Strategy Settings
strategy(
title="ChronoPulse MS-MACD Resonance Strategy",
shorttitle="ChronPulse",
overlay=true,
max_labels_count=500,
max_lines_count=500,
initial_capital=100000,
currency=currency.USD,
pyramiding=0,
commission_type=strategy.commission.percent,
commission_value=0.015,
slippage=2,
default_qty_type=strategy.percent_of_equity,
default_qty_value=2.0,
calc_on_order_fills=true,
calc_on_every_tick=true,
process_orders_on_close=true
)
Key Input Parameters
Structure Timeframe : 240 (4H) - Higher timeframe for structure analysis
Structure Pivot Left/Right : 3/3 - Pivot confirmation periods
Structure Break Buffer : 0.15% - Buffer for structure break confirmation
MACD Fast/Slow/Signal : 12/26/9 - Classic MACD parameters
Fusion MACD Fast/Slow/Signal : 8/21/5 - Crypto-tuned MACD parameters
Directional EMA Length : 55 - Primary trend filter
Execution Trend Guide : 34 - Secondary trend filter
ATR Length : 14 - ATR calculation period
ATR Stop Multiplier : 1.5 - Stop loss in ATR units
ATR Target Multiplier : 3.0 - Take profit in ATR units
Trail Activation : 1.0 ATR - Profit required before trailing
Trail Distance : 1.5 ATR - Distance behind price
Volume Threshold : 1.4× - Volume surge multiplier
Quality Threshold : 0.62 - Minimum quality score (0-1)
Max Trades Per Session : 6 - Daily trade limit
Cooldown Bars : 5 - Bars between entries
Win-Rate Target : 40% - Minimum for QA certification
Profit Factor Target : 1.4 - Minimum for QA certification
Minimum Trades for QA : 25 - Required closed trades
Signal Generation Logic
A trade signal is generated when ALL of the following conditions are met:
Higher timeframe structure shows bullish (CHOCH/BOS) or bearish structure break
Both MACD profiles agree on direction (if fusion enabled)
Price is above both EMAs for longs (below for shorts)
ATR data is ready and above minimum threshold
Volume exceeds threshold × SMA (if volume gate enabled)
Quality score ≥ quality threshold
Trade budget available (under max trades per day)
Cooldown period satisfied
Risk Management
Stop loss and take profit are set immediately on entry
Trailing stop activates after 1.0 ATR of profit
Trailing stop maintains 1.5 ATR distance behind highest profit point
Position sizing uses 2% of equity per trade (default)
No pyramiding (single position per direction)
Limitations and Considerations
The strategy requires sufficient historical data for higher timeframe structure analysis
Quality gate may filter out many potential trades, reducing trade frequency
Performance metrics are based on historical backtesting and do not guarantee future results
Commission and slippage assumptions (0.015% + 2 ticks) may vary by broker
The strategy is optimized for trending markets with clear structure breaks
Choppy or ranging markets may produce false signals
Crypto markets may require different parameter tuning than traditional assets
Optimization Notes
The strategy includes several parameters that can be tuned for different market conditions:
Quality Threshold : Lower values (0.50-0.60) allow more trades but may reduce average quality. Higher values (0.70+) are more selective but may miss opportunities.
Structure Timeframe : Use 240 (4H) for intraday trading, Daily for swing trading, Weekly for position trading
Volume Gate : Disable for low-liquidity pairs or when volume data is unreliable
Dual MACD Fusion : Disable for mean-reverting markets where single MACD may be more responsive
Trade Discipline : Adjust max trades and cooldown based on your risk tolerance and market volatility
Non-Repainting Guarantee
All higher timeframe data requests use lookahead=barmerge.lookahead_off to prevent repainting. Pivot detection waits for full confirmation before registering structure breaks. All visual elements (tables, labels) update only on closed bars.
Alerts
Three alert conditions are available:
ChronoPulse Long Setup : Fires when all long entry conditions are met
ChronoPulse Short Setup : Fires when all short entry conditions are met
ChronoPulse QA Certification : Fires when Quality Assurance console reaches CERTIFIED status
Configure alerts with "Once Per Bar Close" delivery to match the non-repainting design.
Visual Elements
Structure Labels : CHOCH↑, CHOCH↓, BOS↑, BOS↓ markers on structure breaks
Directional EMA : Orange line showing trend bias
Trailing Stop Lines : Green (long) and red (short) trailing stop levels
Dashboard Panel : Real-time status display (structure, MACD, ATR, quality, PnL)
QA Console : Quality assurance monitoring panel
Integrity Suite Panel : Optional validation status display
Recommended Usage
Forward test with paper trading before live deployment
Monitor the QA console until it reaches CERTIFIED status
Adjust parameters based on your specific market and timeframe
Respect the trade discipline limits to avoid over-trading
Review quality scores and adjust threshold if needed
Use appropriate commission and slippage settings for your broker
Technical Implementation
The strategy uses Pine Script v6 with the following key features:
Multi-timeframe data requests with lookahead protection
Confirmed pivot detection for structure analysis
Dynamic trailing stop management
Real-time quality score calculation
Trade budgeting and cooldown enforcement
Comprehensive dashboard and monitoring panels
All source code is open and available for review and modification.
Disclaimer
This script is for educational and informational purposes only. It is not intended as financial, investment, or trading advice. Past performance does not guarantee future results. Trading involves substantial risk of loss and is not suitable for all investors. Always conduct your own research and consult with a qualified financial advisor before making any trading decisions. The author and TradingView are not responsible for any losses incurred from using this strategy.


VWolf – Slope GuardOVERVIEW
Slope Guard combines a momentum core (WaveTrend + RSI/MFI + QQE family) with a directional bias (EMA/DEMA and a DEMA-slope filter). Trade direction can be constrained by the Supertrend regime (Normal or Pivot). Risk is managed with ATR-based stops and targets, optional Supertrend-anchored dynamic levels, and a two-stage take-profit that can shift the stop to break-even after the first partial. The strategy supports explicit Backtest and Forward-test windows and adapts certain thresholds by market type (Forex vs. Stocks).
RECOMMENDED USE
Markets: Forex and equities; use Market Type to properly scale the DEMA-slope gate.
Timeframes: M15–H4 for intraday-swing and H1–D1 for slower swing; avoid ultra-low TFs without tightening ADX/QQE.
Assets: Instruments with persistent trends and orderly pullbacks; avoid flat ranges without sufficient ADX.
Strengths
Multi-layer confluence: trend bias + momentum + regime + strength.
Flexible risk engine: ATR vs. Supertrend anchoring, staged exits, and automatic break-even.
Clean research workflow: separated Backtest and Forward-test windows.
Precautions
Structural latency: Pivot-based constructs confirm with delay; validate with Forward-test.
Filter interaction: QQE Strict + ADX + WT zero-line can become overly selective; calibrate by asset/TF.
Overfitting risk: Prefer simple, portable parameter sets and validate across symbols/TFs.
CONCLUSION
Slope Guard is a “trend + momentum” framework with risk control at its core. By enforcing a baseline bias, validating momentum with the Vuman composite, and offering ATR or Supertrend-anchored exits—plus staged profits and break-even shifts—it seeks to capture the core of directional swings while compressing drawdowns. Keep testing windows isolated, start with moderate filters (QQE Normal, ADX ~20–25), and only add stricter gates (WT zero-line, DEMA slope) once they demonstrably improve stability without starving signals.
FOR MORE INFORMATION VISIT vwolftrading.com

VWolf - Shadow PulseOVERVIEW
The Trend Momentum Breakout Strategy is a rule-based trading system designed to identify high-probability entries in trending markets using a combination of trend confirmation, momentum filtering, and precise trigger conditions. The strategy is suitable for intermediate to advanced traders who prefer mechanical systems with clear entry/exit logic and configurable risk management options.
At its core, this strategy seeks to enter pullbacks within strong trends, capitalizing on momentum continuation after brief pauses in price movement. By integrating multiple moving averages (MAs) for trend validation, ADX (Average Directional Index) as a strength filter, and Stochastic RSI as an entry trigger, the strategy filters out weak trends and avoids overextended market conditions. Exit logic is based on a customizable fixed stop-loss (SL) and take-profit (TP) framework, with optional dynamic risk-reduction mechanisms powered by the Supertrend indicator.
This strategy is designed to perform best in clearly trending markets and is especially effective in avoiding false breakouts or choppy sideways action thanks to its ADX-based filtering. It can be deployed across a variety of asset classes, including forex, stocks, cryptocurrencies, and indices, and is optimized for intra-day to swing trading timeframes.
RECOMMENDED USE
This strategy is designed to be flexible across multiple markets, but it performs best under certain conditions:
Best Suited For:
Trending markets with clear directional momentum.
High-volume instruments that avoid erratic price action.
Assets with intraday volatility and swing patterns.
Recommended Asset Classes:
Forex pairs (e.g., EUR/USD, GBP/JPY)
Cryptocurrencies (e.g., BTC/USD, ETH/USDT)
Major indices (e.g., S&P 500, NASDAQ, DAX)
Large-cap stocks (especially those with consistent liquidity)
Suggested Timeframes:
15-minute to 1-hour charts for intraday setups.
4-hour and daily charts for swing trading.
Lower timeframes (1–5 min) may generate too much noise unless fine-tuned.
Market Conditions to Avoid:
Ranging or sideways markets with low ADX values.
Assets with irregular price structures or low liquidity.
News-heavy periods with unpredictable price spikes.
CONCLUSION
This strategy stands out for its robust and modular approach to trend-following trading, offering a high level of customization while maintaining clear logic and structural discipline in entries and exits. By combining three distinct layers of confirmation—trend identification (via configurable moving averages), trend strength validation (via the DMI filter), and timing (via the Stochastic RSI trigger)—it aims to reduce noise and increase the probability of entering trades with directional bias and momentum on its side.
Its flexibility is one of its strongest points: users can tailor the strategy to fit various trading styles and market conditions. Whether the trader prefers conservative setups using only the slowest moving average, or more aggressive entries requiring full alignment of fast, medium, and slow MAs, the system adjusts accordingly. Likewise, exit management offers both static and dynamic methods—such as ATR-based stop losses, Supertrend-based adaptive exits, and partial profit-taking mechanisms—allowing risk to be managed with precision.
This makes the strategy particularly suitable for trend-driven markets, such as major currency pairs, indices, or volatile stocks that demonstrate clear directional moves. It is not ideal for sideways or choppy markets, where multiple filters may reduce the number of trades or result in whipsaws.
From a practical standpoint, the strategy also incorporates real-world trading mechanics, like time-based filters and account risk control, which elevate it from a purely theoretical model to a more execution-ready system.
In summary, this is a well-structured, modular trend strategy ideal for intermediate to advanced traders who want to maintain control over their system parameters while still benefiting from layered signal confirmation. With proper calibration, it has the potential to become a reliable tool in any trader’s arsenal—particularly in markets where trends emerge clearly and sustainably.
FOR MORE INFORMATION VISIT vwolftrading.com

VWolf - Raptor ClawOVERVIEW
The 'VWolf - Raptor Claw' is a straightforward scalping strategy designed for high-frequency trades based on the Stochastic RSI indicator. It focuses exclusively on identifying potential trend reversals through stochastic cross signals in extreme zones, without the need for additional confirmations. This makes it highly responsive to market movements, capturing rapid price shifts while maintaining simplicity.
This strategy is best suited for highly liquid and volatile markets like forex, indices, and major cryptocurrencies, where quick momentum shifts are common. It is ideal for experienced scalpers who prioritize fast entries and exits, but it can also be adapted for swing trading in lower timeframes.
Entry Conditions:
Long Entry:Stochastic RSI crosses above the oversold threshold (typically 20), indicating a potential bullish reversal.
Short Entry:Stochastic RSI crosses below the overbought threshold (typically 80), indicating a potential bearish reversal.
Exit Conditions:
Stop Loss: Set at the minimum (for longs) or maximum (for shorts) within a configurable lookback window to reduce risk.
Take Profit: Defined by a risk-reward ratio (RRR) input to optimize potential gains relative to risk.
CONCLUSION
The 'VWolf - Raptor Claw' strategy is perfect for traders seeking a simple yet aggressive approach to the markets. It capitalizes on sharp momentum shifts in extreme zones, relying on precise stop loss and take profit settings to capture rapid profits while minimizing risk. This approach is highly effective in high-volatility environments where quick decision-making is essential.
FOR MORE INFORMATION VISIT vwolftrading.com

VWolf - Quantum DriftOVERVIEW
The Quantum Drift strategy is a sophisticated, highly customizable trading approach designed to identify market entries and exits by leveraging multiple technical indicators. The strategy uniquely combines the Dynamic Exponential Moving Average (DEMA), QQE indicators, Volume Oscillator, and Hull Moving Average (HULL), enabling precise detection of trend direction, momentum shifts, and volatility adjustments. It stands out due to its adaptability across different market conditions by allowing significant user customization through various input parameters.
RECOMMENDED USE
Markets: Ideal for Forex and Stocks due to the strategy's volatility-sensitive and trend-following nature.
Timeframes: Best suited for medium to higher timeframes (15m, 1H, 4H), where clearer trend signals and less noise occur, enhancing strategy reliability.
CONCLUSION
The Quantum Drift strategy is tailored for intermediate to advanced traders seeking a versatile and adaptive system. Its strength lies in combining momentum, volatility, and trend-following components, providing robust entry and exit signals. However, its effectiveness relies significantly on accurate parameter tuning by traders familiar with the underlying indicators and market behavior.
FOR MORE INFORMATION VISIT vwolftrading.com

VWolf – Pivot VumanSkewOVERVIEW
This strategy blends a lightweight trend scaffold (EMA/DEMA) with a skew-of-volatility filter and VuManchu/WaveTrend momentum signals. It’s designed to participate only when trending structure, momentum alignment, and volatility asymmetry converge, while delegating execution management to either a standard SuperTrend or a Pivot-based SuperTrend. Position sizing is risk‑based, with optional two‑step profit taking and automatic stop movement once price confirms in favor.
RECOMMENDED USE
Markets: Designed for Forex and equities, and readily adaptable to indices or liquid futures.
Timeframes: Performs best from 15m to 4h where momentum and trend layers both matter; daily can be used for confirmation/context.
Conditions: Trending or range‑expansion phases with clear volatility asymmetry. Avoid extremely compressed sessions unless thresholds are relaxed.
Strengths
Multi‑layer confluence (trend + skew + momentum) reduces random signals.
Dual SuperTrend modes provide flexible trailing and regime control.
Built‑in hygiene (ADX/DMI, lockout after loss, ATR gap) curbs over‑trading.
Risk‑% sizing and two‑step exits support consistent, plan‑driven execution.
Precautions
Over‑tight thresholds can lead to missed opportunities; start from defaults and tune gradually.
High sensitivity in momentum settings may overfit to a single instrument/timeframe.
In very low volatility, ATR‑gap or skew filters may block entries—consider adaptive thresholds.
CONCLUSION
VWolf – Pivot VumanSkew is a disciplined trend‑participation strategy that waits for directional structure, volatility asymmetry, and synchronized momentum before acting. Its execution layer—selectable between Normal and Pivot SuperTrend—keeps management pragmatic: scale out early when appropriate, trail intelligently, and defend capital with volatility‑aware stops. For users building a diversified playbook, Pivot VumanSkew serves as a trend‑continuation workhorse that can be tightened for precision or relaxed for higher participation depending on the market’s rhythm.

VWolf – Momentum TwinOVERVIEW
VWolf – Momentum Twin is designed to identify high-probability momentum reversals emerging from overbought or oversold market conditions. It employs a double confirmation from the Stochastic RSI oscillator, optionally filtered by trend and directional movement conditions, before executing trades.
The strategy emphasizes consistent risk management by scaling stop-loss and take-profit targets according to market volatility (ATR), and it provides advanced position management features such as partial profit-taking and automated stop-loss adjustments.
RECOMMENDED USE
Markets: Major FX pairs, index futures, large-cap stocks, and top-volume cryptocurrencies.
Timeframes: Best suited for M15–H4; adaptable for swing trading on daily charts.
Trader Profile: Traders who value structured, volatility-adjusted momentum reversal setups.
Strengths:
Double confirmation filters out many false signals.
Multiple filter options allow strategic flexibility.
ATR scaling maintains consistent risk across assets.
Trade management tools improve adaptability in dynamic markets.
Precautions:
May produce fewer trades in strong one-direction trends.
Over-filtering can reduce trade frequency.
Requires validation across instruments and timeframes before deployment.
CONCLUSION
The VWolf – Momentum Twin offers a disciplined framework for capturing momentum reversals while preserving flexibility through its customizable filters and risk controls. Its double confirmation logic filters out a significant portion of false reversals, while ATR-based scaling ensures consistency across varying market conditions. The optional trade management features, including partial profit-taking and automatic stop adjustments, allow the strategy to adapt to both trending and ranging environments. This makes it a versatile tool for traders who value structured entries, robust risk control, and adaptable management in a variety of markets and timeframes.

VWolf – Hull VectorOVERVIEW
VWolf – Hull Vector is a momentum-driven trend strategy centered on the Hull Moving Average (HMA) angle. It layers optional confirmations from EMA/DEMA alignment, DMI/ADX strength, and Supertrend triggers to filter lower-quality entries and improve trade quality.
Risk is controlled through capital-based position sizing, ATR-anchored stops and targets, and dynamic trade management (partial exits and stop movement). The strategy supports Backtest and Forwardtest modes with configurable date ranges, and a market profile toggle (Forex vs. Stocks) to adjust internal scaling for price behavior.
RECOMMENDED USE
Markets: Major Forex pairs, index CFDs/futures, and liquid stocks with clean trend legs.
Styles: Intraday and swing applications where momentum continuation is common.
Volatility Regimes: Performs best in trending or expanding-volatility environments; consider tightening thresholds in choppy phases.
Workflow Tips:Start with HMA angle + ST trigger only; then layer DEMA and DMI/ADX if you need more selectivity.
Use Forwardtest dates to simulate out-of-sample performance after tuning Backtest parameters.
Re-evaluate angle thresholds when switching between Forex and Stocks modes.
Strengths
Clear momentum core (HMA angle) with optional, orthogonal filters (trend alignment, strength, trigger).
Robust risk tooling: ATR/ST stops, two-step profits, and capital-based sizing.
Testing discipline: Native Backtest/Forwardtest scoping supports walk-forward validation.
Broad portability: Works across instruments thanks to market-aware scaling.
Precautions
Over-filtering risk: Enabling all gates simultaneously may under-trade; calibrate selectivity to your timeframe.
Sideways markets: Expect more whipsaws when slope hovers near zero; raise angle threshold or rely more on ADX gating.
Overfitting hazard: Tune on one regime, then verify with Forwardtest windows and alternative markets/timeframes.

VWolf – Hulk StrikeOVERVIEW
VWolf – Hullk Strike is a dynamic trend-following strategy designed to capture pullbacks within established moves. It combines a configurable Moving Average (HULL, EMA, SMA, or DEMA) trend filter with DMI/ADX confirmation and a Stochastic RSI timing trigger. Risk is managed through ATR- or Supertrend-based stops, optional partial profit-taking, and automatic stop adjustments. The strategy aims to rejoin momentum after controlled retracements while maintaining consistent, quantified risk
RECOMMENDED USE
Markets: Liquid indices, major FX pairs, large-cap equities, high-liquidity crypto pairs.
Timeframes: M15 to D1 (stricter filters for lower timeframes, looser for higher).
Profiles: Traders seeking structured trend participation with systematic timing.
Strengths
Highly flexible trend engine adaptable to multiple markets.
Dual confirmation reduces false signals during pullbacks.
Risk-first design with multiple stop models and partial exits.
Precautions
Over-filtering may reduce trade frequency and miss fast continuations.
Under-filtering may increase whipsaw risk in choppy markets.
Backtest vs forward-test differences if date/session filters are inconsistent.
CONCLUSION
VWolf – Hullk Strike is designed to capture the “second leg” of a trend after a controlled retracement. With configurable MA strictness, DMI/ADX strength filters, and precise Stoch RSI timing, it enhances selectivity while keeping responsiveness. Its stop/target framework—anchored stops, proportional targets, partial exits, and dynamic stop moves—offers disciplined risk control and upside preservation.
FOR MORE INFORMATION VISIT vwolftrading.com

VWolf – EquinoxOVERVIEW
The VWolf – Equinox strategy integrates multiple technical filters, skew deviation logic, and advanced momentum indicators to identify high-probability trend continuation and reversal setups. Built upon the Vumanchu framework, this strategy applies filters such as EMA, DEMA, Supertrend, QQE, ADX/DMI, and customized skew thresholds. It combines these with divergence detection, volatility conditions, and risk-managed trade execution for dynamic adaptability across market conditions.
Its architecture is designed to provide flexibility for both backtesting and forward testing periods, while allowing traders to fine-tune entry confirmations and risk management tools based on their preferred market or timeframe.
RECOMMENDED USE
Markets: Forex, equities, and potentially crypto markets due to skew/volatility adaptability.
Timeframes: Works best on intraday (15m–1H) and swing-trading (4H–1D) horizons.
Trader Profile: Suited for intermediate to advanced traders who value multiple confirmation layers and dynamic risk management.
Strengths:
Robust filter system reduces false signals.
Flexible exit strategies with dynamic profit-taking.
Adaptability across different assets and timeframes.
Precautions:
Complexity may overwhelm beginners; careful parameter tuning is recommended.
Too many active filters can reduce signal frequency, potentially missing opportunities.
Divergence and skew thresholds require calibration to each market’s volatility regime.
CONCLUSION
The VWolf – Equinox stands out as one of the most comprehensive strategies in the VWolf library, combining skew deviation with a wide array of technical filters. Its layered confirmation system reduces noise and improves reliability across volatile markets. While powerful, its effectiveness depends on thoughtful parameter selection and disciplined risk management. This makes it a strong candidate for experienced traders seeking depth, adaptability, and dynamic trade control.
FOR MORE INFORMATION VISIT vwolftrading.com

VWolf - Basic EdgeOVERVIEW
VWolf - Basic Edge is a clean and accessible crossover strategy built on the core principle of moving average convergence. Designed for simplicity and ease of use, it allows traders to select from multiple types of moving averages—including EMA, SMA, HULL, and DEMA—and defines entry points strictly based on the crossover of two user-defined MAs.
This strategy is ideal for traders seeking a minimal, no-frills trend-following system with flexible exit conditions. Upon crossover in the selected direction (e.g., fast MA crossing above slow MA for a long entry), the strategy opens a trade and then manages the exit based on the user’s chosen method:
Signal-Based Exit:Trades are closed on the opposite crossover signal (e.g., long is exited when the fast MA crosses below the slow MA).
Fixed SL/TP Exit:The trade is closed based on fixed Stop Loss and Take Profit levels.Both SL and TP values are customizable via the strategy’s input settings.Once either the TP or SL is reached, the position is exited.
Additional filters such as date ranges and session times are available for backtesting control, but no extra indicators are used—staying true to the “basic edge” philosophy. This strategy works well as a starting framework for beginners or as a reliable, lightweight system for experienced traders wanting clean, rule-based entries and exits.
RECOMMENDED FOR
- Beginner to intermediate traders who want a transparent and easy-to-follow system.
- Traders looking to understand or build upon classic moving average crossover logic.
- Users who want a customizable but uncluttered strategy framework.
🌍 Markets & Instruments:
Well-suited for liquid and trending markets, including:Major forex pairs
Stock indices
Commodities (e.g., gold, oil)
Cryptocurrencies with stable trends (e.g., BTC, ETH)
⏱ Recommended Timeframes:
Performs best on higher intraday or swing trading timeframes, such as:15m, 1h, 4h, and 1D
Avoid low-timeframe noise (e.g., 1m, 3m) unless paired with strict filters or volatility controls.
FOR MORE INFORMATION VISIT vwolftrading.com
