Range Strategy (kasatura84)Winning Range Strategy (Set Heikin Ashi Candles)
Incredible winning strategy. You have to set Heikin Ashi Candles to activate strategy! It works both long and short trades.
Pine utilities

ROLLING REVERSAL FROM TOP/BOTTOMThis strategy helps users who want to find mean reversion in those scripts that have gone up/down by significant margin.
Users can set a percentage by which if a coin/script moves up/down by then supertrend becomes active, and the trades are taken on the reversal side.
For additional option we have added a reference symbol and custom time frame to be checked before taking the trade.
This can be fully automated with most crypto exchanges.

2 Dip/Tepe + Destek/Direnç + Tek Sinyal Stratejisi⭐ A Brief Summary of What the Strategy Does
🎯 1) Market analysis is being released (bottom-top analysis)
It automatically finds pivot bottoms and pivot tops on the strategic chart. Then:
If the bottoms are rising (HL – High Low): the trend is upward
If the tops are falling (LH – Lower High): the trend is downward
it interprets this.
🎯 2) Support and resistance lines are formed
Last pivot top = resistance line
Last pivot bottom = support line
These lines are automatically drawn on the chart.
🎯 3) Breakout is expected according to the trend structure
For LONG:
The last two bottoms will be rising bottoms
The price will rise above the last resistance line
This gives a single LONG signal.
For SHORT:
The last two peaks will be falling peaks
The price will fall below the support line
This gives a single SHORT signal.

SuperTrend Crypto v2This is an advanced version of Supertrend with Capabilites to add TGT/SL/TSL in points and percentage.
User can also Fire Entry and exit qty in dollars seperately.
Buy logic triggers signal when supertrend turns from red to green and vice versa for short.
Added options module to fire orders in options in multiple exchanges like Delta, Coinswitch and more.
Added Indian intraday mode incase if users want to use it for Indian markets as well.

MirrorPip ST Rolling Reversal This Strategy is a mean reversal strategy that focus on high gamma scripts.
You can set a condition for a X% move in Y candles and when that conditon is met, it will wait for supertrend to reverse.
For aggressive traders we have also added Martingale feature in it.
+ martingale is arithmatic martingale
* martingale is geometric martingale.
we have also added options mode, just incase you wish to trade in options as both buyer and seller.
The option mode also gives you flexibility to be a choose dynamic ATM/ITM/OTM strikes.
0 = ATM
LESS THAN 0 = ITM
GREATER THAN 0 = OTM
Additonal advanced settings :
We have added an optional reference supertrend, where you can refer to other script and its supertrend direction as dual confirmation.
you can even set the reference chart with other time frame than of current chart.
Also while firing order, you can fire orders in LOTS/DOLLARS.
There is a smart dashboard that helps you see the live P/L as well.

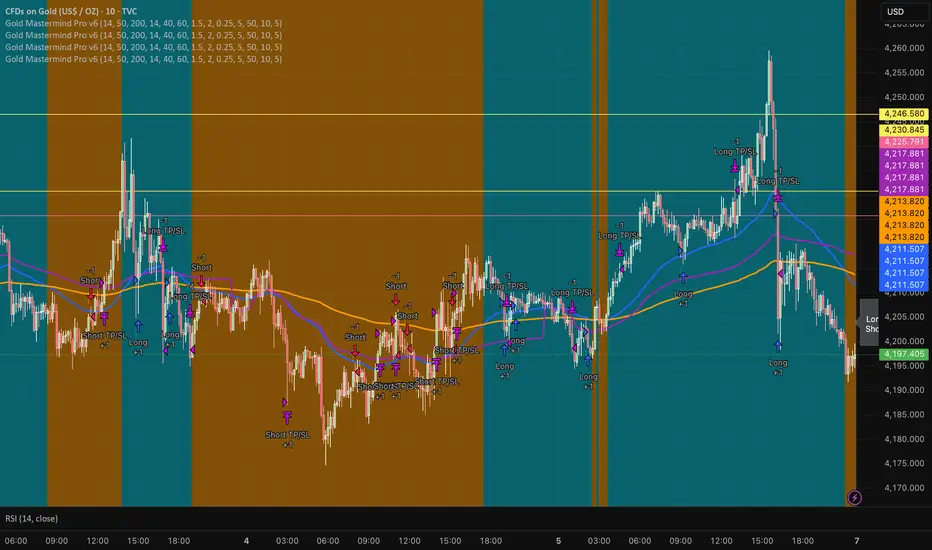
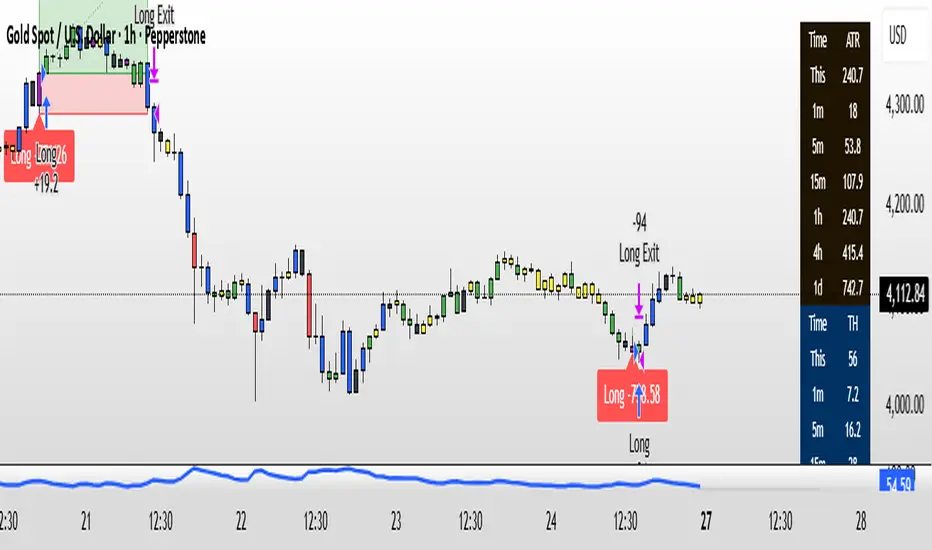
Gold Mastermind Pro v6EMA50 / EMA200 trend (UP / DOWN / FLAT)
VWAP + ATR + RSI filters for entries
ATR-based stop & 2R target
Risk-based position sizing with max 5 contracts
Cooldown in bars after each entry
Long arrows = baby blue, Short arrows = bright orange
Simple dashboard label showing trend, qty, stop & target
ONLY FOR EUR/USD : EMA9/EMA20 + RSI + MACD + Fibonacci (v6) FOR PAIRS WHICH HAS A MOMENTUM , trade only using manually not algo , use proper RR.
good luck

Dual MTF Confirmed Trend Strategy (5m Entry / 15m MACD & RSI) v1That is a detailed Dual Multi-Timeframe (MTF) Confirmed Trend Strategy written in Pine Script for TradingView. The core idea of this strategy is to only take entry signals on a faster timeframe (5-minute) when the trend is strongly confirmed on a slower, higher timeframe (15-minute). This aims to reduce false signals and trade in the direction of the dominant trend. Here is an explanation of how the strategy works, broken down by section:
1. 5-Minute Entry Filters 🚀This section calculates several indicators on the current 5-minute chart to identify potential trade setups. A position is only considered if all 5-minute conditions align.
Supertrend: A trend-following indicator based on Average True Range (ATR).
Long Condition: The closing price must be above the Supertrend line.
Short Condition: The closing price must be below the Supertrend line.
Gann Hi-Lo (GHL): A trend indicator using Simple Moving Averages (SMA) of the high and low prices. GHL Line: Switches between the SMA of the Highs and the SMA of the Lows based on price action.
Long Condition: The closing price must be above the GHL line.
Short Condition: The closing price must be below the GHL line.
Exponential Moving Averages (EMAs): It uses a 50-period EMA and a 100-period EMA to confirm the short-term trend direction.
Long Condition: The closing price must be above both the 50 EMA and the 100 EMA.
Short Condition: The closing price must be below both the 50 EMA and the 100 EMA.
2. 15-Minute MTF Confirmation Filters ⏳This is the crucial step where the strategy verifies the trend on the slower, 15-minute timeframe using the request security function. This step acts as a gatekeeper to ensure the 5-minute trade aligns with the larger trend.
MACD Histogram (12, 26, 9): The difference between the MACD Line and the Signal Line.
Long Confirmation: The 15m MACD Histogram must be greater than 0 (MACD line is above the Signal line, indicating bullish momentum).
Short Confirmation: The 15m MACD Histogram must be less than 0 (MACD line is below the Signal line, indicating bearish momentum).
RSI (Relative Strength Index) (14): A momentum oscillator. The 50 level is often used to determine the general market trend.
Long Confirmation: The 15m RSI must be greater than 50 (indicating stronger bullish momentum).
Short Confirmation: The 15m RSI must be less than 50 (indicating stronger bearish momentum).
The Total 15m Confirmation is only true if both the MACD and the RSI confirmation signals align.
3. Trade Orders (Entry Logic) ⚖️
The strategy only executes a trade when the 5-minute entry conditions are met AND the 15-minute confirmation conditions are met.
Final Long Condition:
5m Conditions (Supertrend, GHL, EMA alignment) AND
15m Confirmation (MACD Hist > 0 AND RSI > 50)
Final Short Condition:
5m Conditions (Supertrend, GHL, EMA alignment) AND
15m Confirmation (MACD Hist < 0 AND RSI < 50)
When a trade signal is generated, the strategy:
Closes any opposite position (e.g., closes a "Short" trade if a "Long" signal appears).
Enters the new position (e.g., enters a "Long" trade).
This is designed as a reversal strategy where a new entry automatically closes the previous opposing trade.
In Summary
The strategy operates on a principle of Trend Alignment:
5-Minute Chart: Is used for Signal Timing (when exactly to enter the market).
15-Minute Chart: Is used for Trend Validation (is the overall market momentum supporting the signal?).
It's an attempt to capture short-term moves (5m signals) that are backed by strong medium-term momentum (15m confirmation), thereby aiming for higher probability trades.
This is not investment advice; it is recommended to perform optimization and backtesting for the assets intended for implementation.

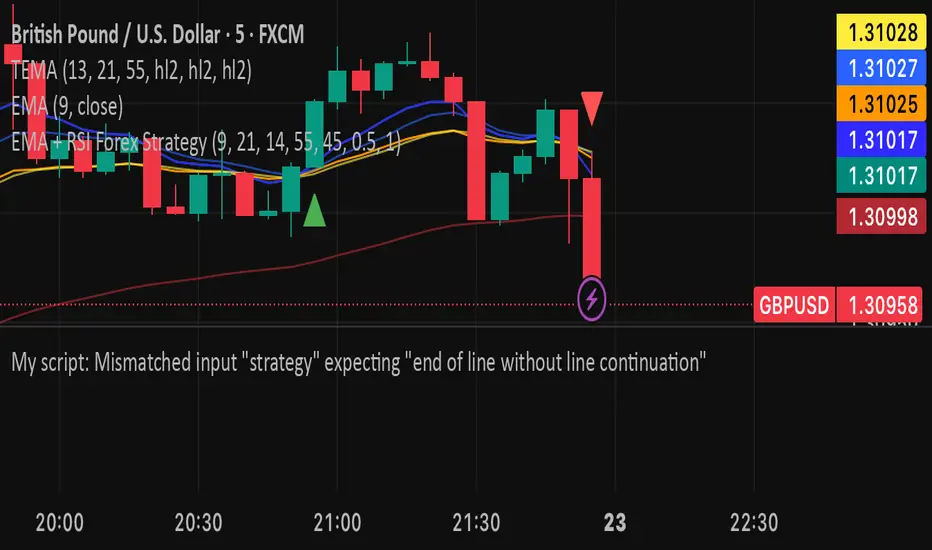
EMA + RSI Forex StrategyHere is a complete and ready-to-use Pine Strategy Script v5 trading strategy. It’s designed for forex pairs and uses combination of EMA crossover and RSI confirmation to identify high-probability entries. The script includes backtesting capability and adjustable parameters for optimization.
Pivot Fib 4H — EAStrategy uses the pivot standard to open position, it has well define entry and exit point with SL, it also has a proper money management plan, maximum 4 trades a day, each trade risk 0.5% of the account, I have it EA version of it also.

EMA Cross Strategy v5 (30 lots) (15 min candle only)- safe flip🚀 EMA Cross Strategy v5 (30 Lots) (15 min candle only)— Safe Flip Edition
Fully Automated | Fast | Reliable | Battle-tested
Welcome to a clean, powerful, and automation-friendly EMA crossover system.
This strategy is built for traders who want consistent trend-based entries without the risk of unwanted pyramiding or doubled positions.
🔥 How It Works
This strategy uses a fast EMA (10) crossing a slow EMA (20) to detect trend shifts:
Bullish Crossover → LONG (30 lots)
Bearish Crossover → SHORT (30 lots)
Every opposite signal safely flips the position by first closing the current trade, then opening a fresh position of exactly 30 lots.
No doubling.
No runaway position size.
No surprises.
Just clean, mechanical trend-following.
📈 Why This Strategy Stands Out
Unlike basic EMA crossbots, this version:
✔ Prevents unintended pyramiding
✔ Never over-allocates capital
✔ Works perfectly with webhook-based automation
✔ Produces stable, systematic entries
✔ Executes directional flips with precision
🔍 Backtest Highlights (1-Year)
(Backtests will vary by instrument/timeframe)
1,500+ trades executed
Profit factor above 1.27
Strong trend performance
Balanced long/short behavior
No margin calls
Consistent trade execution
This strategy thrives in trending markets and maintains strict discipline even in choppy conditions.
⚙️ Automation Ready
Designed for automated execution via webhook and API setups on supported platforms.
Just connect, run, and let the bot follow the rules without hesitation.
No emotions.
No overtrading.
No fear or greed.
Pure logic.

BTC EMA 5-9 Flip Strategy AutobotThis strategy is designed for fast and accurate trend-following trades on Bitcoin.
It uses a crossover between EMA 5 and EMA 9 to detect instant trend reversals and automatically flips between Long and Short positions.
How the strategy works
EMA 5 crossing above EMA 9 → Long
EMA 5 crossing below EMA 9 → Short
Automatically closes the opposite trade during a flip
Executes trades only on candle close
Prevents double entries with internal position-state logic
Fully compatible with automated trading via webhooks (Delta Exchange)
Why this strategy works
EMA 5–9 is extremely responsive for BTC’s volatility
Captures trend reversals early
Works best on 15-minute timeframe
Clean, simple logic without over-filtering reduces missed opportunities
Performs well in both uptrends and downtrends
Automation Ready
This strategy includes alert conditions and webhook-ready JSON for automated execution.
This is a fast-reacting BTC bot designed for intraday and swing crypto trend trading.

Cognex Fibonacci Breakout StrategyTHE COMPLETE TRADE LOGIC (What We Want):
Step 1: Morning Session (9:30-10:30)
Track session high and low
Step 2: After 10:30 - Wait for Breakout
Bullish: Close above session high
Bearish: Close below session low
Step 3: Track Extreme After Breakout
Keep updating highest_after_breakout or lowest_after_breakout
This continuously updates as price makes new extremes
Step 4: Detect 28% Retracement (THE LOCK)
When price retraces to 28%, set last_extreme_for_retracement to the current extreme
This LOCKS the extreme for fibonacci calculations
fib_100 should use this locked value
Step 5: Place Limit Order EARLY (at 20% retracement)
When price retraces to 20%, place limit order at 28% entry
This is so the order is ready when price hits 28%
Step 6: Cancel & Recalculate if New Extreme
If price makes a NEW extreme AFTER the order is placed
Cancel the old order
Wait for new 20% retracement to place new order
Step 7: One Trade Per Day
Only ONE order placement attempt per day
Even if cancelled, don't try again

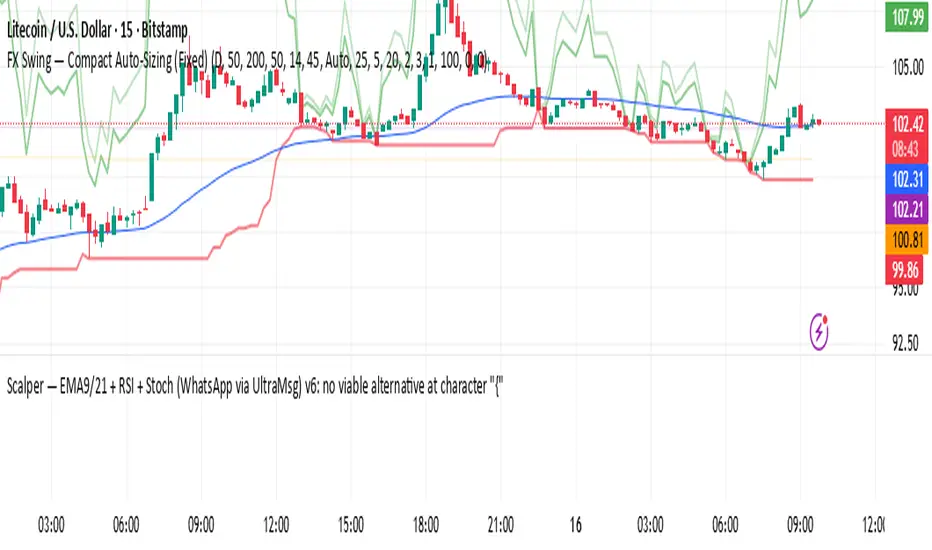
FX Swing — Compact Auto-Sizing (Fixed)A compact Forex swing-trading strategy that combines higher-timeframe EMA trend bias, EMA pullback confirmation, and RSI momentum filtering. It automatically sizes positions using either risk-percentage or fixed-risk, adapts pip values for JPY and non-JPY pairs, and generates clear SL/TP levels with partial take-profit exits. The script also sends structured JSON alerts for webhooks or WhatsApp automation, making it ideal for fast, disciplined, and risk-controlled swing entries.
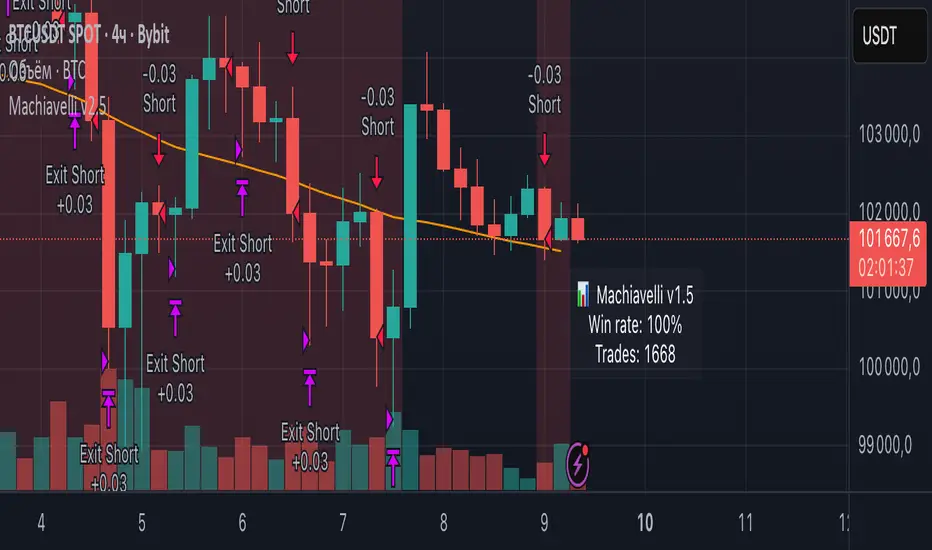
Machiavelli v2.5The purpose of this script is straightforward — to provide a reliable source of passive income.
Results speak for themselves.
WIN1! • Crossing EMAs• (By Mesquita, v7)Moving average crossover strategy for intraday movements, especially in the continuous index (WIN1!) on the Brazilian stock exchange B³. The strategy is customizable for time windows, has a filter for trades only above the long-term average, whether only long, only short, or both, with or without stop loss.

TMB Invest - Smart Money Concept StrategyEnglish:
**Quick Overview**
The "TMB_SMC_Strategy_v1.1.3" combines a classic trend filter using two EMAs with contrarian RSI entries and simple SMC elements (Fair Value Gaps & Order Blocks). Stop-loss and take-profit orders are volatility-adaptive and controlled via the ATR. An integrated dashboard displays the setup status, stop-loss/take-profit levels, entry reference, and trend, RSI, and ATR values.
---
## Operating Principle
1. **Trend Filter:** A fast EMA (default 50) is compared to a slow EMA (default 200). Trading occurs only in the direction of the trend: long in uptrends, short in downtrends.
2. **Timing via RSI:** Contrarian entries within the trend. Go long when the RSI is below a buy level (default 40); Short when the RSI is above a sell level (standard 60).
3. **Structure Check (SMC Proxy):** An "FVG Touch" serves as additional confirmation that an inefficient price zone has been tested. Order blocks are visualized for guidance but are not a direct entry trigger.
4. **Risk Management via ATR:** Stop-loss and take-profit levels are set as multipliers of the current ATR (e.g., SL = 1×ATR, TP = 2×ATR). This allows target and risk distances to adjust to market volatility.
5. **Simple Position Logic:** Only one position is held at a time (no pyramiding). After entry, stop and limit orders (bracket exit) are automatically placed.
---
## Input Values
* **EMA Fast / EMA Slow:** Lengths of the moving averages for the trend filter.
* **RSI Length / Levels:** Length of the RSI as well as buy and sell thresholds (contra signals within the trend direction).
* **Take Profit (RR) / Stop Loss (RR):** ATR multipliers for TP and SL.
* **Show FVGs & Order Blocks:** Toggles the visual SMC elements (zones/boxes) on or off.
--
## Signals & Execution
* **Long Setup:** Uptrend (fast EMA above slow EMA) **and** RSI below the buy level **and** a current FVG signal in a bullish direction.
* **Short Setup:** Downtrend (fast EMA below slow EMA) **and** RSI above the sell level **and** a current FVG touch in a bearish direction.
* **Entry & Exit:** If the setup is met, the market is entered; stop-loss/take-profit orders are placed immediately according to ATR multiples.
--
## Visualization
* **EMAs:** The fast and slow EMAs are plotted to illustrate the trend.
* **FVGs:** Fair Value Gaps are drawn as semi-transparent boxes in the trend color and projected slightly into the future.
* **Order Blocks:** Potential order block zones from the previous candle are visually highlighted (for informational purposes only).
---
## Integrated Dashboard
A compact table dashboard (bottom left) displays:
* Current **Setup Status** (Long/Short active, Long/Short ready, No Setup),
* **Stop-Loss**, **Take-Profit**, and **Entry Reference**,
* **Trend Status** (Bull/Bear/Sideways),
* **RSI Value**, and **ATR Value**.
Active long/short positions are highlighted in color (green/red).
--
## Practical Guide
1. **Place on Chart** and select the desired timeframe.
2. **Calibrate Parameters** (EMA lengths, RSI levels, ATR multipliers) to match the market and timeframe.
3. **Backtest** across different market phases; prioritize robustness over maximum curve fit.
4. **Fine-Tuning:**
* Shorter EMAs are often useful intraday (e.g., 20/100 or 34/144).
* Adjust RSI levels to market characteristics (45/55 for aggressive trading, 30/70 for conservative trading).
* Increase or decrease ATR multipliers depending on volatility/trading style.
--
## Notes, Limitations & Extensions
* **FVG Definition:** The FVG detection used here is intentionally simplified. Those who prefer a more rigorous approach can switch to a 3-candle definition and fill levels.
* **Order Blocks:** These primarily serve as a guide. Integration into entry/exit logic (e.g., retests) is possible as an extension.
* **Backtest Realism:** Fills may differ from the displayed closing price. For greater accuracy, intrabar backtests or an entry indicator based on the average position price are conceivable.
* **Alerts:** Currently, no alert conditions are defined; these can be added for long/short setups and status messages.
* **Position Management:** By default, no scaling is performed. Partial sales, trailing stops, or multiple entries can be added.
---
## Purpose & Benefits
The strategy offers a clear, modular framework: trend filter (direction), RSI contra timing (entry), SMC proxy via FVG Touch (structure), and ATR-based exits (risk adaptation). This makes it robust, easy to understand, and highly extensible—both for discretionary traders who appreciate visual SMC elements and for systematic testers who prefer a clean, parameterizable foundation.

Algoritmictrader2025 ALGO System profitability works with a minimum profit margin of 75% and the maximum profit margin per share is around 95%. The software costs $150 per month.

CyberTrading-Inside Hunt RobotThis Pine Script strategy, titled "Cyber-Inside", is a fully automated entry and risk management system built around inside bar pierce patterns and ATR-based dynamic stops/targets. It identifies specific candle formations, calculates position sizing based on risk percentage, and visually displays risk/reward zones and trade labels on the chart.
Detailed Explanation
1. Core Logic
The script searches for inside bars — candles whose high and low are contained within the previous bar — that appear after a valid “normal” or “long” range candle.
Then it waits for a wick pierce (a candle that breaks the previous inside bar's range slightly but closes inside).
That wick pierce acts as a potential reversal or continuation signal:
wickDown → possible long entry
wickUp → possible short entry
2. ATR-based Classification
Each candle is compared to the ATR(24):
Spinning (small) → below 0.8 × ATR
Standard → between 0.8× and 1.2× ATR
Long → between 1.2× and 2.5× ATR
Huge → above 2.5× ATR
Only certain candle types (standard or long) in the previous bars qualify for pattern validation.
3. Entry Conditions
A trade signal occurs when:
The current bar forms a wick pierce of a prior inside bar pattern.
No active position exists (strategy.position_size == 0).
Then:
For longs, entry at close, stop at previous low minus ATR buffer.
For shorts, entry at close, stop at previous high plus ATR buffer.
4. Risk Management
The stop distance defines the risk per trade, and the position size is adjusted dynamically so that only the chosen riskPercent (e.g., 1%) of equity is at risk.
If useRR is enabled, a take-profit target is placed using the defined risk/reward multiple (rr, e.g. 1:3).
If disabled, the target defaults to the previous candle’s high or low.
5. Visualization
The strategy visually marks:
Entry points (triangles)
Red box = risk zone (entry → stop)
Green box = reward zone (entry → target)
Optional diagonal and horizontal lines for clarity
Labels updated after trade closes with PnL values (profit or loss)
6. Application
This system helps traders:
Automate inside-bar breakout or reversal entries
Maintain strict risk-based position sizing
Visually assess trade zones and risk/reward areas
Backtest and evaluate performance consistency on various timeframes and assets
USDJPY MA Zone Entry Strategy USD/JPY tested only.A consistent strategy that gives me alerts each time my conditions are met. I am a funded prop firm trader. this strategy gives 45-70% annual returns. the sequence for this strategy is: After 4 stop loss hits, place a trade on the NEXT ENTRY ALERT ONCE: (-.188) pips draw back towards the stop loss. (this turns the Strat from 1-3 RISK/REWARD to 1-7+ RISK/REWARD). keep the Stop Loss the same (-.300) away from your entry. Take Profit placed at (+1.488) from entry. if 3 losses in a row happens AFTER you've followed these instructions, don't trade again UNTIL the strategy has a TAKE PROFIT gain, then the sequence starts over again. that is this strategies losing streak. after that streak is over. the strategy will be back to give you profits.

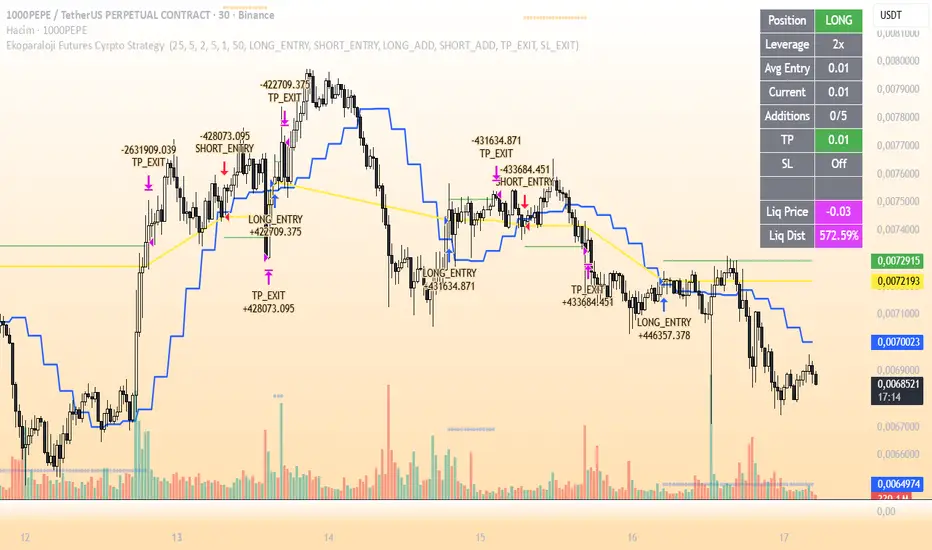
Ekoparaloji Futures Cyrpto Strategy Ekoparaloji Futures Crypto Strategy - Ladder Averaging System
This strategy uses a ladder position entry (pyramiding) approach and average cost reduction principle for crypto futures markets.
Key Features:
Dynamic ladder entry system
Profit-taking mechanism based on average price
Adjustable leverage support (1x-125x)
Long and Short position management
Optional stop-loss protection
Liquidation distance tracking
Advantages:
✓ Optimizes average cost during price fluctuations
✓ User-controlled risk-reward ratio
✓ Adapts to different market conditions
✓ Provides detailed visual feedback
✓ Increases profit potential through pyramiding strategy
Risks:
⚠ High leverage usage increases liquidation risk
⚠ Losses can accumulate during trend continuation
⚠ Pyramiding adds capital requirements
⚠ May produce unexpected results in sideways markets
⚠ Past performance does not guarantee future results
Recommended Usage:
This strategy is optimized for testing particularly on 30-minute and 1-hour timeframes. It may produce different results across various crypto pairs and market conditions.
Important Warning:
This strategy is for educational and research purposes. Extensive testing on demo accounts is strongly recommended before using in live trading. Leveraged trading involves high risk and you can lose all your capital.
📩 Message me to test the strategy and get access.
Happy Trading! 🚀