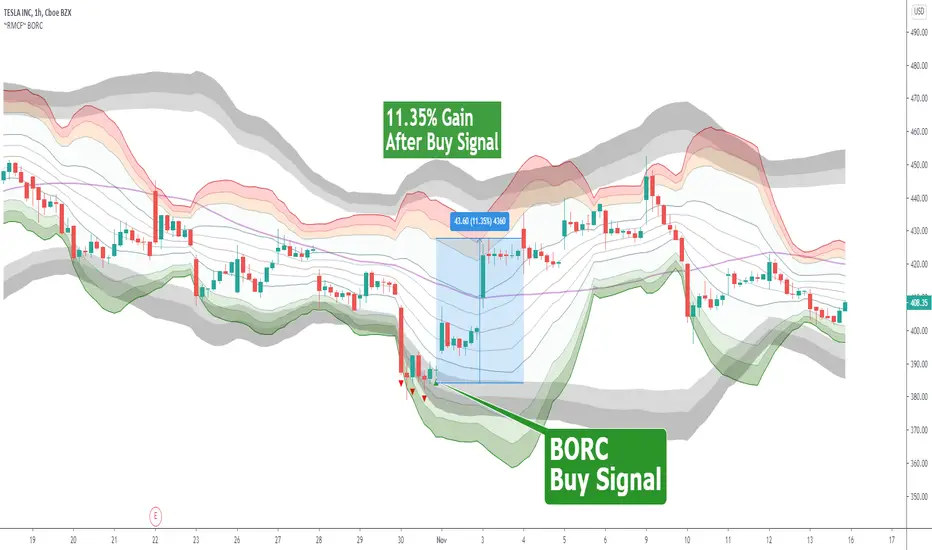
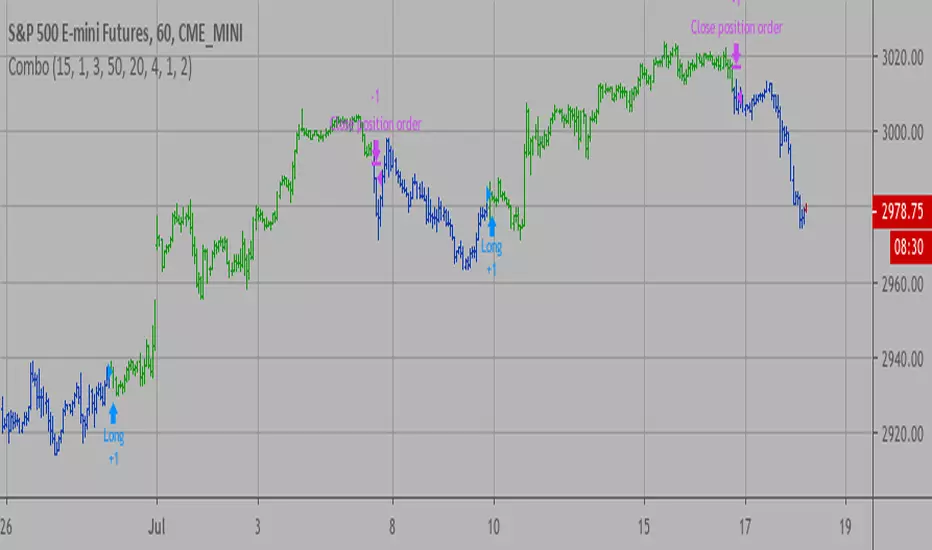
~RMCF~ BORC [with 17 page Annotated PDF with Example Charts]BORC, or Breakout Reversal Confirmation, is a signal based TV Indicator that analyzes multi-period price movements to determine when to enter in oversold and overbought tradeable assets. It works in any time frame and any type of security.
Green triangle means buy
Red Triangle means to get ready for the buy signal
$60 for lifetime access + complimentary PDF with example chart setups
DM @reaganmcf_ on twitter for more information and access
Reversal
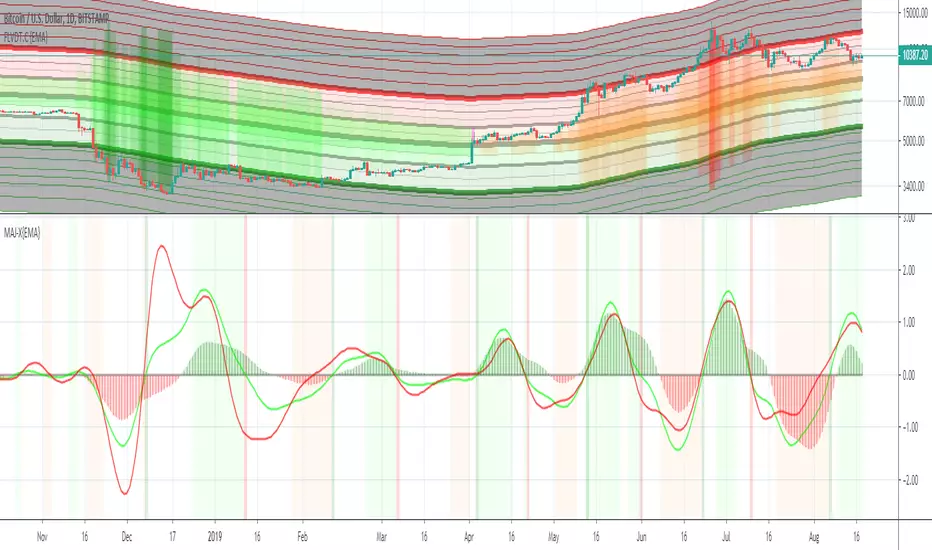
MAJESTIC-X {EMA}The MAJESTIC (MAJ) is a set of M omentum/ A cceleration/ J erk oscillators.
This "X" edition comes with optimized time-frames to be used as a companion with the Fast LIVIDITIUM Channel (FLVDT.C).
The option to switch to custom time-frames is also available in this version.
The filled-histogram is the Momentum oscillator
The lime colored line is the Acceleration oscillator
The red colored line is the Jerk oscillator
The analysis candles-range have been optimized for the following time-frames:
monthly (1M) = 1
3W = 1
2W = 2
weekly (1W) = 4
5D = 6
4D = 8
3D = 10
2D = 15
daily (1D) = 30
240 hr = 80
Note: In no way is the MAJESTIC oscillator intended as a financial/investment/trading advice. You are responsible for your own investment decisions and trades.
Please exercise your own judgement for your own trades base on your own risk-aversion level and goals as an investor or a trader. The use of OTHER indicators and analysis in conjunction (tailored to your own style of investing/trading) will help improve confidence of your analysis, for you to determine your own trade decisions.
~JuniAiko
(=^~^=)v~
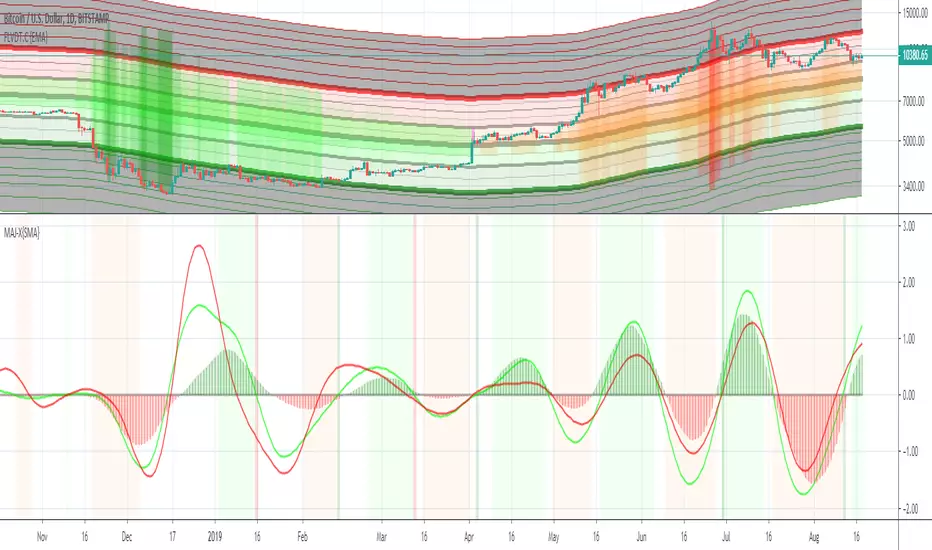
MAJESTIC-X {SMA}The MAJESTIC (MAJ) is a set of M omentum/ A cceleration/ J erk oscillators.
This "X" edition comes with optimized time-frames to be used as a companion with the Fast LIVIDITIUM Channel (FLVDT.C).
The option to switch to custom time-frames is also available in this version.
The filled-histogram is the Momentum oscillator
The lime colored line is the Acceleration oscillator
The red colored line is the Jerk oscillator
The analysis candles-range have been optimized for the following time-frames:
monthly (1M) = 1
3W = 1
2W = 2
weekly (1W) = 4
5D = 6
4D = 8
3D = 10
2D = 15
daily (1D) = 30
240 hr = 80
Note: In no way is the MAJESTIC oscillator intended as a financial/investment/trading advice. You are responsible for your own investment decisions and trades.
Please exercise your own judgement for your own trades base on your own risk-aversion level and goals as an investor or a trader. The use of OTHER indicators and analysis in conjunction (tailored to your own style of investing/trading) will help improve confidence of your analysis, for you to determine your own trade decisions.
~JuniAiko
(=^~^=)v~
Bollinger Band Strategy (Basic) Version 1 This strategy is for learning purposes only. Pay special attention to these strategies on longer aggregation periods (like 1 hr chart or more). Don't expect accurate results when you set a limit to 10 cents above your entry to be accurate. For example if you set the chart to 1 day, the price may move down and hit a stop 10 times then tag your limit. If this doesn't make sense, just don't use strategies here. Learn more first. That being said, I don't have specific recommendations for each aggregation period, backtesting isn't always perfect.
Now then, this strategy can be used as the traditional BB method by setting the "Stop" and "Limit Out" to like 10000, check "Reversal Entry" and uncheck "Limit Time of Day" This will keep the strategy running just reverse your position when price crosses outside each band.
INPUTS:
Length - length of WMA that I used for mean of Bollinger Band (this may suppose to be SMA, too bad)
Source - O-H-L-C basis for WMA
Deviation - normal Standard deviation that would be set when using Bollinger Band
Trailing stop check box - your stop value will be either a hard stop or trailing stop for an exit
Stop - the stop value - remember you can set this really high and it won't stop out
Limit Out - the limit value for exit
Reversal Entry check box - This changes each entry from a reversal (traditional idea of BB) to enter a trend trade - hopefully version 2 will have choice to trend one direction and reversal in the other.
Limit Time of Day - Especially when trading futures, you may want to only trade a specific time of day, when this box is checked, you can set the entry times below, exit will still only occur based on limit/stop or a flip entry order (the opposite entry condition is met)
Tips:
when I don't know a thing about a price range, like gold. I can set the limit out to 10000 and play with a trailing stop to get a better idea of what is even possible before tuning further.

Combo Backtest 123 Reversal & Chande Forecast Oscillator This is combo strategies for get a cumulative signal.
First strategy
This System was created from the Book "How I Tripled My Money In The
Futures Market" by Ulf Jensen, Page 183. This is reverse type of strategies.
The strategy buys at market, if close price is higher than the previous close
during 2 days and the meaning of 9-days Stochastic Slow Oscillator is lower than 50.
The strategy sells at market, if close price is lower than the previous close price
during 2 days and the meaning of 9-days Stochastic Fast Oscillator is higher than 50.
Second strategy
The Chande Forecast Oscillator developed by Tushar Chande The Forecast
Oscillator plots the percentage difference between the closing price and
the n-period linear regression forecasted price. The oscillator is above
zero when the forecast price is greater than the closing price and less
than zero if it is below.
WARNING:
- For purpose educate only
- This script to change bars colors.
Breakout Reversal Entry on WMA - NG1! Overnight ver 1This script is for learning purposes only
This strategy will plot arrows when price breaks so far above/below WMA. The strategy will enter when the price breaks away from WMA. All entries are reversals. Users can set WMA length and source; also the distance of the price away from WMA to enter. Adjustable bracket orders are placed for exit, with trailing stop or market stop choice. Last, users can set the time of day they want to enter a trade.
My Preference: I am testing this strategy on NG1! over night on 1 minute candle. with .003 on price drop/climb, I get entries almost every night. Also 10 tick stop and 5 tick profit seems backward to most, but with a high win/loss ratio, it performs quite well. Trailing stops generally help out as well.
INPUTS:
Length - The is the WMA length
Source - WMA source (High, Low, Open, Close...)
When Price Drops - This is the distance in ticks when the price drops away from WMA, an arrow is plotted, and reversal entry order is placed
When Price Climbs - Same as price drop, just in the opposite direction
Trailing Stop check box - Check if you want to place a trailing stop so many tick away from entry. Unchecked is Market (hard) stop so many ticks from entry.
Stop - Number of ticks away from entry a the stop or trailing stop is set (for NG 1 tick = $0.001)
Limit Out - Number of ticks away from entry a limit order is placed to take profits
Limit Time of day check box - check to use the time of day to limit what time of day order entry will occur.
Start/Stop Trades (Est Time) - First box is when the strategy will be allowed to start buying and stop is when the strategy will stop being allowed to buy. Sell orders continue until a stop or limit triggers an exit. These times are Eastern time zone
PROPERTIES:
Pyramiding - This feature will allow multiple entries to occur. If set to 1, the strategy should only trade 1 contract at a time. If set to 2, the strategy will enter a second order if entry requirements are met. This allows you to be holding 2 contracts. Basically on a good day, it will multiply your earnings, on a bad day, you'll just lose more. For testing, I keep this on 1.
TIPS:
- If you want to go long only, set "When Price Climbs" to an impossible number, like 10,000. It's not possible for NG to move $10 is a matter of minutes so it will not enter the market with a short order. Also keep in mind you can set different requirements for going long vs going short. If you think there is more pull on the market in a particular direction.

Combo Strategy 123 Reversal & Chande Forecast Oscillator This is combo strategies for get a cumulative signal.
First strategy
This System was created from the Book "How I Tripled My Money In The
Futures Market" by Ulf Jensen, Page 183. This is reverse type of strategies.
The strategy buys at market, if close price is higher than the previous close
during 2 days and the meaning of 9-days Stochastic Slow Oscillator is lower than 50.
The strategy sells at market, if close price is lower than the previous close price
during 2 days and the meaning of 9-days Stochastic Fast Oscillator is higher than 50.
Second strategy
The Chande Forecast Oscillator developed by Tushar Chande The Forecast
Oscillator plots the percentage difference between the closing price and
the n-period linear regression forecasted price. The oscillator is above
zero when the forecast price is greater than the closing price and less
than zero if it is below.
WARNING:
- For purpose educate only
- This script to change bars colors.

MAJESTIC {EMA}The thickest blue line is the Momentum oscillator
The lime colored line is the Acceleration oscillator
The red colored line is the Jerk oscillator
This is the {EMA} implementation.
~JuniAiko
(=^~^=)v~

MAJESTIC {SMA}The thickest blue line is the Momentum oscillator
The lime colored line is the Acceleration oscillator
The red colored line is the Jerk oscillator
This is the {SMA} implementation.
~JuniAiko
(=^~^=)v~

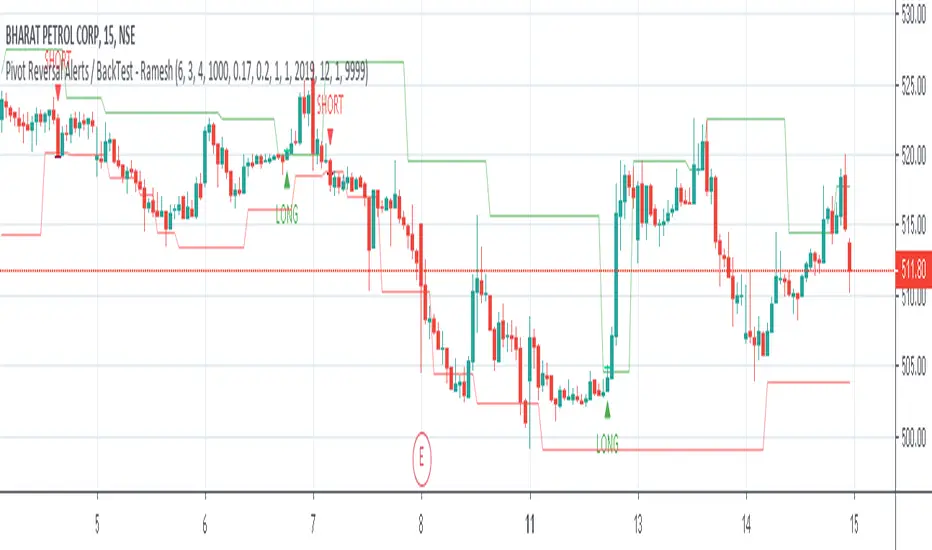
Pivot Reversal Strategy with ADX filter and Alerts V2 - RameshOne script with 80% Win Rate, applicable for 15m time period, more filters added to remove false signal.
Combo Backtest 123 Reversal & Chaikin Volatility This is combo strategies for get a cumulative signal.
First strategy
This System was created from the Book "How I Tripled My Money In The
Futures Market" by Ulf Jensen, Page 183. This is reverse type of strategies.
The strategy buys at market, if close price is higher than the previous close
during 2 days and the meaning of 9-days Stochastic Slow Oscillator is lower than 50.
The strategy sells at market, if close price is lower than the previous close price
during 2 days and the meaning of 9-days Stochastic Fast Oscillator is higher than 50.
Second strategy
Chaikin's Volatility indicator compares the spread between a security's
high and low prices. It quantifies volatility as a widening of the range
between the high and the low price.
You can use in the xPrice1 and xPrice2 any series: Open, High, Low, Close, HL2,
HLC3, OHLC4 and ect...
WARNING:
- For purpose educate only
- This script to change bars colors.

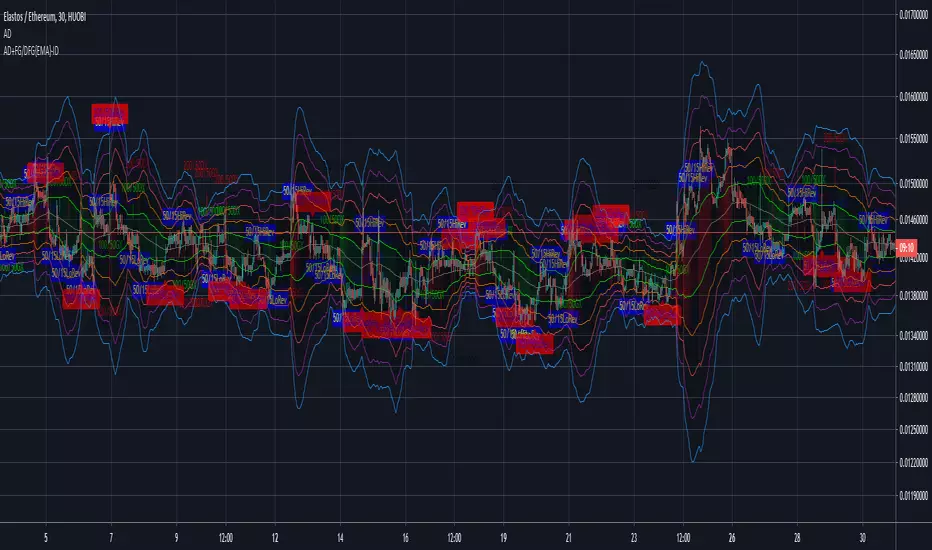
AEONDRIFT with FG & DFG {EMA} indicatorsAEONDRIFT with {EMA} implementation of FUSIONGAPS (FG) and DIFFERENTIAL FUSIONGAPS (DFG) derived indicators.
~JuniAiko
(=^~^=)v~
Check out the other analytical tools that I had published.
AEONDRIFT:
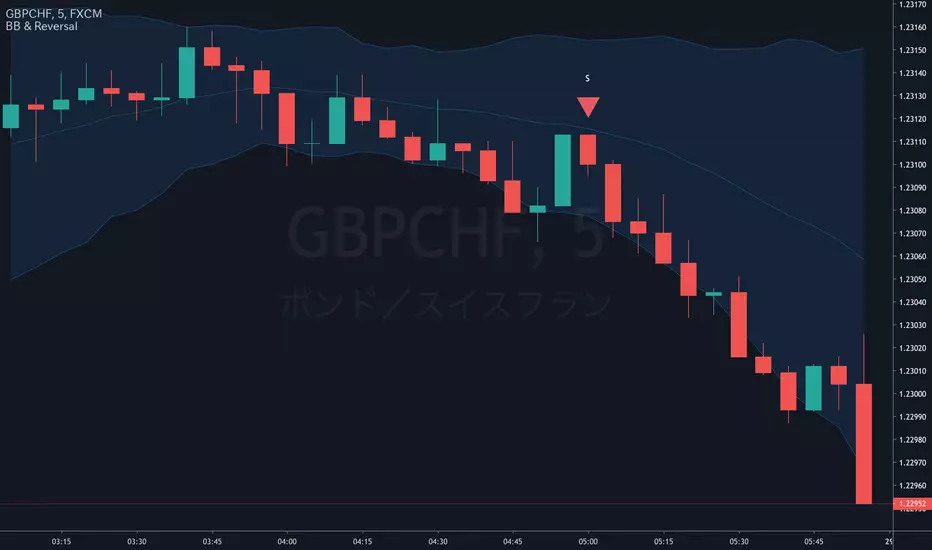
Bollinger Bands and Candlestick No Wick ReversalBollinger Bands and Candlestick No Wick Reversal
with alerts


Combo Strategy 123 Reversal & Chaikin Volatility This is combo strategies for get a cumulative signal.
First strategy
This System was created from the Book "How I Tripled My Money In The
Futures Market" by Ulf Jensen, Page 183. This is reverse type of strategies.
The strategy buys at market, if close price is higher than the previous close
during 2 days and the meaning of 9-days Stochastic Slow Oscillator is lower than 50.
The strategy sells at market, if close price is lower than the previous close price
during 2 days and the meaning of 9-days Stochastic Fast Oscillator is higher than 50.
Second strategy
Chaikin's Volatility indicator compares the spread between a security's
high and low prices. It quantifies volatility as a widening of the range
between the high and the low price.
You can use in the xPrice1 and xPrice2 any series: Open, High, Low, Close, HL2,
HLC3, OHLC4 and ect...
WARNING:
- For purpose educate only
- This script to change bars colors.

Crayons GrayonsUpdate for
Crayons 0.2
Crayons is early onset hyper customizable trend reversal trading suite
There is some big changes for Signal and Pivot generation and its set as Default mode so in case of nostalgia for white noise there is an option to "rollback" placed at the top of input menu
As always- hyper customizable
Every singal core crayon signal group will be turned on by default so open input menu for personalizing signals to charts and personal character
Crayons 0.2-
Greatly improved Signal quality
Improved Pivot detection logic
Two Set's of Pivots "Cleaned" and "Vanilla"
Optional Polichrome candle painter mode to provide additional information on demand
Optional Labels for signals and pivots
Secondary risk filter filtering "riskier" signal sequences (Experimental)
Second MA is changed by ATR modified to work as trailing S/R (Source is ohlc4 for whip protection model is experimental ,filters used is not suitable for micro tf so atr calls for higher periods, its experimental and will be fixed or removed with later updates, added for testing purposes)
Combo Backtest 123 Reversal & Center Of Gravity This is combo strategies for get a cumulative signal.
First strategy
This System was created from the Book "How I Tripled My Money In The
Futures Market" by Ulf Jensen, Page 183. This is reverse type of strategies.
The strategy buys at market, if close price is higher than the previous close
during 2 days and the meaning of 9-days Stochastic Slow Oscillator is lower than 50.
The strategy sells at market, if close price is lower than the previous close price
during 2 days and the meaning of 9-days Stochastic Fast Oscillator is higher than 50.
Second strategy
The indicator is based on moving averages. On the basis of these, the
"center" of the price is calculated, and price channels are also constructed,
which act as corridors for the asset quotations.
WARNING:
- For purpose educate only
- This script to change bars colors.
Combo Strategy 123 Reversal & Center Of Gravity This is combo strategies for get a cumulative signal.
First strategy
This System was created from the Book "How I Tripled My Money In The
Futures Market" by Ulf Jensen, Page 183. This is reverse type of strategies.
The strategy buys at market, if close price is higher than the previous close
during 2 days and the meaning of 9-days Stochastic Slow Oscillator is lower than 50.
The strategy sells at market, if close price is lower than the previous close price
during 2 days and the meaning of 9-days Stochastic Fast Oscillator is higher than 50.
Second strategy
The indicator is based on moving averages. On the basis of these, the
"center" of the price is calculated, and price channels are also constructed,
which act as corridors for the asset quotations.
WARNING:
- For purpose educate only
- This script to change bars colors.
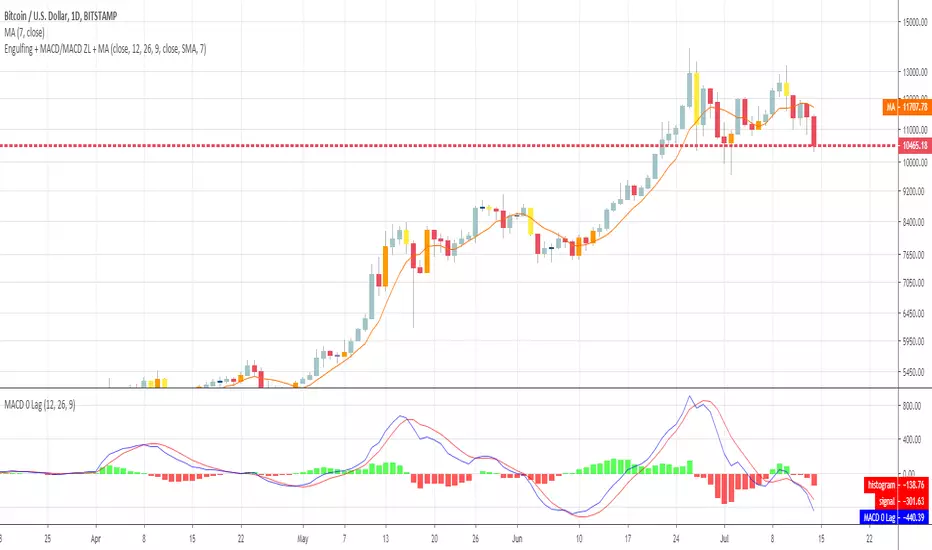
Engulfing + MACD/MACD ZL + MAHi everyone
This is a simple algorithm that I used on timeframe > m30 to detect strong reversal signals based on :
- Engulfing pattern
- MACD ZL 12, 26, 9
- Price vs SMA 7
Last two parameters are optional but gives more security. Otherwise, waiting for confirmation gives later entry.
Up to you to find the right balance between too much security (and taking the trade too late) and not enough confirmation (taking the trade too early and it will go the opposite way)
I recommend the novice traders (less than 2 years trading), to stick with the 3 parameters above .
It's to be used after a strong moment and as we're talking about reversals, I mean trade against the current trend.
Meaning they're more risky, so... you know the drill :) :
- Tight SL
- Protect the position quickly when going in the way you want
- Don't aim for very high TP. Have a few laddered obviously in any case
- Use a trailing stop to protect your gains
Hope you'll like it
Enjoy
Dave
Combo Strategy 123 Reversal & CCI This is combo strategies for get a cumulative signal.
First strategy
This System was created from the Book "How I Tripled My Money In The
Futures Market" by Ulf Jensen, Page 183. This is reverse type of strategies.
The strategy buys at market, if close price is higher than the previous close
during 2 days and the meaning of 9-days Stochastic Slow Oscillator is lower than 50.
The strategy sells at market, if close price is lower than the previous close price
during 2 days and the meaning of 9-days Stochastic Fast Oscillator is higher than 50.
Second strategy
The Commodity Channel Index (CCI) is best used with markets that display cyclical or
seasonal characteristics, and is formulated to detect the beginning and ending of these
cycles by incorporating a moving average together with a divisor that reflects both possible
and actual trading ranges. The final index measures the deviation from normal, which indicates
major changes in market trend.
To put it simply, the Commodity Channel Index (CCI) value shows how the instrument is trading
relative to its mean (average) price. When the CCI value is high, it means that the prices are
high compared to the average price; when the CCI value is down, it means that the prices are low
compared to the average price. The CCI value usually does not fall outside the -300 to 300 range
and, in fact, is usually in the -100 to 100 range.
WARNING:
- For purpose educate only
- This script to change bars colors.

Engulfing Candles DetectorHello traders
Credit to HPotter for that script
I took his script and added alerts to it. 2 lines lol
But anyway, useful to detect reversals by coloring bullish/bearish engulfing candles :)
Enjoy
David
