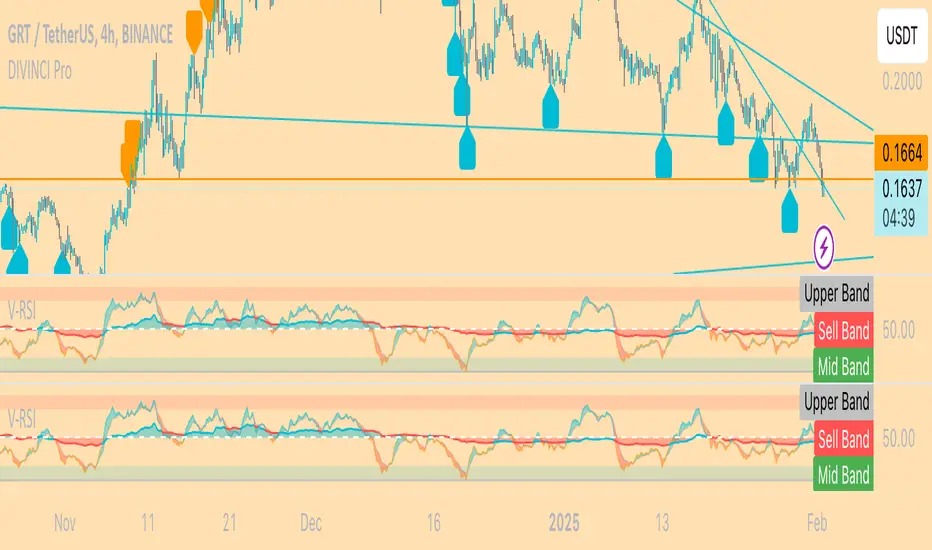
Anchored OBV RSI: "V-RSI" About the Indicator:
V-RSI uses values from the traditional "Relative Strength Index(RSI)" oscillator and the "On Balance Volume(OBV)" indicator and anchors them into an oscillator format. In doing so, we are given a more concrete overview of volume/sentiment data relative to the RSI for analysis of trend strength and decision making.
EXTRAS: BTC MODE => for BTC only.
In BTC MODE, the indicator uses BTC volume data from the following 5 major exchanges: BINANCE, COINBASE, FTX, BITMEX, BITFINEX.
The sum of this data is taken to depict anchored OBV values. This allows for a more accurate representation of Global Volume.
How to use it
The indicator can be used like the normal RSI with the OBV (area in the middle) showing volume sentiment.
<50 is seen as bearish
>50 is seen as bullish
Using this data, it becomes easier to identify unsustainable trends, reversals, divergences
An example of an unsustainable trend and reversal would be if RSI values are overbought ( RSI > 70) yet OBV oscillator remains below 50.
== chances of unsustainable trend reversal are more likely.
For more questions, send me a message here on Tradingview.
Happy trading,
MM :)
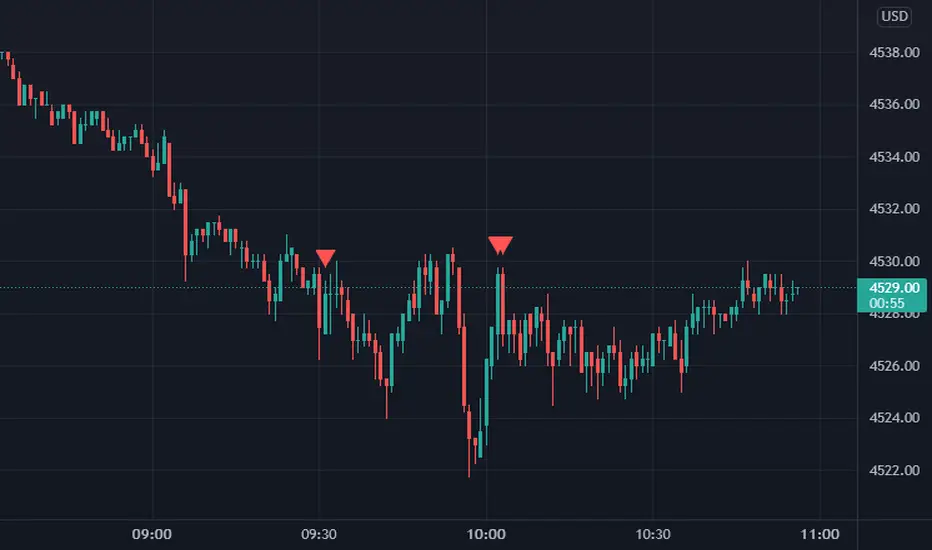
Reversal
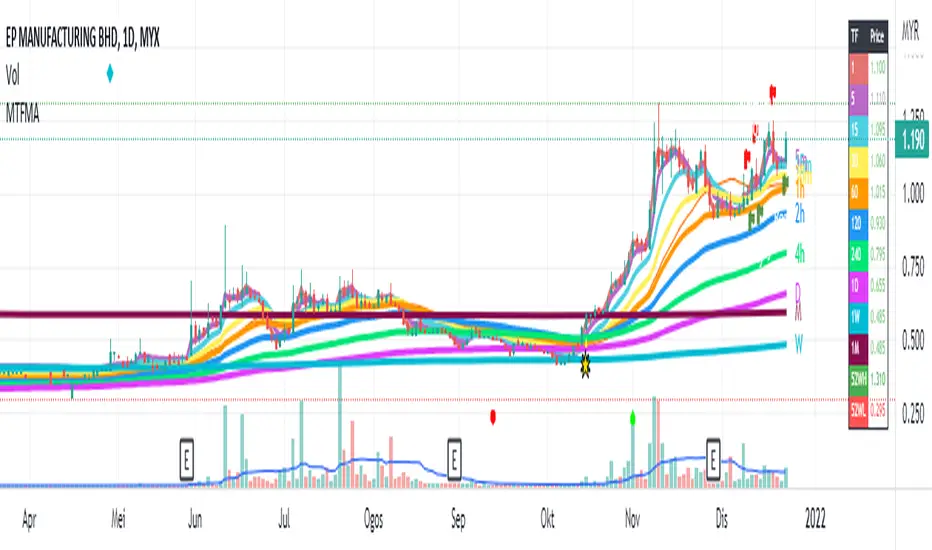
Multiple Timeframe (Moving Average) With InfoThis indicator combine 4 indicator in one pine script : Main indicator is Moving Average in multiple timeframes, Bollinger Band, Crossover Signal, Info Panel, 52Weeks High & 52 Weeks Low.
1)
For multiple moving average, it has 9 difference timeframes.
- Default timeframes is (1minute, 5minutes, 15minutes, 30minutes, 1hour, 4hours, 1Day, 1Week & 1Month). User also have choices to change the option.
- For Moving Average, there also available multiple choice of Moving Average : SMA , EMA , DEMA , VWMA , RMA, WMA . Default Moving Average is EMA (200)
- There also include info panel / table that show TF (Timeframes) for every MAs, & their price. Colors change according to current price. Bullish = Green, Neutral = Neutral, Bearish = Red
There are also function for user to turn on/off :
- (MA) Type & Lenght.
- Multiple MAs.
- Info / Table
User can use multiple line in daily chart to find support & resistance .
Example : For uptrend stock, candle close on top of EMA200 line for 1 hour timeframe. So it's can becomes immediate support, while the other EMAs on below is their next support.
Example :
For downtrend stock, candle close on top of EMA200 line for 5minutes timeframe. So it's become support, while the other EMAs on top is their resistance.
Example :
This Multiple MAs Inspired by xdecow :
www.tradingview.com
Checkout his Multi Timeframe Moving Average here :
2)
This indicator also have Bollingger Band. User have option to turn it on / off. User can use it as a target price if all the EMAs below the candle.
Example :
3)
This indicator also shown 52 Weeks High & 52 Weeks Low. User have option to turn it on / off. Their price also shown at the info panel.
Example :
4)
Crossover Signal. This crossover is default, it happen when candle close on top / near timeframe 5Minutes is (Ready). While candle close below timeframe 5Minutes is (Caution). User can choice other shape if they don't want the text label. To change the crossover for other setup, user can change it under = #2. The crossover only shown in past 10 candle.
Example :
Feel free to use it & comment. Thanks.
Keltner Channels BandsKeltner Channel Bands
Great indicator for mean reversion strategies.
Alerts you can set:
Crossover EMA
Crossunder EMA
Crossover upper band
Crossunder upper band
Crossover lower band
Crossunder lower band
Have fun!

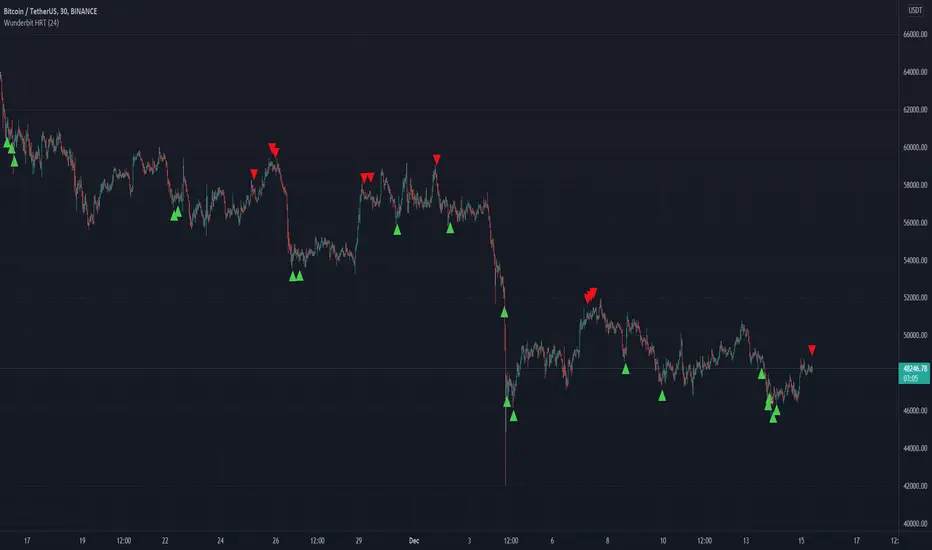
Wunderbit HRT BotWunderbit HRT is a proprietary indicator designed to find pivot points in the cryptocurrency market.
Working timeframes from 30 minutes and above.
The indicator is designed to create automated trading strategies using a webhook.
To create a cryptocurrency robot for this indicator, you need:
1. Create alerts and bind the URL to the webhook.
2. Link the Tradingview indicator to automation services.
For signals, alerts are used: LONG and SHORT
Recommendations for the indicator:
1. Use DSA technology for automation.
2. Be sure to disable the "multiple inputs" function.
3. Use an indicator with oscillators or MACD to confirm the entry point.
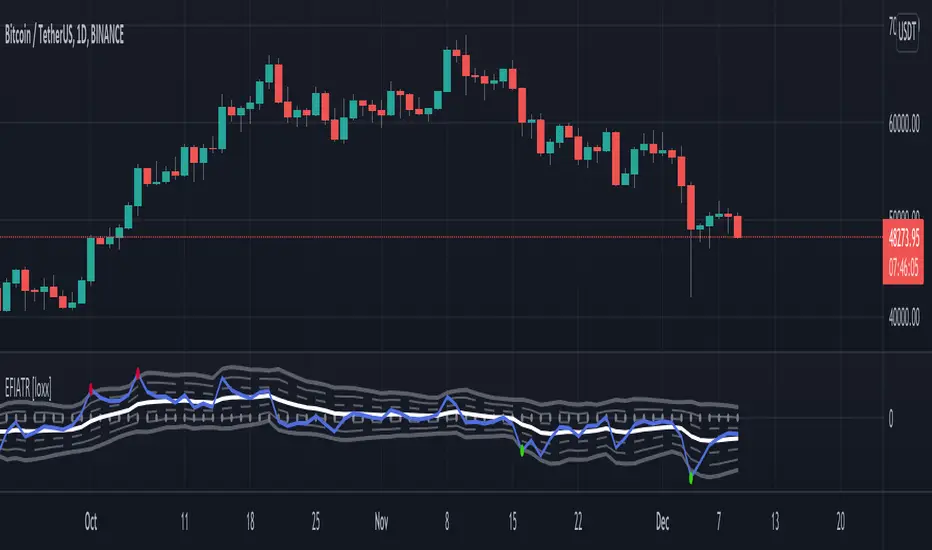
Elder Force Index With ATR Channels [loxx]Elder Force Index With ATR Channels, adaptive from original script by Dr. Alexander Elder
What it does
-EFI is used to sport reversals mainly on the weekly time frame
-When EFI spikes over 3 x ATR calculated on the signal line, price is said to have exhausted and you can start looking for reversals
Features
-Change all inputs
-Truncate EFI at 4 x ATR so as to not squish the indicator
-Open source, use code as you wish. If you use this code, shoot me a line and tell me how you're using it
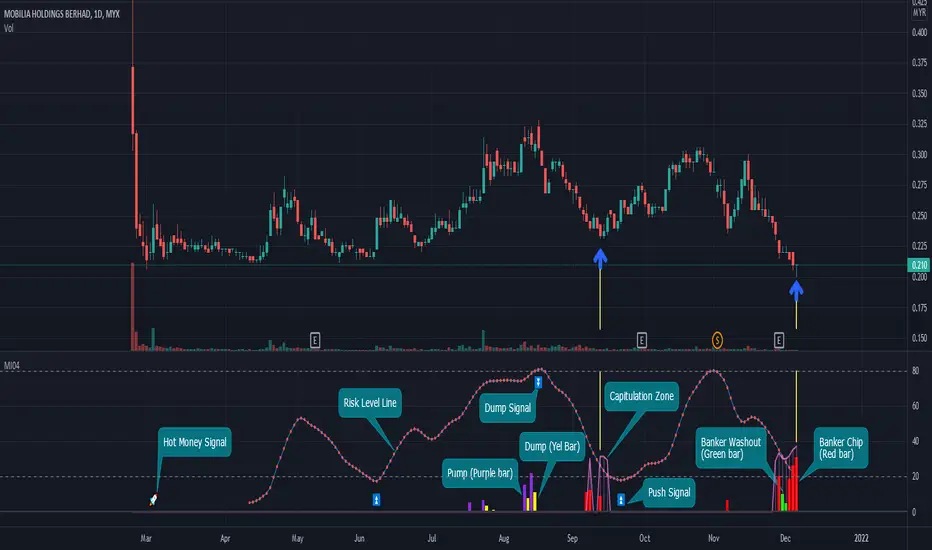
Banker Chip Pro (MI04)The Banker Chip Pro (MI04) indicator is used to track the activity of the banker collecting shares in the stage when price unexpectedly drops drastically,
and also pump & dump action with strong pull-up in stock price.
Therefore, traders need to remain cautions while using this indicator in the trendless market to avoid losing thier capital.
Banker Chip (Red bar) represents the banker's start engaging in the collection phase, while the Banker Washout (Green bar) represents the banker's washout to accumulate more chips.
Thus, if a Red bar is found near the end of a stock's decline, there is a high probability will form a wave of a rebound.
The last bar method is what it's called.
The Pump (Purple bar) represents the banker boosting up the stock price to attract regular investors.
The Dump (Yellow bar) represents regular investors committed to the stock, which is banker profit-taking activity (dump) that may result the price to collapse later.
The Capitulation Zone is when investors give up the stock by selling all the positions during periods of decline. It is a hint of bottom in pricing and consequently a good opportunity to observe whether can form a mark up phase (higher pivot highs and higher pivot lows)
The Risk Level Line (RLL) represents the risk level zone from horizontal 0 to 100. When the RLL rises beyond 80, it is considered a risk zone, may lead to a downward move.
Thus, investors who intend to enter the market at the bottom might use 20 as a safety zone and pay attention to the stock's trend in the future.
Banker Chip Pro features a total of 3 signals which are ⏫️ push signal and 🚀 hot money signal for bottom strategy and ⏬️ dump signal for an exit strategy.
This is referred to as signal method.
AJ Scalp Reversal Tops and Bottoms IndicatorReuploaded after TV took it down.
A free scalping reversal, top and bottom indicator. It prints signals in real time, and should be used for scalping.
Following candle will usually always follow the signal but from there closer management is required.
This script uses RSI, Volume, OBV, Pivots and a few more indicators to calculate the signals.
Use alongside other indicators and price action analysis for best results.
Only use on time frames above 1H, otherwise the signals fire too frequently.
*These signals are different compared to other scripts created by me

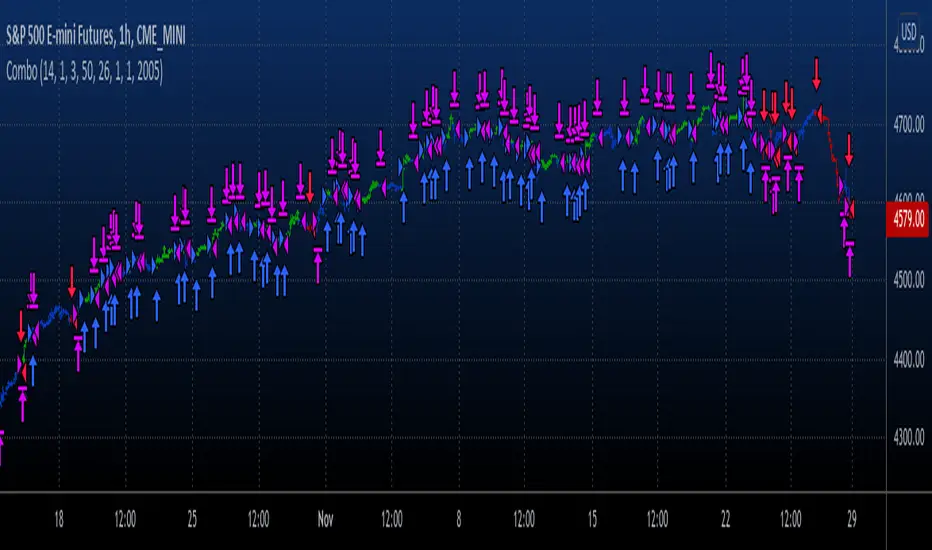
Combo Backtest 123 Reversal & TEMA1This is combo strategies for get a cumulative signal.
First strategy
This System was created from the Book "How I Tripled My Money In The
Futures Market" by Ulf Jensen, Page 183. This is reverse type of strategies.
The strategy buys at market, if close price is higher than the previous close
during 2 days and the meaning of 9-days Stochastic Slow Oscillator is lower than 50.
The strategy sells at market, if close price is lower than the previous close price
during 2 days and the meaning of 9-days Stochastic Fast Oscillator is higher than 50.
Second strategy
This study plots the TEMA1 indicator. TEMA1 ia s triple MA (Moving Average),
and is calculated as 3*MA - (3*MA(MA)) + (MA(MA(MA)))
WARNING:
- For purpose educate only
- This script to change bars colors.
AG FX - Pivot PointsPivot Points High Low
Definition
The Pivot Points High Low indicator is used to determine and anticipate potential changes in market price and reversals. The Highs referred to in the title are created based on the number of bars that exhibit lower highs on either side of a Pivot Point High, whereas the Lows are created based on the number of bars that exhibit higher lows on either side of a Pivot Point Low.
Calculations
As mentioned above, Pivot Point Highs are calculated by the number of bars with lower highs on either side of a Pivot Point High calculation. Similarly, Pivot Point Lows are calculated by the number of bars with higher lows on either side of a Pivot Point Low calculation.
Takeaways and what to look for
A Pivot Point is more significant or noteworthy if the trend is extended or longer than average. This can mean if a trader selects a higher period for before and after the Pivot Point, the trend could be longer and therefore prove the Pivot Point itself more notable.
Additionally, Pivot Points can help a trader assess where would be best to draw. By analyzing price changes and reversals, a trader has more of an ability to determine and predict price patterns and general price trends.
Summary
The Pivot Points High Low indicator can predict and determine price changes and potential reversals in the market. Pivot Points can also help traders identify price patterns and trends, depending on the period and significance of the Pivot Point value.

Fear Of Missing Out grid of forex tradingAbstract
This script finds potential safe grids placing limit orders without fear of missing out.
This script computes grids according to power of 1.0025 .
You can reference those price levels for your trading.
Introduction
Grid trading is a popular trading method.
Traders plan several price levels as grids and repeat buying at lower grids and selling at higher grids.
Grids can be round number like multiple of 100 pips.
Grids can also be support and resistance according to price history.
Some traders may think they need to adjust grids to trade.
However, there are several problems in choosing grids.
One problem is rate of change is related and therefore exponential. 20 to 30 is different from 30 to 40.
Another interesting point is there are some special impressing reversal price levels.
Several months ago, I had a question why usdjpy bounced near 108.3 .
After using a calculator, I found that 108.3 = 100 * 1.083 ≒ 100 * pow(1.0025,31) .
1.0025 , as known as 0.25% of change, is a potential stop out zone.
Therefore, we can compute grids and one grid is a little more than 1.0025 times than an another one.
After we finished computing grids, we can consider buy and sell near those grids.
Note that different traders may obtain different grid values.
For example, from 1.0 to 2.0 , it can be splited as 270 grids or 277 grids because pow(1.0025,277)<2 .
Those grids cannot always imply potential reversal points but they can be useful for traders looking for 0.25% profit targets with reducing fearing of buying or selling too early.
Computing grids
This script split from 1.0 to 10.0 into three segments.
One is 1.0 to 2.0 .
The second segment is from 2.0 to 5.0 .
The third segment is from 5.0 to 10.0 .
This script does the same thing for 0.1 to 1.0 , 10.0 to 100.0 , and so on.
For 1.0 to 2.0 and 5.0 to 10.0 , this script split a segment as 270 grids.
For 2.0 to 5.0 , this script split a segment as 360 grids.
The last step is display the next grids to the daily low and daily high.
Maybe also display the grids behind grids shown.
Parameters
x1,x2,x3,x4 : display the next x1,x2,x3,x4 grids to daily high and daily low. 1 means the next grid to daily high and daily low. 2 means the next grid to 1.
x_seg : default 2.0 . This script split from 1.0 to 10.0 into three segments. One is 1.0 to x_seg. The second segment is from x_seg to 10.0/x_seg . The third segment is from 10.0/x_seg to 10.0 .
x_grid1 : how many grids in the first segment
x_grid2 : how many grids in the second segment
x_lowprice : add this number for bigger grid distance. Generally, you don't need this number when trading forex but you may need it in stock trading. For stocks with price between 50 to 100, I recommend you use x_lowprice=100.
Conclusion and suggestions
This script can find potential grids for trading.
If price touches grids usually, we can consider buy and sell after price touches grids.
If price reverses before touching grids usually, we may consider buy and sell before price touches grids.
Those grids can remind us don't buy too much unless the price touches the next grid.
For instruments with less volatility, maybe we need more grids.
For traders with more money, they may also consider more grids for more dedicated range trading to collect more profit.
Reference
Sorry, I forgot them.

EneX SignalEneX is signal that give recommendation signals for entry and exit on spot market. This indicators not suitable for leverage trading in futures market.
EneX signal consider several indicators and has entry and exit rules.
EneX signal is suitable for investors who believe in trend following strategy (disclaimer on).
This script composed by Yohan Naftali for educational purpose only. Reader who will use this signal must do own research.
Indicator and Plot Involved
1. Williams Fractals with default periods = 2
2. William Alligator Indicators with default simple moving average 8, 13, and 21
3. Exponential Moving Averages with default value EMA 50, 100, and 200
4. Relative Strength Index with default overbought level = 80 and oversold level = 20
5. Williams Fractals are joined to create support and resistance line and fill area between support and resistance lines.
Entry signal conditions
1. Entry on Weakness when bullish fractal appear on n/2 period
2. Entry when price break resistance line
All entry condition must above EMA and alligator signal and not in overbought RSI
Exit signal conditions
1. Lowest price is below Exponential Moving Average
2. Lowest price is below William alligator lines
You can easily find entry and exit points by using Entry (E), Exit(X) signals
How to use
1. Monitor chart and wait until E or X signals
2. Entry if Entry Signal (E) appear (green colored label)
3. Exit if Exit Signal (X) appear (red colored label)
4. Change indicators setting when necessary
Best Practice
1. Entry only when entry signal (E) appear
2. Never entry when price below William alligator signal
3. Exit when exit signal (X) appear
4. Not exit when exit signal appear when you believe or you have information that price will be rebound
5. Exit if you believe that current price meet your target price
6. Always wise when use EneX signals
Disclaimer
Do your own research and consider fundamental price of asset.
The indicators provided on this script is for educational purposes only.
Author does not offer advisory or brokerage services, nor does it recommend or advise users to buy or sell particular stocks or securities.
Please examined script and give feedback for further improvement.

M.Right Bulls-V-Bears -Tug-of-War- SquidGame Themed(cc)Hello Traders,
I've decided to finally release an indicator I've spent several hours working to get just right and as far as I know, there isn’t one as accurate. And.... decided to add a little Squid Game theme to it just for fun.
……"The game is Tug of War, the side that pulls the rope from the middle to their side wins. Let the game begin."……
This indicator is not a typical one.
1) It shows visually when Bull volume or Bear volume is ‘pulling the rope to their side’.
2) It uses several different formulas to get an accurate read on the level of volume, but still keeps peaks and troughs within 100 for easy reading.
3) Update: It was originally meant to be used strictly with other indicators, but it can now be used as a standalone indicator.
Legend:
1) The top line signals give the major signals –
a. Red cross = Bearish volume strength and continuation.
b. Green cross = Bullish volume strength and continuation.
i. + Green Dot inside enhances signal.
ii. + Red Dot inside weakens signal.
c. Blue circle = Can indicate the beginning of a reversal to the upside or downside.
d. Pink circle = Can indicate the beginning of a reversal to the downside.
2) The Bottom signals are triggered when one circle-rope crosses over the other, these signals give confirmation to the top line signals – Red bearish / Green bullish.
3) As shown on the chart, the Reversal setup usually consists of a blue circle, followed by a red or green cross, then confirmation from the bottom signal.
4) Without the signals: green obviously is Bullish especially above the threshold set --Red bearish. The regular rope gives trend indication.
I've added tooltips to make it easy to understand, feel free to leave a comment if you still have a question!
Features:
-Tooltips (hover over - Info) for understanding.
-Works well on all timeframes; even 5min, I made a tooltip for recommended lengths.
-Customizable Signals; with the ability to turn on and off.
-Reversal signals: Pink and Blue circles can indicate reversals coming.
-Works well as a leading standalone indicator.
-Adjustable top signal row.
-Highlight background.
-Alerts
-Rules added (hover over).
Cheers,
Mike

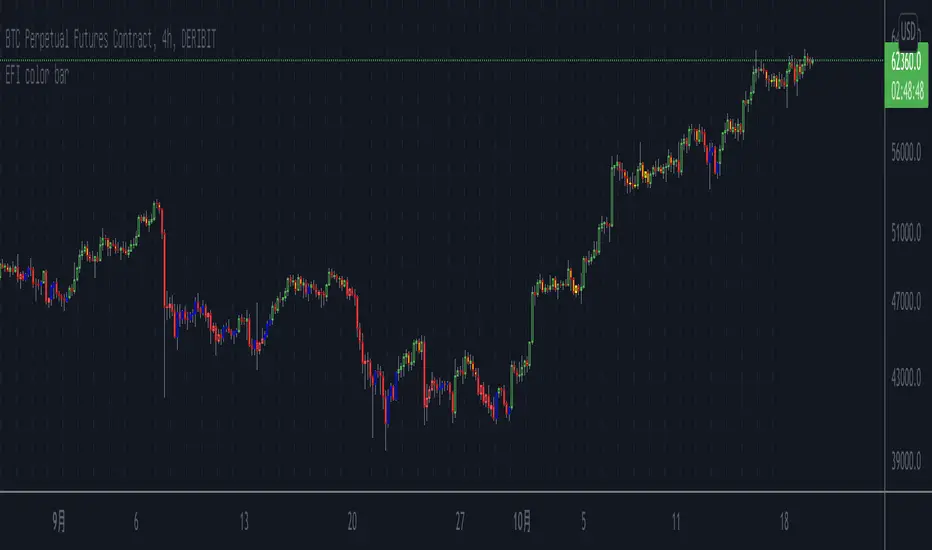
Elder's Force Index Color BarBased on the Elder's Force Index (EFI) , +/- of the EFI and its ema is used to describe the rise, fall or possible reversal of the market, and finally shown by bar color.
The green bar represents a strong bull and the red bar represents a strong bear;
The blue bar indicates that the downtrend is exhausted and may rise. Likewise the yellow bar.
Of course, it is difficult to buy the bottom and sell the top at any time. This indicator needs to be judged together with the pattern or other indicators that predict reversals in order to increase the win rate.
Happy Trading.
根据Elder's Force Index修改而成,取消了幅图指标,仅用bar color来表现上涨,下跌和转折。
绿色k线代表上涨动能充足,红色k线表示下跌动能充足;
蓝色k线表示下跌力竭,可能会上涨;
黄色k线表示上涨力竭,可能会下跌。
当然,任何时候抄底摸顶都是困难的,该指标需要和形态或者其他预测反转的指标一起判断才能增加成功率。
祝交易愉快。
緑は上昇トレンドで、赤は下落トレンドです;
青は下落が尽きて上昇する可能性があることを示すことで、黄色は上昇が終わり、下落の可能性があることを示しています。
成功率を高めるためには、パターンや反転を予測する他の指標と合わせて判断する必要があります。
Happy Trading。
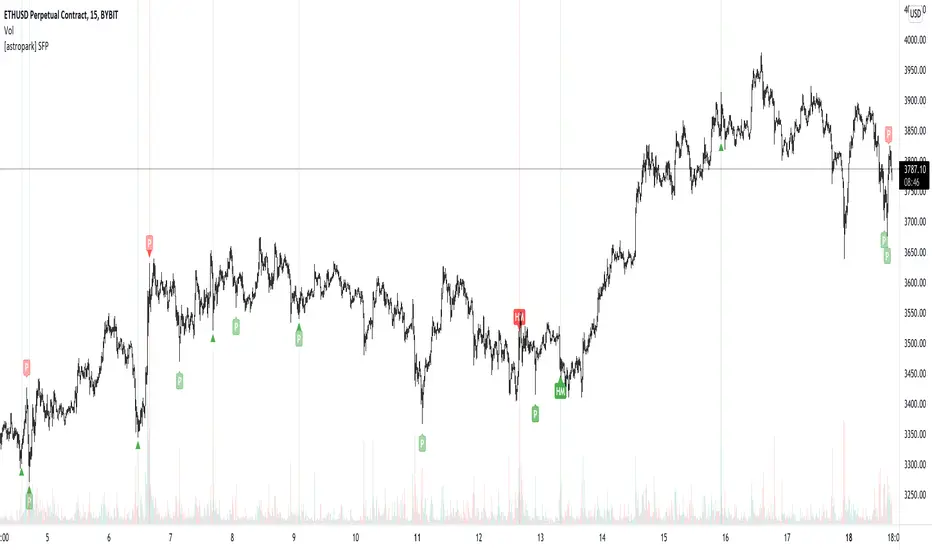
[astropark] SFP - Swing Failure PatternDear Followers,
today I'm glad to present you my Swing Failure Pattern Analyzer indicator.
As you know, the Swing Failure Pattern (SFP) is a very powerful candlestick pattern, because it highlights trend reversal points : if trend changes you want to know it, right?
This indicators highlights for you both Tops and Bottoms , that may be just local or historical.
To build this tool I mixed my experience on the field and some of the logic you can see in the following indicators of mine:
Pinbar that matters
Volume that matters
Volume Analyzer
This indicator works on every timeframe and market , it's quite responsive to market movements so it's especially good on volatile markets.
It is designed for fast day-trading / scalping , but as you trade on high timeframes is great for swing trades.
The indicator identifies candles that fall into the Swing Failure Patter category, but also candles other 4 categories of reversal candlestick pattern:
pinbar / hammer
hanged man
reversal by volume analysis
reversal by candle wicks analysis
Of course you can
customize colors
turn on or off what you prefer to see and what you don't
set alerts everything you see plotted
The indicator does NOT repaint of course.
This is a premium indicator , so send me a private message in order to get access to this script.
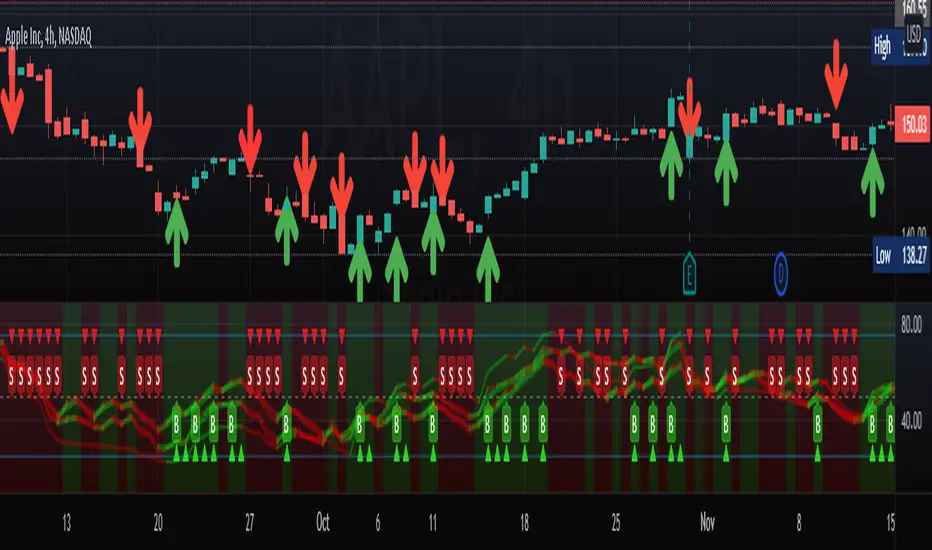
M.Right_ OBV / Volume Smoothed RSI & 3 RSI EMAsFirst, I'd like to thank all those coders who've inspired me to learn and code my own indicator. This is the result of tireless hours of work learning to code and tweaking until everything fits exactly what I was looking for. After using it for a while and seeing the benefits personally, I figured now might be a good time to share with everyone while we are in such great market volatility , maybe I can save you some losses.
Basically, my indicator is meant to use RSI, Volume, and Volatility to show where oversold and overbought levels are, but also good times to buy and alerts.
I've tried to make my indicators as customizable as possible with all the bells and whistles you'd expect, but to have Proprietary calculations under the hood that you probably won't find anywhere else.
This indicator is a great pair with my Top and Bottom Finder.
Features:
Works on all timeframes.
Alerts.
Background highlights.
Buy/Sell signals and arrows (with the option to remove them).
Let me know if you have any questions, and enjoy.
Cheers,
Mike
M.Right_Top & Bottom Finder 1.0Thank you @Lazybear for the calculations for squeeze and BB, and all of the other great pine-coders who inspired me to create my own indicator to share!
This is the result of hours of work learning to code pine and tweaking until everything fits exactly what I was looking for.
After using it for a while and seeing the benefits personally, I figured now might be a good time to share with everyone while we are in such great market volatility, maybe I can save you some losses.
Basically, my indicator is meant to use volatility and standard deviations to show you the top and bottom of trends.
It does indeed work on lower timeframes, I typically use it on 5m, 30m, 4hr, and 1d.
What to look for:
When it detects the trend bottoming it will send a green histogram bar down, I also created a different shade green for even more likely bottoms.
When it detects the top of the trend it will send a red bar up, I have a brighter red for more certain tops.
The length of the histogram bar is also an indication as well. Sometimes there will be a reversal while still just showing the gray bar.
I just added alerts, so hopefully those work. If not, I will update.
Let me know if you have any questions, and enjoy.
Cheers!

Combo Backtest 123 Reversal & T3 Averages This is combo strategies for get a cumulative signal.
First strategy
This System was created from the Book "How I Tripled My Money In The
Futures Market" by Ulf Jensen, Page 183. This is reverse type of strategies.
The strategy buys at market, if close price is higher than the previous close
during 2 days and the meaning of 9-days Stochastic Slow Oscillator is lower than 50.
The strategy sells at market, if close price is lower than the previous close price
during 2 days and the meaning of 9-days Stochastic Fast Oscillator is higher than 50.
Second strategy
This indicator plots the moving average described in the January, 1998 issue
of S&C, p.57, "Smoothing Techniques for More Accurate Signals", by Tim Tillson.
This indicator plots T3 moving average presented in Figure 4 in the article.
T3 indicator is a moving average which is calculated according to formula:
T3(n) = GD(GD(GD(n))),
where GD - generalized DEMA (Double EMA) and calculating according to this:
GD(n,v) = EMA(n) * (1+v)-EMA(EMA(n)) * v,
where "v" is volume factor, which determines how hot the moving average’s response
to linear trends will be. The author advises to use v=0.7.
When v = 0, GD = EMA, and when v = 1, GD = DEMA. In between, GD is a less aggressive
version of DEMA. By using a value for v less than1, trader cure the multiple DEMA
overshoot problem but at the cost of accepting some additional phase delay.
In filter theory terminology, T3 is a six-pole nonlinear Kalman filter. Kalman
filters are ones that use the error — in this case, (time series - EMA(n)) —
to correct themselves. In the realm of technical analysis, these are called adaptive
moving averages; they track the time series more aggres-sively when it is making large
moves. Tim Tillson is a software project manager at Hewlett-Packard, with degrees in
mathematics and computer science. He has privately traded options and equities for 15 years.
WARNING:
- For purpose educate only
- This script to change bars colors.
Combo Backtest 123 Reversal & Stochastic Crossover This is combo strategies for get a cumulative signal.
First strategy
This System was created from the Book "How I Tripled My Money In The
Futures Market" by Ulf Jensen, Page 183. This is reverse type of strategies.
The strategy buys at market, if close price is higher than the previous close
during 2 days and the meaning of 9-days Stochastic Slow Oscillator is lower than 50.
The strategy sells at market, if close price is lower than the previous close price
during 2 days and the meaning of 9-days Stochastic Fast Oscillator is higher than 50.
Second strategy
This back testing strategy generates a long trade at the Open of the following
bar when the %K line crosses below the %D line and both are above the Overbought level.
It generates a short trade at the Open of the following bar when the %K line
crosses above the %D line and both values are below the Oversold level.
WARNING:
- For purpose educate only
- This script to change bars colors.

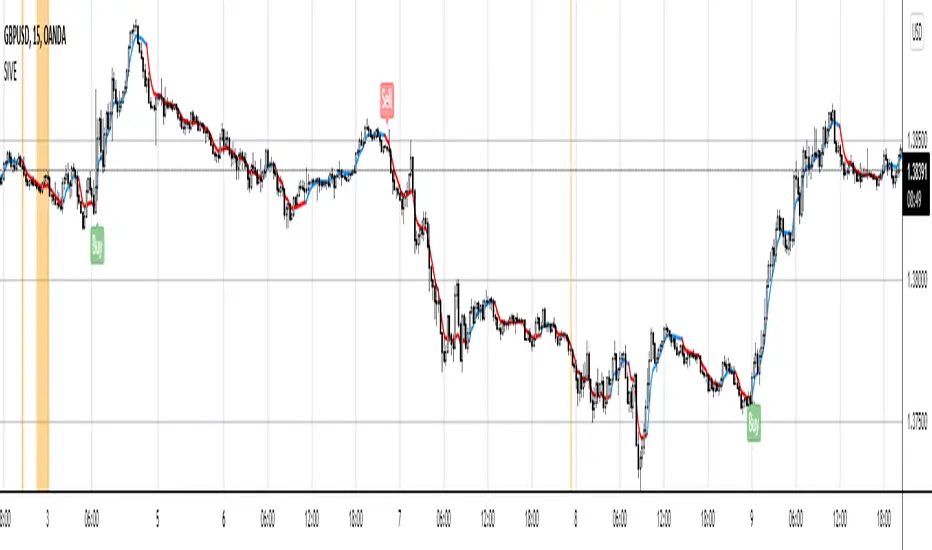
SIVE 1.0SIVE 1.0
What is SIVE?
SIVE stands for Systematic Institutional Volatility Expansion , SIVE uses a variety of different statistical indicators to gauge volatility along with trend correlation and other measures to filter and define a price move. This system was originally set out to redefine what a 'Trend Following System' could be; we achieved more than just that. We had created what is considered to be one of the first retail quantitative trading system, that incorporates trend following mechanics as well as trend reversal techniques. All while being aligned/correlated to trend and volatility. Something truly powerful to put into the hands of the every day trader, demystifying what quant trading can be while easily presenting it in a way where even your mom could learn how to use the system without being overwhelmed.
What makes this different from any other trading system?
SIVE raises the bar on what traditional indicators and trading systems can do, traditionally you have lagging indicators that only tell you what happened in the past with no correlation to the market or what can happen in the future. Really providing little to no statistical value, yet completely idolized by the retail world. Where SIVE exceeds these systems is all in the math and the application of those formulas to the time/price, finding the synchronicities to exploit for profits as well as exploiting the high probabilities of non-random events. How we do it? well that's in the secret crabby patty formula.
Where we are now, and where we plan to go
SIVE as it stands right now is the very first iteration of the retail quantitative trading system, it is performing exceptionally well but we aren't take that as our standard as we want to always raise the bar. as it stands, we are already working on the updates to come that will dwarf anything we've done in the past.
Our goal with SIVE is to be able to provide an easy to learn and easy to profit trading system that will provide the retail public with a trust worthy system to use. In the future our updates will carry heavier weight on key aspects like Risk to Reward, Win rates and capturing those big parabolic movements that everyone dreams of. Far fetched? for the traditional indicator junkies, but for a Quant it is just a matter of time.
What does it perform best on?
Simply put, yes... We set out to create this to be used for any trading instrument and any timeframe. Intraday timeframes have been shown to give more trades and typically higher reward trades as your able to execute with a high degree of accuracy 1:2 is very modest and can easily be achieved but we have also seen so so many trades run higher than 1:10 and even 1:20!! but as you already may know the market doesn't always give those favorable conditions to trade that high of a Risk to Reward all the time.
Stocks, Crypto, Forex, Metals, Energies, Indices, etc. are all tradeable with SIVE
We hope to see you in the discord!
]https://discord.gg/rqPBKbGtyu
Images provided below are just the tip of the iceberg on what SIVE can do!
Trend channel [log scale] with projection forecastTrend channel with projection forecast
This indicator is used to model data where growth or decay accelerates rapidly at first and then slows over time.
Because the channel distance is based off the largest pullback or highest peak within a trend, for effectively drawing and using this indicator it is recommended that this type of indicator is applied to mature trends .
This model is interesting for the long term series data (such as 10 or 20 years span) because can be plotted correctly on logarithmic charts .
Technical issues
*The user have to pan over the chart from the beginning to the end of the study range (such as 10 years of bars) so the pine script could generate those lines on the chart.
*If on the chart the number of bar is less than the lookback period, it won't generate any lines as well.
Disclaimer
Success in trading is all about following your trading strategy and indicators should fit into your own strategy, and not be traded purely on.
This script is for informational and educational purposes only. Use of the script does not constitute professional and / or financial advice. You are solely responsible for evaluating the outcome of the script and the risks associated with using the script. In exchange for the use of the script, you agree not to hold monpotejulien TradingView user responsible for any possible claims for damages arising out of any decisions you make based on the use of the script.

Volume Pressure AnalysisVolume Pressure Analysis is a new concept I have been working on designed to show the effort required to move price. An ideal tool for confirming trends or locating reversals early. This indicator can highlight whale action and market manipulation. It calculates volume vs volatility and displays the results as a meter:
Above 0 shows how easy price action is traveling, the bigger these bars the less volume and effort is required to push price. These are indicated with a teal or red arrows and can confirm the beginning or continuation of a trend. This is the natural direction the chart wants to travel at that time.
Below 0 shows how hard price is to move. The bigger these bars the more volume and effort is required to push price. When whales and market makers push price against its will these bars will get bigger.
Yellow arrows signal pressure in that direction and excessive amounts of volume is required to move price. These signals can lead to reversal/ pivot points as price action struggles to continue its trend. These signals can be turned on in settings or use the overlay version of this script to display signals on chart. This is a very powerful tool when used with relative volume.

Volume Pressure Analysis - OverlayVolume Pressure Analysis is designed to show effort required to move price. This script is the overlay version that displays signals on the candles as well as changes the bar colors. Yellow arrows signal pressure in that direction and excessive amounts of volume is required to move price. These signals can lead to reversal/pivot points as price action struggles to continue its trend. Red and teal arrows indicate free flowing price action where very little effort or volume is needed to push price. These signals can confirm the beginning or continuation of a trend and is the natural direction the chart wants to travel at that time. For more information please check out the main Volume Pressure Analysis indicator.

1k TICK arrowsThis plots green up arrows when the TICK index goes to -1,000 or lower or red down arrows when the TICK index goes +1,000 or higher. Can be used as a short term reversal signal (not investment advice). Will unfortunately plot on all charts but should only be relevant for US equity indices, mainly S&P500/ES futures. Indicator will adapt to the charts time frame and is hard coded to only show during 9:30-16:00 EST.