Trend Reversal Probability CalculatorThe "Trend Reversal Probability Calculator" is a TradingView indicator that calculates the probability of a trend reversal based on the crossover of multiple moving averages and the rate of change (ROC) of their slopes. This indicator is designed to help traders identify potential trend reversals by providing signals when the short-term moving averages start to slope in the opposite direction of the long-term moving average.
To use the indicator, simply add it to your TradingView chart and adjust the input parameters according to your preferences. The input parameters include the length of the moving averages, the ROC length (trend sensitivity), and the reversal sensitivity (signal percentage).
The indicator calculates the ROC of the moving averages and determines if the short-term moving averages are sloping in the opposite direction of the long-term moving average. The number of short-term moving averages that meet this condition is then counted, and the probability of a trend reversal is calculated based on the percentage of short-term moving averages that meet this condition.
When the probability of a trend reversal is high, a bullish or bearish signal is generated, depending on the direction of the reversal. The bullish signal is generated when the short-term moving averages start to slope upward, and the bearish signal is generated when the short-term moving averages start to slope downward.
Traders can use the "Trend Reversal Probability Calculator" to identify potential trend reversals and adjust their trading strategies accordingly. It is important to note that this indicator is not a guarantee of a trend reversal and should be used in conjunction with other technical analysis tools to make informed trading decisions.
Reversal

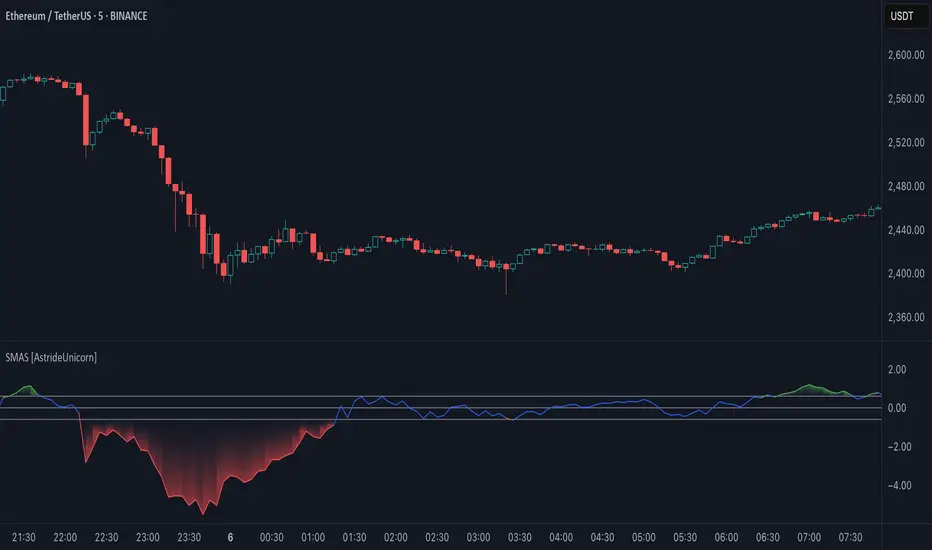
Simple Moving Average Slope [AstrideUnicorn]The Simple Moving Average Slope indicator (SMAS) is a technical analysis tool designed to help traders detect the direction and strength of the current trend in the price of an asset. It is also a great tool for identifying sideways markets. The indicator plots the slope of a simple moving average (SMA) of the closing prices over a specified time period. The slope is normalized by dividing it by the standard deviation of the slope over a longer time period.
HOW TO USE
Traders can use the Simple Moving Average Slope indicator in various ways. One common way is to look for bullish or bearish signals. A bullish signal occurs when the normalized slope rises above a predetermined threshold, resulting in the indicator turning green, indicating an upward trend in the market. Conversely, a bearish signal is generated when the normalized slope falls below the negative value of the threshold, causing the indicator to turn red, signaling a downtrend in the market. When the normalized slope falls between the positive and negative threshold values, a neutral signal is generated, indicating that the market is moving sideways. This can help traders avoid false trend signals from other indicators and strategies that may occur when the market is in a sideways regime. Additionally, traders can use the Simple Moving Average Slope indicator in conjunction with other technical indicators to confirm the trend direction.
SETTINGS
Window - specifies the number of bars used to calculate the SMA slope. The default value is 20.
Threshold - specifies the threshold value used to generate the bullish and bearish signals. The default value is 0.6. Traders can adjust these settings based on their trading strategy and the asset being analyzed.
Reversal Points [CC]This original script was created based on a suggestion from @kerpiciwuasile. My original Reversal Points script was removed because I modeled it after an indicator by Demark, but this script will have no such issues. Reversal points are an exciting concept for me because it is such a useful tool when placing trades. This is my first attempt at a new overall layout for my script and I included a bunch of customization so let me know what you think.
My script works by finding lows that are surrounded by bars that have higher lows and highs that are surrounded by lower highs. I use this logic to find short term lows or highs and I use the same concept to find mid-term lows or highs but a mid-term high is a short term high surrounded by lower short term highs and a mid-term low is a short term low surrounded by higher short term lows. And of course this means that long term highs or lows use the same logic to find highs or lows that are surrounded by mid-term highs or lows. I would recommend to buy at the long term low points or sell at the long term high points.
Keep in mind of course that short term highs and lows are very common and reversal points will get rarer as you look for longer term reversal points. I would recommend to experiment and see which reversal points work best for you and of course, know that there is no magical formula to use for all stocks.
Also there are a few scenarios where you want to enable or disable the inside bar setting. You would want to ignore inside bars if the market is currently very volatile or if you are using this indicator on a crypto chart. This is not an exact science but more of a recommendation, so feel free to experiment with it.
Reversal points are crucial for traders as they signal a potential change in the market trend, providing opportunities for entry or exit.
In summary, this code snippet is a powerful tool for traders to detect and visualize reversal points on a trading chart, providing valuable insights into potential trend changes and facilitating more informed trading decisions.
Let me know if you would like me to publish other scripts or if you want me to do something custom for you!

Trend Reversal System with SR levelsHello All,
This is the Trend Reversal System with Support/Resistance levels script. long time ago I published it as closed source but now I upgraded it and and published as open-source with a different name. I hope it would be useful for you all while trading/analyzing.
The script has some parts in it: Setup, Count, SR levels, Risk levels & Targets . Now lets check them:
Setup Part: it has two part, Buy or Sell Setup. one of them can be active only. Buy setup: if current close checks if current is lower/equal than the close of the 5. bar. if yes then the script increases number of buy setup. and if it reaches 9 then the script checks if current low is lower/equal than the lows of last 3. and 4. bars, or if the low of the last bar is lower/equal than the lows of last 3. and 4. bars. if yes then the script increases the buy setup by 1. if these conditions met then it puts the label 'S' , same for Sell setup. S labels on both setup are potential reversals.
Count Part: If buy or sell setup reaches the 9 then Count part starts from 1. lets see buy count: If current close is lower/equal than the low of the 3. bar and buy count is lower than 12 or low of the bar 13 is less than or equal to the close of bar 8 then buy count increase or it's completed. if it's completed then the script puts C label, and it's potential reversal. of course there are some conditions that can cancel the count buy/sell or recycle/restart.
By using Setup and Count levels the script can show Support/Resistance Levels, Risk levels & Targets. SR levels are potential reversal levels.
Lets see some example screenshots:
Support/Resistance levels:
Potential Reversal levels and how setup/counts are shown:
Count part can recycle and the script shows it as 'R' , ( you can see the conditions for Recycle in the script ):
Count can be cancelled and and it's shown as 'x'
If the scripts find 9 on Setup or 13 on Count then it checks if it's a good level to buy/sell and if it decides it's good level then it shows TRSSetup Buy/Sell or TRSCount Buy/Sell and also shows the target. in following example the script checks and decide it's a good level to take long position. it can be aggressive or conservative, Conservative is recommended.
Enjoy!

Deviations from ARL (DARL)Similar to Bollinger Bands, this indicator uses standard deviations but from Adaptive Rebound Lines (See: 'ARL').
The adaptiveness of the 'ARL' is further affected by volatility and helps greatly in spotting the possible strength and direction of rebounds.
All this information is presented with minimal lag thanks to the rebound qualities of the 'ARL' adapting to market volatility.
----- HOW TO USE IT -----
1) Use with 1h time frame.
2) Smaller width typically means that price will be moving is smaller movements.
3) Small price movements while the width is increasing typically means that a large price move will occur soon.
4) Larger width typically means that price will be moving in larger movements.
5) Very large width with sideways price typically means that the price will have a bias towards the center.
Note: A V-Offset of 1 is also a good setting alternative for this indicator.
----- HOW THIS INDICATOR IS ORIGINAL; WHAT IT DOES AND HOW IT DOES IT -----
This indicator has an original, unique ability in anticipating the strength and direction of a price rebound while at the same time showing the bias of the rebound with minimal lag.
It does this by letting the adaptive qualities of the 'ARL' be affected by market volatility, not just by price movement alone.
----- VERSION -----
This indicator is not a variation, replacement, or presentation of the 'ARL' or the 'ARL' Bands -- it merely derives its base calculations for standard deviations from the 'ARL'.
However, this indicator affects the calculations of the standard 'ARL' with volatility and creates a new, unique calculation.
It thus presents a totally different context for price action.
A standard 'ARL' helps in finding possible rebounds but it does not help in finding the strength of them or the directional bias of a rebound.
This is because a standard 'ARL' is more negligent of market volatility and adapts to price movement alone.
In contrast, this indicator does help in anticipating the strength and direction of the rebound because it adapts deviations from an 'ARL' to market volatility.
Therefore, the lines cannot be adjusted individually but in pairs and only further from their respective, mirroring lines.

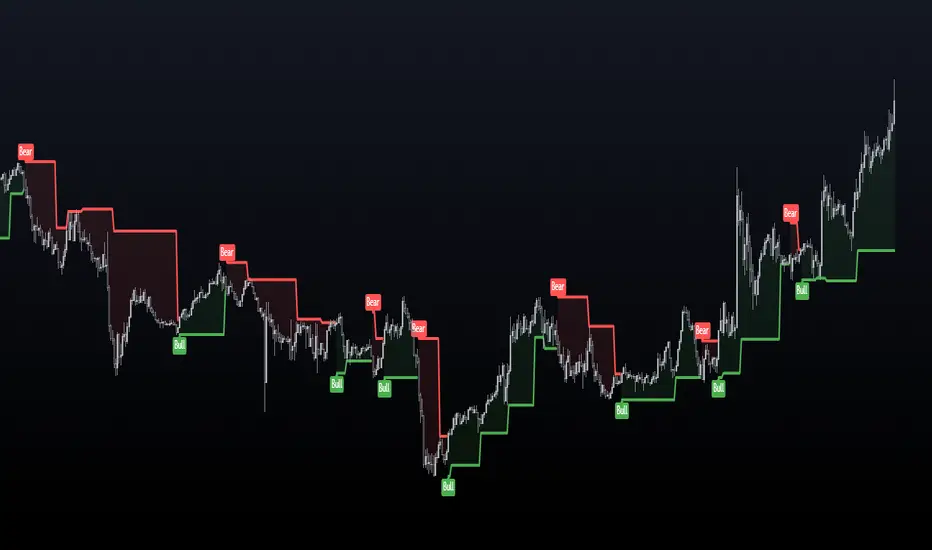
Sushi Trend [HG]🍣 The Sushi Roll, a trading concept conceived at a restaurant by Mark Fisher.
While the indicator itself goes by Sushi Trend, it is completely backed by the idea of Mark Fisher's Sushi Roll Reversal Pattern. No, it has nothing to do with raw fish, it just so happens that somebody was ordering sushi during the discussion of the idea, and that's how it got its name.
📝 Origin
First mentioned in his book, The Logical Trader --- the idea of the Sushi Roll is to serve as an early warning system to identify reversals in the market. Fisher defines the pattern as a series of 10 bars, split into two different sections, seen as 5 and 5. In order for the pattern to be emitted, the 5 bars to the right must completely engulf the 5 bars to the left. It's not a super complex system and is in fact extremely simple to grasp.
📈 Supertrend Similarities
Instead of displaying the pattern in the way Fisher meant for it to be portrayed (as seen in the photo above), I instead turned it into an indicator similar to that of Supertrend while also inheriting the same concepts from the pattern. I did this because the pattern itself has inconsistencies which can be quite noticeable when trading with it after a while. For example, these patterns can occur even during consolidating periods, and even though the pattern is meant to be recognized during trending markets, the engulfing bars can sometimes be left with indecisive directions.
➡️ The Result
Here is the result, visualized to be better in a trending format. (The indicator will not contain the boxes.)
While Fisher does mention the pattern to include 10 bars, you can actually use this pattern with any number of bars. At the end of the day, it's a concept derived from a discussion at a Japanese restaurant, and a pattern that has been around for years that has seen results. Due to this, I added an input option to control the series of bars for right-bar engulf detection.
To reassure the meaning of the pattern --> "A series of 10 bars" means 5 left bars and 5 right bars. So if you want to check if 5 right bars are engulfing the previous 5 bars (as seen in the photo above), you would want to select 5 in the input settings.
You can learn more about it from the following links
Market Reversals and the Sushi Roll Technique
The Logical Trader
Rainbow Collection - BlueSlopes are an increasingly key concept in Technical Analysis. The most basic type is to calculate them on the prices, but also on technical indicators such as moving averages and the RSI.
In technical analysis, you generally use the RSI to detect imminent reversal moves within a range. In the case of the Blue indicator, we are calculating the slope of the market price and then calculating the RSI of that slope in order to detect instances of reversal.
The Blue indicator is therefore used as follows:
* A bullish signal is generated whenever the 21-period RSI of the 21-period market slope surpasses 30 after having been below it but remains below 35.
*A bearish signal is generated whenever the 21-period RSI of the 21-period market slope breaks 70 after having been above it but remains above 65.
The aim of the Blue indicator is to capture reversals as early as possible through a combination of slopes and entry techniques.

Rainbow Collection - VioletMoving averages come in all shapes and types. The most basic type is the simple moving average which is simply the sum divided by the quantity. Therefore, the simple moving average is the sum of the values divided by their number.
In technical analysis, you generally use moving averages to understand the underlying trend and to find trading signals. In the case of the Violet indicator, we are using a Hull moving average which is a special variation based on different weights to minimize lag.
The Violet indicator is therefore used as follows:
* A bullish signal is generated whenever the close price surpasses the 20-period Hull moving average while the previous close prices from periods were all below their respective Hull moving average of the period.
*A bearish signal is generated whenever the close price breaks the 20-period Hull moving average while the previous close prices from periods were all above their respective Hull moving average of the period.
The aim of the Violet indicator is to capture reversals as early as possible through a combination of lagged conditions based on the Fibonacci sequence.

Reversal PointsHi , in this script i tried to find reversal points on big trends. For this purpose i have used Supertrend and Donchian channels. I combined both in a single indicator for finding reversal points. I am suggesting for using higher time frames like 4 hours or 1 day. It will be work in lower time frames too. But the signals will be less reliable than higher timeframes. Here is settings in this script:
New low sensitiity : this setting for donchian channels lookback. Bigger value result as less signals.
Atr Period: Period for Atr , it is for supertrend indicator in it.
Source: Source for supertrend indicator.
Atr Multiplier : Atr multiplier setting for Supertrend. Bigger value will be result as less signals.
Good luck.
Enes.

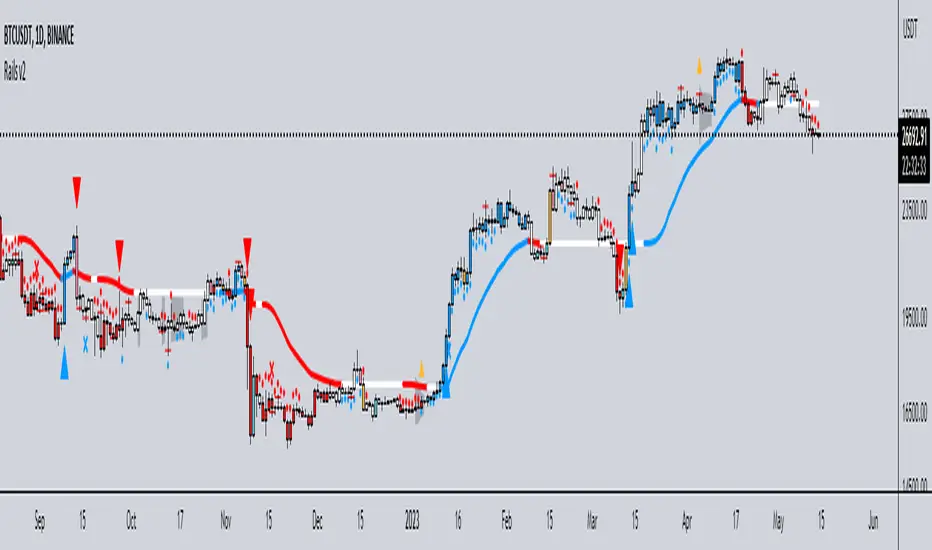
Rails v2Centered around a Variable Moving Average (Rail Line). The Variable Moving Average (VMA) is a study that uses an Exponential Moving Average being able to automatically adjust its smoothing factor according to the market volatility.
In addition to the Rail Line or VMA, the indicator makes use of Bollinger Bands in two ways. First, it displays when the Bollinger Bands are in a squeeze and the potential direction of the breakout. The "squeeze" is the central concept of Bollinger Bands. When the bands come close together, constricting the moving average, it is called a squeeze. A squeeze signals a period of low volatility and is considered by traders to be a potential sign of future increased volatility and possible trading opportunities. The Bollinger Bands are also utilized to highlight when price action might reverse. This signals when price closes outside of the bands, quickly reverts and closes within the bands
The indicator makes use of the Hull Moving Average as a method to quickly capture price action moves thanks to its ability to eliminate lag while managing to improve smoothing at the same time.
Finally, the indicator utilizes Volume Point of Control (VPOC) to determine points in price where the highest amount of volume was traded. Unlike the market profile, the indicator will plot the Volume POC per candle. The script will also plot Trapped Volume. This is important as it tends to serve a signal for reversal. The more price moves away from the trapped volume, Long/Short traders might be forced to cover and price could quickly move away from the area.
DEFAULT SIGNALS: All signals can be turned Off/On by user
Dots = Short Term Trend
Rails Bar Color = Medium Term Trend
Rail Line (VMA) = Long Term Trend
Crossover of Moving Averages = X
Volume Pulse = Large Up/Down Triangle
Potential Bullish Reversal = Light Blue Candle
Potential Bearish Reversal = Pink Candle
Potential Reversal Confirmation = Orange Candle
Squeeze = Shaded White Cloud
Potential Breakout Direction = Small Golden Triangle
Hull Moving Average = Thin Golden Line
Volume POC = Thin Horizontal White Line on Candle
Volume Threshold POC = Thin Horizontal Yellow Line on Candle
Trapped Volume POC = Thin Horizontal Red Line on Candle
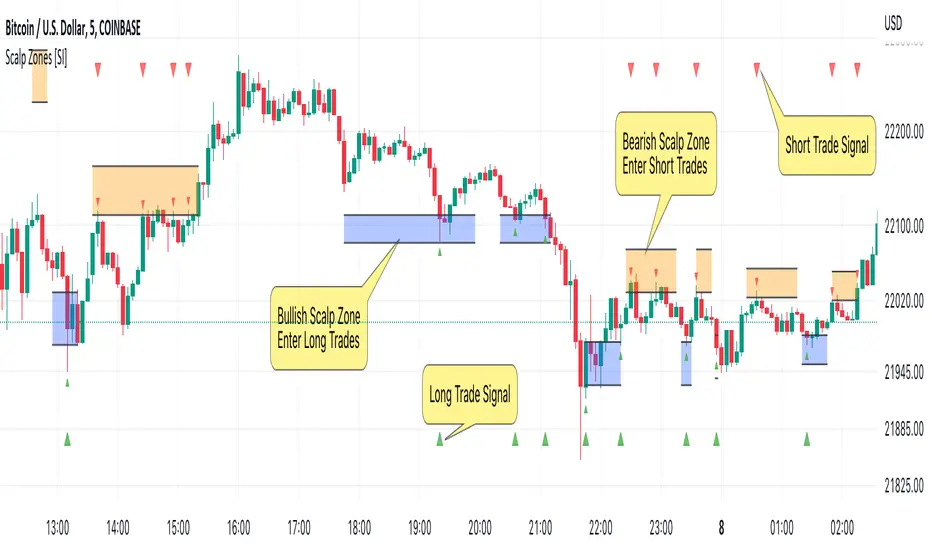
Scalp Zones [SI]The Scalp Zones indicator provides traders with visual ranges or "zones" on their charts, which can be used to quickly identify potential entry points for their trades in real time. Once price action enters the designated zone, trade signals and alerts will be generated, making it easier for both scalpers and swing traders to identify promising trading opportunities with greater confidence.
Although Scalp Zones is relatively easy to use, its simplicity is the end result of some interesting and rather complex analysis of price action and market structure.
█ CONCEPTS
Price Action vs Market Structure
For our purposes, “price action” refers to the movement of a security's price over time, whereas “market structure”, which is built upon price action, includes trends and support/resistance levels, breakouts, reversals of trend, etc. All of which can help traders identify potential entry and exit points for their trades.
Scalp Zone
A “Scalp Zone” is an area just above resistance or just below support that is deemed to be part of a trend that is exhausted or part of a “whipsaw” in the price action.
█ FEATURES
Can be combined with other indicators
Scalp Zones displays color-coded rectangles or "zones" that indicate areas of potential volatility, trend reversals and consolidation in price action. These zones can be used in conjunction with other indicators to more effectively identify trade opportunities.
Can also serve as an exit signal
Since Scalp Zones identifies areas where market participants are likely to enter or exit positions, they can offer some traders a way to spot good exits for their trades. For instance, if the price fails to surpass a significant resistance level (identified by a “scalp Zone”) and begins to decline, this may serve as a sell signal for traders who intend to lock in profits on a potential trend reversal.
Automatically adjusts to market conditions
Scalp Zones uses Average True Range (ATR) to dynamically adjust the size of the color-coded zones based on the current market conditions. By factoring in the ATR, the tool can produce zones that reflect the volatility of the market and adjust to changing levels of price movement.
█ LIMITATIONS
The Scalp Zones indicator is designed to provide traders with signals for potential entry points in the market, but it should not be used as the sole basis for making trading decisions. As with any trading indicator, it is important to acknowledge and understand that past performance does not guarantee future outcomes and that several other variables contribute to achieving success as a trader, especially proper risk management.
Return Abnormality Score [SpiritualHealer117]The Return Abnormality Score indicator is designed to help traders identify potential reversals in price by detecting abnormal daily returns beyond a certain significance level. The indicator uses a normal cumulative distribution function to calculate the probability of the daily return and flags it when it exceeds the specified significance level.
Traders can use this indicator by monitoring the abnormality score. If the daily return is negative, the probability is multiplied by a negative number. Therefore, if the abnormality score goes above the positive threshold, it suggests that the price is oversold, while if it goes below the negative threshold, it indicates that the price is overbought. It can also be helpful for spotting bear or bull traps due to their irregular behavior.
Depending on the trader's preference, the indicator can be smoothed or unsmoothed.
This indicator should be paired with other technical analysis tools like SSL Hybrid for trend confirmation, and proper risk management strategies.

Bellcurves (Zeiierman)█ Overview
Bellcurves (Zeiierman) models impulse-driven expansion and contraction in price using a pair of adaptive “Bellcurve” flows (positive/negative), momentum dots, a sensitivity/normalization layer, pre-alerts, decline detection, and a built-in divergence suite. Instead of treating every bar equally, it builds scale-aware impulse fields from a weighted price source, normalizes them into comparable magnitudes, and then highlights impulse clusters, pre-alerts (rising pressure), and impulse declines. These waves behave like impulse envelopes: when expansion persists, columns cluster and momentum dots fire; when pressure fades, decline signals and divergences appear.
Use it to spot the first thrust of a new leg, the final push before exhaustion, or quiet accumulation/distribution within ranges.
⚪ Why This One Is Unique
Bellcurves (Zeiierman) combines several adaptive mechanisms into a single, self-tuning framework that captures both momentum expansion and directional decay. Its dual Bellcurve core extracts directional strength through asymmetric smoothers and non-linear amplification, isolating genuine impulses from random volatility. A Quick-Response mode enhances sensitivity in fast markets, while the normalization layer preserves consistency across instruments and timeframes.
█ Main features
⚪ Bellcurves
The Positive and Negative Bellcurves form the foundation of the indicator, visualizing directional expansion in price. Each curve is derived from weighted price dynamics and transformed into an adaptive field that expands with trend acceleration and contracts during exhaustion. Displayed as column waves (or oscillator-style), they reveal the rhythm of market impulses; steady clustering denotes continuation, while isolated bursts or fading peaks hint at potential reversals.
Price Acceleration
Trend Acceleration
Note: To visualize trend acceleration and sustained high-momentum trends, increase the Bellcurve Trend Length parameter to 200. This setting emphasizes long-term directional strength and filters out short-term noise.
Reversals
⚪ Impulse Dots
Impulse Dots mark the first and last bursts within a momentum cluster. Detected through adaptive clustering logic, these dots appear as green (positive) or red (negative) signals that often coincide with early breakouts or terminal exhaustion zones. Traders can interpret the first dot as potential momentum ignition. Alerts are provided for each stage, enabling fast reaction to shifting impulse conditions.
⚪ Divergences
The built-in Divergence Engine automatically identifies regular bullish and bearish divergences between price and the Bellcurves. By analyzing the declining and rising segments of the curves, it detects subtle mismatches between price movements and underlying impulse strength.
█ How to Use
⚪ Trend Trading
The Bellcurves help visualize the rhythm of market trends through alternating Positive (green) and Negative (red) Bellcurves. These represent periods of directional expansion when momentum builds and contraction when momentum fades.
Tip: To enable the Trend Bellcurves, increase Bellcurve Trend Length to 100–200. To detect regime shifts earlier, consider enabling Quick Response to respond more quickly to emerging trends.
Positive Trend (Green Bellcurve): Indicates bullish control. Sustained green clusters show stable upward participation and consistent buying pressure.
Negative Trend (Red Bellcurve): Indicates bearish control. Sustained red clusters reveal dominant selling pressure and downside continuation.
Trend Transitions
Positive Trend is Strengthening: When the green Bellcurve expands and height increases, momentum is accelerating and bullish conviction is building.
Positive Trend is Weakening: When the green Bellcurve contracts or begins to shrink, upward pressure is fading and potential exhaustion is developing.
Negative Trend is Strengthening: Red columns expand and deepen below the midline, bearish momentum building, and downside pressure increasing.
Negative Trend is Weakening: When the red Bellcurve contracts or softens, it signals that bearish pressure is losing force, a possible early sign of reversal or accumulation.
⚪ Reversal Trading
Reversal trading with the Bellcurves is one of the most effective and visually intuitive strategies, especially when going long after a Negative Bellcurve. These events often occur quickly and sharply, and when combined with key price levels such as the previous day’s close, high, or low, they can provide high-probability entry opportunities.
To focus on only the most meaningful reversals, disable “Activate Sensitive Bellcurves”. This filters out minor impulses and displays only the most significant Bellcurves across the chart, helping you isolate genuine exhaustion or inflection points.
Note: Reversal trading is inherently more challenging due to the increased volatility and emotional intensity (fear and greed) surrounding turning points. Use the Bellcurves as a confirmation tool, not a standalone entry signal. Always consider the broader market context. In strong trending markets, Bellcurve peaks may reflect continued strength rather than reversal.
A Green Positive Bellcurve forming after a fast upward move and rejection from a resistance zone can indicate a potential bearish reversal.
A Red Negative Bellcurve appearing near a support level often acts as confirmation for a potential bullish reversal, suggesting downside exhaustion and renewed buying interest.
⚪ Momentum / Impulse Trading
Momentum (or Impulse) Trading is designed for traders looking to enter in the direction of a strong, ongoing move. The Bellcurves indicator helps identify significant impulses on a higher timeframe, moments where directional pressure expands decisively. Once those impulses are identified, traders can refine entries on a lower timeframe, using an opposite Bellcurve as a trigger signal. This multi-timeframe approach allows for precise entries within larger momentum phases.
Bullish Momentum Trading
Start by analyzing a higher timeframe, for example, the 15-minute chart.
Identify a Positive (Green) Bellcurve and mark the first impulse dot, signaling the beginning of upward momentum.
Drop down to a lower timeframe (such as the 1-minute chart).
Wait for a Negative (Red) Bellcurve to peak; this short-term counter-impulse serves as a pullback entry point.
Enter long as the lower timeframe Bellcurve fades, aligning your trade with the dominant bullish impulse seen on the higher timeframe.
This approach ensures that your long entries occur within an expanding bullish phase, rather than chasing late moves.
Bearish Momentum Trading
Begin on a higher timeframe, such as the 1-hour chart, and locate a Negative (Red) Bellcurve with a visible impulse dot, confirming strong bearish momentum.
Shift to a lower timeframe like the 15-minute chart.
Wait for a Positive (Green) Bellcurve to peak; this short-term upward counter-move acts as a setup for continuation.
Enter short as that green Bellcurve begins to decline, synchronizing with the dominant bearish impulse from the higher timeframe.
This ensures that short trades align with expanding downside momentum, entering at moments of retracement within a broader selling phase.
█ How It Works
⚪ Bellcurve Construction Framework
The indicator generates directional Bellcurves through an adaptive modeling process that measures price displacement and trend curvature over time. Each Bellcurve reflects the evolving balance between expansion and absorption in market flow, forming the characteristic “bell” structures that widen during directional acceleration and compress during consolidation.
Calculation: Employs a multi-layered smoothing and normalization process to enhance directional clarity while preserving overall balance within the signal field.
⚪ Momentum & Cluster Engine
Momentum dots are generated through a multi-stage transformation that identifies the initiation and termination points of impulse clusters. By scanning for statistically relevant minima and maxima within the Bellcurve stream, the system isolates bursts of meaningful directional activity.
Calculation: Applies recursive power mapping and localized clustering to detect temporal impulse boundaries and validate “first” and “last” bursts within each momentum sequence.
⚪ Divergence Module
The divergence framework maps relationships between price structure and Bellcurve dynamics to uncover weakening or strengthening flows beneath visible price action. It detects classical bullish and bearish divergences and projects them directly onto the chart as lines and markers.
Calculation: Uses anchored decline-state tracking, relative high–low comparison, and vector slope analysis to measure phase displacement between price and impulse flow, confirming divergence integrity without lag.
-----------------
Disclaimer
The content provided in my scripts, indicators, ideas, algorithms, and systems is for educational and informational purposes only. It does not constitute financial advice, investment recommendations, or a solicitation to buy or sell any financial instruments. I will not accept liability for any loss or damage, including without limitation any loss of profit, which may arise directly or indirectly from the use of or reliance on such information.
All investments involve risk, and the past performance of a security, industry, sector, market, financial product, trading strategy, backtest, or individual's trading does not guarantee future results or returns. Investors are fully responsible for any investment decisions they make. Such decisions should be based solely on an evaluation of their financial circumstances, investment objectives, risk tolerance, and liquidity needs.
Paid script

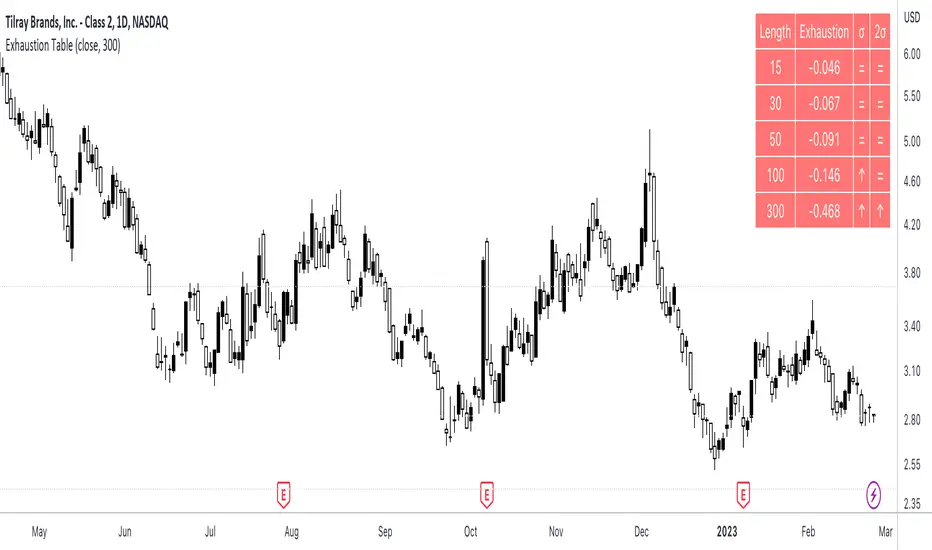
Exhaustion Table [SpiritualHealer117]A simple indicator in a table format, is effective for determining when an individual stock or cryptocurrency is oversold or overbought.
Using the indicator
In the column "2σ" , up arrows indicate that the asset is very overbought , down arrows indicate that an asset is very oversold , and an equals sign indicates that the indicator is neutral.
In the column "σ" , up arrows indicate that the asset is overbought , down arrows indicate that an asset is oversold , and an equals sign indicates that the indicator is neutral.
What indicator is
The indicator shows the exhaustion (percentage gap between the closing price and a moving average) at 5 given lengths, 15, 30, 50, 100, and 300. It compares that to two thresholds for exhaustion: one standard deviation out and one two standard deviations out.
Swing Levels and Liquidity - By LeviathanThis script will plot pivot points (swing highs and lows) in the form of lines, boxes or labels to help you identify market structure, “liquidity” areas, swing failure patterns, etc. You are also able to see the volume traded at each pivot point, which will help you compare their significance.
Bars Left-Right
A pivot high (swing high) is a bar in a series of bars that has a higher value than the bars around it and a pivot low (swing low) is a bar in a series of bars that has a lower value than the bars surrounding it. The Bars Left and Bars Right parameters are used to define the number of bars on the left and right sides of a pivot point that the function should consider when identifying pivot highs and lows in a time series. For example, if Bars Left is set to 5 and Bars Right is set to 6, the function will look for a pivot point by comparing the value of the current bar with the values of the 5 bars to its left and the 6 bars to its right. If the value of the current bar is higher than all of these bars, it is considered a pivot high point. These parameter can be used to adjust the sensitivity of the script (lowering the Bars Left and Bars Right parameters will give you more swing points and increasing the Bars Left and Bars Right parameters will give you fewer swing points).
”Show Boxes” - This will draw a box above the swing high and a box below the swing low to help you visualise a large area of interest around swing points. Additional box types and the width of the box can be adjusted in Appearance settings below.
”Show Lines” - This will draw a horizontal line at the level of each swing high and swing low.
”Show Labels” - This will plot a circle at the high point of each swing high and at the low point of each swing low.
”Show Volume” - This will display the amount of volume traded in a given swing point candle. It can help you identify the significance of a given swing point by comparing it to the volumes of other swing points.
”Extend Until Filled” - This will extend the swing point levels until they are mitigated by the price. Turning it off will continue plotting the levels just a few more bars after a swing point occurs.
”Appearance” - You can show/hide swing points, choose the colors of labels, lines and boxes, choose the size and positioning of the text, choose line and box appearance (adjust the Box Width when switching between timeframes!) and more.
More updates coming soon (MTF, more data…)

Fibonacci Levels Based on Supertrend [By MUQWISHI]A “ Fibonacci Levels Based on Supertrend ” indicator is supertrend indicator planned with Fibonacci retracements levels. Fibonacci retracements provides a sequence of levels starting from 0% to 100% in addition to extension levels. 0% is measured to be the initial Supertrend line, and 100% is the previous Supertrend line where it has been broken by candle. This tool could be valuable in terms of managing trades by setting targets and reducing the risk in the trend direction.
█ OVERVIEW
█ INDICATOR SETTINGS
Please let me know if you have any questions.
Thank you.

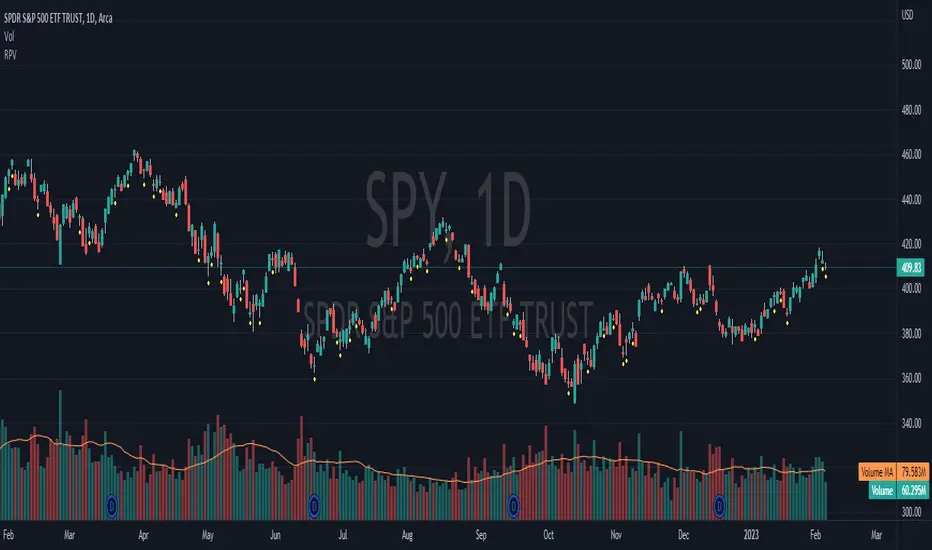
Relative Price Volume
Relative Price Volume is an indicator which shows anomalies between price and volume on a chart over a given period. The goal is to identify potential reversal and/consolidation areas for price as it relates to volume. It is a simple variation of a Volume at Price indicators. It can also be used to mark potential support and resistance lines on the chart as the areas it signals is where the price battles are waged.
Settings:
Period = length for which to calculate average candle body and average volume
Long Factor = relative size multiplier to determine if a candle is larger than average or if volume is higher than average
Short Factor = relative size multiplier to determine if a candle is smaller than average or if volume is lower than average
Anomaly Conditions
1. If a candle is larger than average and volume is lower than average, then this is an anomaly, and we should be on alert for a change in momentum.
2. if a candle is smaller than average and volume is higher than average, then this too is an anomaly and should put us on alert.
The indicator will draw a cross on the chart indicating the candle is that is flashing the warning that the run is done and a potential consolidation and/or reversal is pending. Used in conjunction with support and resistance levels this could signal a time to enter or exit a trade.
The default size factors considers a candle or volume:
1. Larger than average if it is 60% or more (.6) larger than average.
2. Smaller than average if it is 40% or less (.4) smaller than average.
Hope this helps! Happy trading!
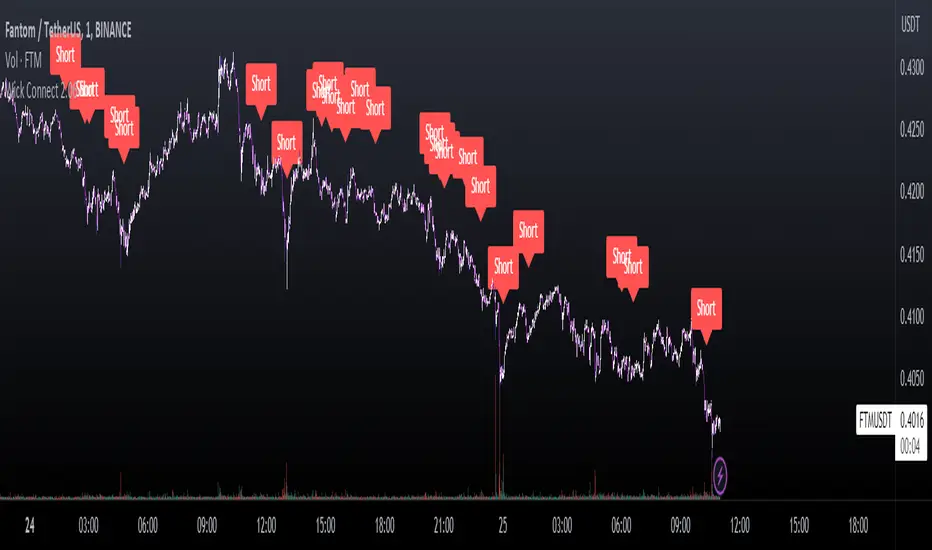
Wick Connect 2.0Wick Connect 2.0: the ultimate trading indicator deigned to provide great entries and keep you ahead of the markets. Wick Connect 2.0 was designed specifically to work with Wick Hunter, the lightning fast cryptocurrency trading robot that can trade for you 24/7. Simply input your UUID and start trading automatically with Wick Hunter!
The indicator first starts with RSI entries, which can be used to provide solid reversal trades. Users will have the ability to enter trades based on RSI values in oversold and overbought conditions. There is the ability to use multiple RSI values from multiple charts, which could be used to enter based on LTF + HTF RSI conditions meeting. The indicator combines multiple TradingView Technical Analysis indicators into one, and as such can be called our "Wick Hunter Multi-tool".
The following indicators are combined into one, and available with HTF Filtering:
- All Moving Averages
- Ichimoku Cloud
- Relative Strength Index
- Stochastic
- Commodity Channel Index
- Average Directional Index
- Awesome Oscillator
- Momentum
- MACD
- Stochastic RSI
- Williams Percent Range
- Bulls and Bears Power
- Ultimate Oscillator
The above indicators are calculated at an average and provide Buy/Strong Buy ratings and Sell/Strong Sell ratings. These ratings can be used to enter trades when all conditions meet.We have added the ability to utilize HTF Filtering which can allow our traders to enter trades if multiple timeframes agree.
PinBar Detector [Mr_Zed]Pinbar Detector is a technical analysis tool designed to detect Pinbar patterns in financial markets. Pinbars are reversal patterns that indicate a potential change in trend.
This indicator is based on an existing Pinbar detector in MQ4/5 format, originally developed by "earnforex".
The PineScript version is written to work in TradingView, and can be applied to any chart to identify Pinbar formations. The indicator uses specific criteria to identify Pinbars, such as the length of the wick and the relationship between the wick and the body of the candlestick. By displaying the Pinbars on the chart, traders can make informed decisions about entering or exiting trades based on their analysis of the market's potential trend reversal.
enjoy !

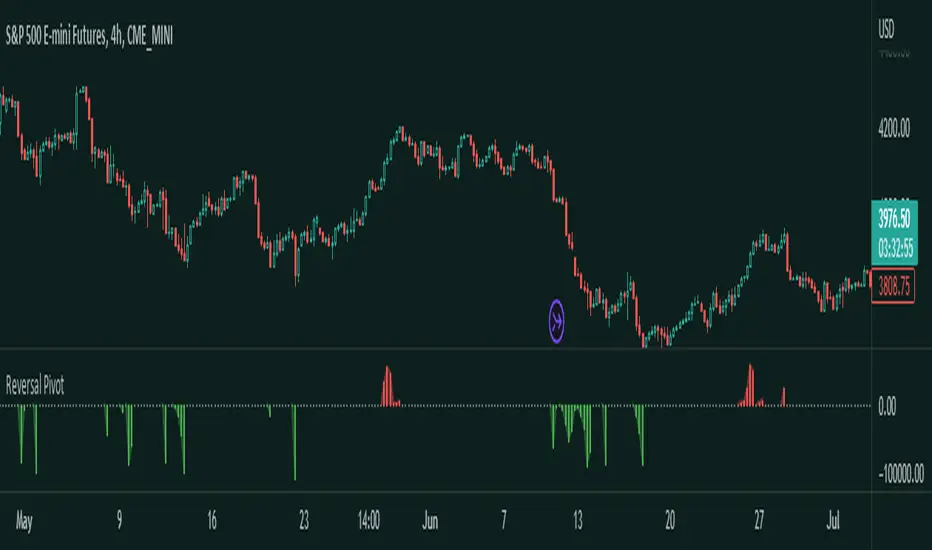
Reversal Pivot
Overview
Introducing the Reversal Pivot indicator - a tool for identifying potential reversal points in price. This algorithm takes into account multiple factors, including price action, volume, and pivot points, to give you a clear and accurate picture of where the market is heading to.
How it works
The indicator gets expansions and the highs and lows and uses the conditions along with pivots to determine whether a reversal is possible or not. Then it gets the volume to determine how strong this chance of reversal is.
How to use
The Reversal Pivot indicator alone shouldn't be used to find reversal points but it helps you get a clear insight on where possible reversals could happen for example, you could use it with mean reversion strategies to find the best entries.
Red bars signal a bearish reversal
Green bars signal a bullish reversal
This here is an example of a long entry if you are trading lets say the mean. You can wait for a bullish reversal on the Histogram plot and then enter, a reversal could happen.
This is an example of a short entry if you are also trading the mean.
Other features
This indicator allows you to customize the colors, and the histogram. If you don't like the histogram then you can change its plot style to whatever you would like.
Try the Reversal Pivot indicator today and find more possible reversal points!
Triangulation : Statistically Approved ReversalsA lot of calculation, but a simple and effective result displayed on the chart.
It automatically identifies a very favorable period for a price reversal, by analyzing the daily and intraday price action statistics from the maximum of the most recent bars from the historical data. No repainting. Alerts can be set.
The statistical study is done in real time for each instrument. The probabilities therefore vary over time and adapt to the latest information collected by the indicator.
The time range of the data study can be changed by simply changing the UT :
- 30m = 3.5 last months feed statistics
- 15m = 52 last days feed statistics
- 5m = 17 last days feed statistics (recommanded)
HOW TO USE
This indicator informs when we are in a time period strongly favorable to reversal.
==> Crossing probabilities of different kinds, in price and in time => Triangulation of top and bottom !
HOW It WORK :
fractal statistics on high and low formation.
hour's probabilities of making the high/low of the day are crossed with day's probabilities of making the high/low of the week.
First for the day, we study:
- value of the probability compared to the average probabilities
- value of the coefficient between the high probability and the low probability
which we then refine for the hour, with the same calculation.
Result: bright color for a day + hour with high probability, weak color if the probability is low but remains the only possible bias. Between these two possibilities, intermediate colors are possible - just like looking for shorts if the day is bullish, if it is a high probability hour!
This color is displayed in the background, only if we are forming the high of the day for tops, and the low of the day for bottoms - detected with a stochastic.
All probabilities are studied in real time for the current asset.
We will call this signal "killstats", for "killzones statistics"
fractal statistics on the probability of closure under specific predefined levels according to 36 cycles.
the probabilities of several cycles are studied, for example:
NY session versus London and Asian sessions, London session compared to its opening, NY session compared to its opening, "algorithmic cycles" ( 1h30), Opening of NY compared to its intersection with London..
Each cycle producing a probability of closing with respect to the opening price of each period. The periods are : (Etc/UTC)
15-18h / 15-16h / 9-13h / 14-17h / 18-22h / 10-12h / 9-10h30 / 10h30-12h / 12-13h30 / 13h30-15h / 15h-16h30 / 16h30-18h
The cycles can be superimposed, which allows to support or attenuate a signal for the key periods of the day: 9am-12pm, and 3pm-6pm. The period of the day covered by the study of cycles is 9h-22h.
Result : ==> a straight line with a half bell. Colors = almost transparent for 53% probability (low), and very intense for a high probability (75%). The line displayed corresponds to the opening price, which we are supposed to close within the time limit - before the end of the period, where the line stops.
If the price goes in the opposite direction to the one predicted by the statistics, then a background connects the price to the close level to be respected.
if direction and close is respected, nothing is displayed : there is no opportunity, no divergence between statistics and actual price moves.
By unchecking the "light mode", you can see each close level displayed on the chart, with the corresponding probability and the number of times the cycle was detected. The color varies from intense for a high probability (75%), to light for a low probability (53%)
We will call this signal "cyclic anomalies"
By default, as shown in the indicator presentation image, the "intersection only" option is checked: only the intersection between 1) killstats and 2) cyclic anomalies is displayed. (filter +-30% of killstats signals)
MORE INFORMATIONS
/!\ : during a backtest, it is necessary to refresh the studied data to benefit from the real time signals, and for that you have to use the replay mode. if "Backtesting informations?"is checked, labels are displayed on the graph to warn of the % distortion of the signals. I recommend using the replay mode every 250 candles, and every 1000 candles for premium accounts, to have real signals.
- Alerts can be set for killzone, or intersections ( As in presentation picture)
- The ideal use is in m5. It can trigger several times a day, sometimes in opposite directions, and sometimes not trigger for several days.
- Premium account have 20k candles data, and not 5k => signals may vary depending on your tradingview subscription.

GRIDBOT Scalper by nnamWhat is this Indicator used for?
Made specifically for GRID Bots
note: before continuing... this indicator works on any timeframe, but it WORKS BEST ON THE 15 MINUTE TIMEFRAME
Straters and Forex Master Pattern Value Line Traders use this to help determine when the price could reverse.
This indicator is a scalping indicator that produces signals when a "potential" reversal in price is indicated. When the price moves UP and a Potential Bearish Reversal Signal occurs, traders can use this signal as a potential SHORT entry signal for their Short Grid Bot. The process is the same in reverse. After a sustained move down, a Potential Bullish Signal can be used by the trader as a potential LONG entry signal for their GridBot.
As shown in the screenshot below, lines develop on the chart (either RED or GREEN) indicating that a sustained move in one direction is currently occurring; however, there is no potential reversal signal plotted (this means that price action is currently moving in one direction only).
As shown in the screenshot below, lines can be used as a stop-loss after entering the GRIDbot. (usually, by this time, the Grid Bot is in Profit as it usually moves in the opposite direction first)
What this Indicator Does
The GRIDBOT Scalper provides information regarding potential reversals in the market after a sustained movement in one direction (either Bullish or Bearish).
The indicator is based on PRICE-ACTION ONLY and does not take into account the current state of the market (Bullish or Bearish).
Once the price moves in a particular direction for at least 14 bars , a line appears as shown in a previous screenshot. Once the price stops moving in that direction and begins moving in the opposite direction - and after a sustained run - a "signal" appears alerting the trader that a "potential" reversal could be on the horizon soon.
If price moves in one direction and plots both a line and a signal and then begins moving back in the other direction in a sustained manner, the original signal will remain even when a NEW line begins forming (the original line will disappear). (see below) This line will continue to move as the price continues to move. Not until a signal plots on the chart is the potential reversal forming. THE LINE DOES NOT SIGNAL A REVERSAL . Some traders, however, use this information to "ride the wave UP or DOWN" and exit their positions once the signal prints.
As shown below, optional input settings allow the trader to set the line at CLOSE or HIGH/LOW of the candle preceding the potential reversal.
It is suggested to use Close instead of High or Low but the setting allows one to use either.
As shown in the screenshot below, it is typical on LOWER TIME FRAMES to see the price pass the signal line. The Indicator works best on the 15 minute timeframe, as it gives the trader time to make the decisions required as the volatility is less on the 15 minute chart vs the 1 minute or 5 minute charts.
If you have any questions or suggestions for this indicator, please join our Discord. We offer free training on this Indicator on our Discord Server.

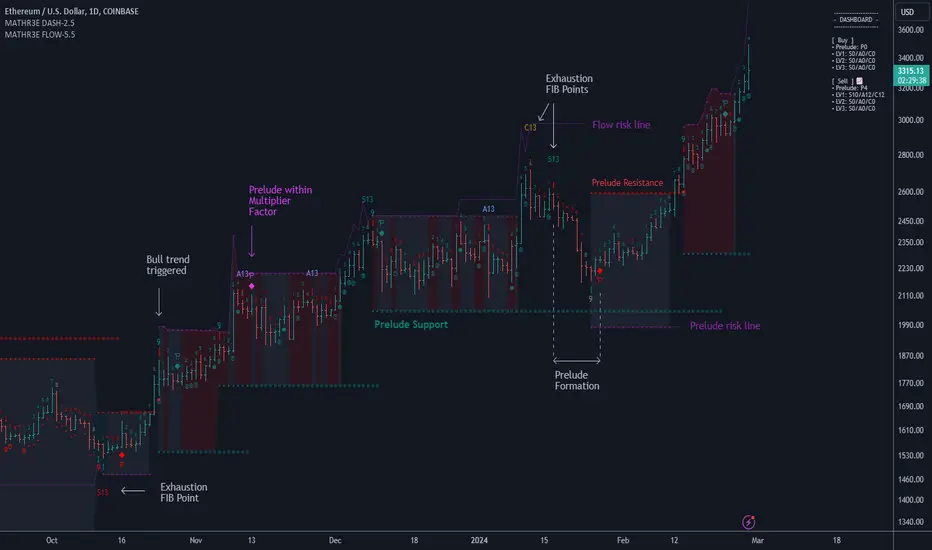
MATHR3E FLOW DASHBOARD█ OVERVIEW
MATHR3E Flow Dashboard is a market timing tool which aims to anticipate trend reversals and highlight potential low risk entries.
█ CONCEPTS
Disclaimer:
MATHR3E Flow Dashboard indicator is intended for advanced traders and may fit your profile, whether you are a day trader or a long-term investor.
It was originally developed by a renowned market analyst and documented in numerous books. Among them is the author Jason Perl.
It is recommended to have read the trading techniques mentioned in the books covering this indicator beforehand.
How to use:
Fibonacci Flow is a very complex tool, the purpose is not to detail it here but rather to introduce it briefly.
For a complete understanding, it is strongly recommended to read the books mentioned in the disclaimer section.
This indicator has two main components:
1 — The Prelude, which relies on momentum to define price ranges.
From a Price Reversal there must be nine consecutive closes;
each one less/greater than the corresponding close four bars earlier.
Preludes are numbered from 1 to 9. A complete Prelude occurs on bar 9.
It can be: Sharped / Flawed / Ignored / Extended
Cross over parameter can also evaluate the slowdown in a price trend's intensity and qualify the inception of Flow
2 — The Flow, which comes into play once the Prelude is complete.
They are trend based, and look for low-risk opportunities to fade established directional moves.
Flows are counts numbered from 1 to 13. There are 3 of them:
• SEQ: compares the current close with the low/high two bars earlier
• AGG: compares the current low/high with the low/high two bars earlier
• CMB: complex set of comparison with 2 available methods (not detailed here)
To handle the large amount of data to be displayed, they have been distributed over two indicators.
This indicator therefore works in pair with its companion: MATHR3E Flow Extension.
The distribution of the display is as follows:
Current indicator:
• Prelude points
• Markers for Extension preludes (E)
• Prelude Risk lines
• Flow Risk lines
• Prelude Trend Support and resistance
• Dashboard for supervision of ongoing counts
Companion indicator:
• Flow points
• Markers for Flows cancelation (X)
• Exhaustions points for:
• SEQ: up to 13 (Identify trend fading)
• AGG: up to 13 (For higher trading frequency)
• CMB: up to 13 (Identify prospective turning points following an abrupt price movement)
█ FEATURES & BENEFITS
Fibonacci Sequence
The number 13 is part of the Fibonacci sequence which is nature’s numbering system.
Exhaustion points
Potential exhaustion points emerge whenever the individual flows reach Fibonacci number 13.
These points may help traders to identify low-risk buy or sell opportunities.
Risk Lines
Once the trader has selected an entry point, the displayed risk lines should encourage the trader to remain disciplined and apply proper money management.
Position sizing remains the responsibility of the trader.
Available risk lines:
• buy/sell Preludes
• buy/sell Flows
Nested Flows
The indicator can track up to three nested Flows.
Renewing
During the path to reach point number 13, it is very common to trigger other Prelude in the same direction as the previously initiated trend.
MATHR3E Flow will address these potential market renewal with multiples options:
• Prelude range qualifiers
• Renewal Multiplier
Dashboard:
The dashboard makes it easier to monitor multiple buy and sell signals at the same time:
• Prelude: (P from 1 to 9) / Compares the current close with the corresponding close four bars earlier
• SEQ: (S from 1 to 13) / Compares the current close with the low/high two bars earlier
• AGG: (A from 1 to 13) / Compares the current low/high with the low/high two bars earlier
• CMB: (C from 1 to 13) / Requires four conditions to be satisfied simultaneously
Dashboard also provides the possibility to monitor up to 3 levels of flows
Alerts
The indicator also provides programmable alerts whose format can be adapted to be received on Discord servers
Configure your alerts and get notified on:
• Trend changes
• BUY or SELL P9
• BUY or SELL S13
• BUY or SELL A13
• BUY or SELL C13