RSI, SRSI, MACD and DMI cross - Open source codeHello,
I'm a passionate trader who has spent years studying technical analysis and exploring different trading strategies. Through my research, I've come to realize that certain indicators are essential tools for conducting accurate market analysis and identifying profitable trading opportunities. In particular, I've found that the RSI, SRSI, MACD cross, and Di cross indicators are crucial for my trading success.
Detailed explanation:
The RSI is a momentum indicator that measures the strength of price movements. It is calculated by comparing the average of gains and losses over a certain period of time. In this indicator, the RSI is calculated based on the close price with a length of 14 periods.
The Stochastic RSI is a combination of the Stochastic Oscillator and the RSI. It is used to identify overbought and oversold conditions of the market. In this indicator, the Stochastic RSI is calculated based on the RSI with a length of 14 periods.
The MACD is a trend-following momentum indicator that shows the relationship between two moving averages of prices. It consists of two lines, the MACD line and the signal line, which are used to generate buy and sell signals. In this indicator, the MACD is calculated based on the close price with fast and slow lengths of 12 and 26 periods, respectively, and a signal length of 9 periods.
The DMI is a trend-following indicator that measures the strength of directional movement in the market. It consists of three lines, the Positive Directional Indicator (+DI), the Negative Directional Indicator (-DI), and the Average Directional Index (ADX), which are used to generate buy and sell signals. In this indicator, the DMI is calculated with a length of 14 periods and an ADX smoothing of 14 periods.
The indicator generates buy signals when certain conditions are met for each of these indicators.
1) For the RSI, a buy signal is generated when the RSI is below or equal to 35 and the Stochastic RSI %K is below or equal to 15, or when the RSI is below or equal to 28 the Stochastic RSI %K is below or equal to 15 or when the RSI is below or equal to 25 and the Stochastic RSI %K is below or equal to 10 or when the RSI is below or equal to 28.
2) For the MACD, a buy signal is generated when the MACD line is below 0, there is a change in the histogram from negative to positive, the MACD line and histogram are negative in the previous period, and the current histogram value is greater than 0.
3) For the DMI, a buy signal is generated when the Positive Directional Indicator (+DI) crosses above the Negative Directional Indicator (-DI), and the -DI is less than the +DI.
The indicator generates sell signals when certain conditions are met for each of these indicators:
1) For the RSI, a sell signal is generated when the RSI is above or equal to 75 and the Stochastic RSI %K is above or equal to 85, or when the RSI is above or equal to 80 and the Stochastic RSI %K is above or equal to 85, or when the RSI is above or equal to 85 and the Stochastic RSI %K is above or equal to 90 or when the RSI is above or equal to 82.
2)For the MACD, a sell signal is generated when the MACD line is above 0, there is a change in the histogram from positive to negative, the MACD line and histogram are positive in the previous period, and the current histogram value is less than the previous histogram value. On the other hand, a buy signal is generated when the MACD line is below 0, there is a change in the histogram from negative to positive, the MACD line and histogram are negative in the previous period, and the current histogram value is greater than the previous histogram value.
3)For the DMI a bearish signal is generated when plusDI crosses above minusDI, indicating that bulls are losing strength and bears are taking control.
The indicator uses a combination of these four indicators to generate potential buy and sell signals. The buy signals are generated when RSI and SRSI values are in oversold conditions, while sell signals are generated when RSI and SRSI values are in overbought conditions. The indicator also uses MACD crossovers and DMI crossovers to generate additional buy and sell signals.
When a signal is strong?
The use of multiple signals within a specific timeframe can increase the accuracy and reliability of the signals generated by this indicator. It is recommended to look for at least two signals within a range of 5-8 candles in order to increase the probability of a successful trade.
Why it's original?
1) There is no indicator in the library that combine all of these indicators and give you a 360 view
2)The combination of the RSI, Stochastic RSI, MACD, and DMI indicators in a single script it's unique and not available in the libray.
3)The specific parameters and conditions used to calculate the signals may be unique and not found in other scripts or libraries.
4)The use of plotshape() to plot the signals as shapes on the chart may be unique compared to other scripts that simply plot lines or bars to indicate signals.
5)The use of alertcondition() to trigger alerts based on the signals may be unique compared to other scripts that do not have custom alert functionality.
Keep attention!
It is important to note that no trading indicator or strategy is foolproof, and there is always a risk of losses in trading. While this indicator may provide useful information for making conclusions, it should not be used as the sole basis for making trading decisions. Traders should always use proper risk management techniques and consider multiple factors when making trading decisions.
Support me:)
If you find this new indicator helpful in your trading analysis, I would greatly appreciate your support! Please consider giving it a like, leaving feedback, or sharing it with your trading network. Your engagement will not only help me improve this tool but will also help other traders discover it and benefit from its features. Thank you for your support!
Rsioversold

Reversal Finder by nnamWhat does this indicator do?
In short, this indicator looks for patterns using Relative Directional Strength and plots potential Reversal Areas on the chart. Candlesticks are shaded by a Gradient. This gradient is based on whether or not the market is currently experiencing a positive or negative sentiment.
In the screenshot below you can see that the market is experiencing positive sentiment, but also shows areas of possible resistance and reversal. The example shows the 1 minute timeframe which is very volatile and can show inconsistent results due to inherent volatility. It is recommended to trade the 15min timeframe or higher.
In the screenshot below we see the candle colors are varied with regards to shading. As moves become "stronger" in a particular direction, the candle colors actually switch from standard red/green to Pink and Yellow. This usually indicates an Oversold or Overbought condition.
In the example below, you can see that if an overbought condition no longer exists and the direction of the movement changes, a plotted arrow and line appear on the chart. This indicates a "potential" resistance or support area and "possibly" a reversal in price. (during strong trends, these are usually simple pullback areas and not reversals).
As seen in the screenshot below, an option to extend the lines is included (disabled by default in the settings). Turning this option ON allows the trader to better visualize potential resistance / support areas on the chart by extending the lines to the right.
Used in conjunction with other indicators, this indicator becomes a powerful confirmation tool for your arsenal.
Many settings are fully customizable including gradient color, bar color, line width etc.
I hope you enjoy the indicator and... HAPPY TRADING!

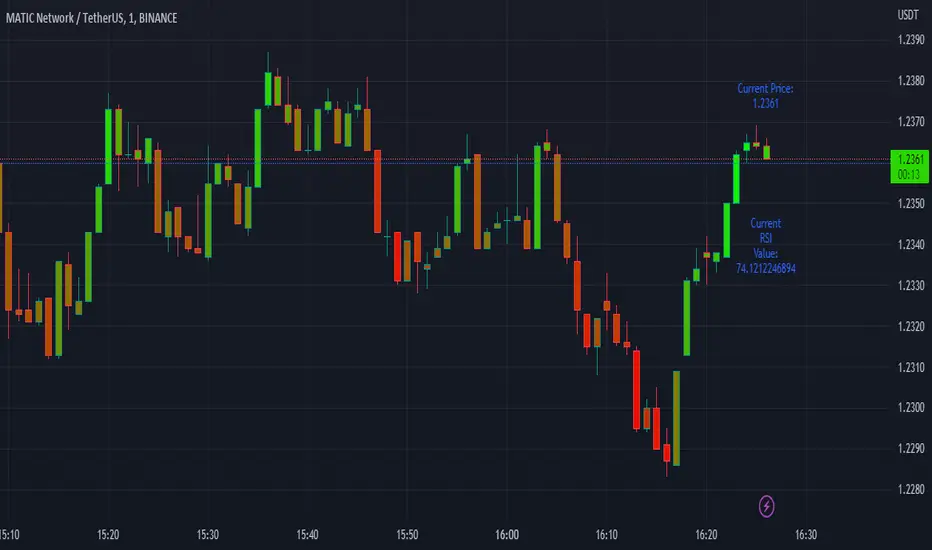
Easy RSI by nnamWhat Does this Indicator Do?
The Easy RSI Indicator color codes candles based on their RSI Value vs. Open / Close (Red / Green). It plots the current price and current RSI value on the chart in real-time. Additionally, when the RSI Value is in an oversold or overbought condition, it plots that signal on the chart in real-time.
The initial candle color is the standard Red / Green Tradingview color, but a Gradient is added to the color which either darkens or lightens the color based on the RSI Value.
As seen in the screenshot below, the higher the RSI Value, the brighter the Green Color is. The lower the RSI Value, the brighter the Red Color is.
The current Price and current RSI Value are both plotted on the chart by default, but can be optionally switched off by the trader.
As seen in the screenshot below, the prices and RSI Values are easily seen while visually tracking the price in real-time.
RSI Overbought Values are plotted when the Overbought condition is triggered. The Default is RED for Overbought and GREEN for Oversold.
As seen in the screenshot below, with all three labels turned on under the input settings (these are ON by default) you can see the overbought condition, the current RSI Value, and current price all in one centralized area. Oversold Values are also plotted when turned on under the input settings.
As shown in the screenshot below, the candle is GREEN (as evident by the green candle outline) but the RSI Value is low and shows lower than average relative strength. This turns the bar color ORANGE vs, GREEN showing that the relative strength of the move is subpar.
As shown on the screenshot below, if the trader has the standard Tradingview Price label switched on (in the Tradingview Chart Settings), the color of the bar is also translated to the price are for an easy to recognize RSI Value just by looking at the price. Even if the current candle is RED, when the RSI is higher than lower, the color will be green / greenish and even if the current candle is GREEN, when the RSI Value is lower than higher, the color will be red-ish / orange in color giving the user a quick view of RSI Value.
If you have any questions or feature requests for this Indicator please do not hesitate to reach out and ask.
GOOD LUCK trading!!
~nnamdert
RSI+ by Wilson (alt)Extension of the excellent RSI+ script by Wilsonlibero. I tweaked the parameters to better fit crypto markets, and I added a few more visuals, such as midline, overbought/oversold threshold lines and areas, background coloration depending on RSI trend above or below midline, and a few other tweaks especially colors (fixed the transp parameter deprecation for example). The color theme is by default more optimized for dark mode charts, but all colors can be configured, and all drawings can be enabled/disabled/tweaked in the parameters.
I'm just giving back to the community since I could modify this script only because it was open-source. If you like this script, please don't give me any credit, but please show some love to the original author Wilsonlibero:

Yasir Hameed Advance RSI IndicatorRELATIVE STRENGTH INDEX ( RSI )
This is a tool that is widely used
Especially for Overbought and Oversold systems, but I have made some changes in this indicator,
How to use it...!
I have set it as the default setting
- RSI Length: 7
- Overbought: 70
- Oversold: 30
What is unique about this tool?
we can see 3 conditions:
1) RSI Overbought / Oversold with Bullish Engulfing / Bearish Engulfing
2) RSI Overbought / Oversold with Hammer and Shooting Star
3) RSI Overbought / Oversold with 2 Bullish Bars / 2 Bearish Bars
4) RSI Overbought / Oversold with All Patterns at the same time
When the RSI reaches its Oversold line, the code will wait for Bullish Engulfing pattren, when oversold and Bullish engulfing matched, This indicator will generate a buy signal when the condition is met,
and same as for Bear market, When the RSI reaches its Overbought line, the code will wait for Bearish Engulfing pattren, This indicator will generate a sell/exit signal when the condition is met,
2nd condition is that a Hammer candle will be waited for when RSI touches the Overbought line, for Bullish Move
and Shooting Star candle will be waited for when RSI touches the Overbought line, for Bullish Move, for Bearish Move
3rd Condition is also the same as Condition 1 and Condition 2,
When the RSI reaches its Oversold line, the code will wait for 2 Bullish Bars, when oversold and 2 Bullish Bars matched then this indicator will generate a buy signal, and same as for Bear market,
When the RSI reaches its Overbought line, the code will wait for 2 Bearish Bars, when overbought and 2 Bearish Bars matched then this indicator will generate a Sell signal,
4th Condition is that we can use All Conditions at the same time,
- Bullish Engulfing / Bearish Engulfing
- Hammer and Shooting Star
- 2 Bullish Bars / 2 Bearish Bars

RSI - S&P Sector ETFsThe script displays RSI of each S&P SPDR Sector ETF
XLB - Materials
XLC - Communications
XLE - Energy
XLF - Financials
XLI - Industrials
XLK - Technology
XLP - Consumer Staples
XLRE - Real Estate
XLU - Utilities
XLV - Healthcare
XLY - Consumer Discretionary
It is meant to identify changes in sector rotation, compare oversold/overbought signals of each sector, and/or any price momentum trading strategy applicable to a trader.

MOD RSI [KPM]Using this indicator you can easily view Divergence, and Market Tend in Mutitimeframe
NOTE: This is stranded RSI I only added colours for easy cath the market trend.
I'm not regarding anything with this indicator. All risk is yours
Thank you

RSI Scalping & Swing Signals With AlertsThis RSI indicator shows a green or red ribbon when the smoothed RSI is bullish or bearish. It also includes a long moving average for overall trend confirmation. Wait until the ribbon holds above or below the long moving average and take positions in that direction.
To get an easier to read RSI indicator, I smoothed the RSI out and paired it next to a short term RMA. These two together form the ribbon that will show you early reversals and trend direction. The long moving average is used as an overall trend detector and confirmation for longer term trends.
***HOW TO USE***
Scalping: Enter longs when the ribbon turns green and enter shorts when the ribbon turns red. Exit positions when the ribbon turns the opposite color or crosses the long moving average.
Swing Trading: When the ribbon holds above the long moving average or breaks out and retests it, look for long positions and exit when the ribbon turns red or crosses the long moving average. When the ribbon holds below the long moving average or breaks down and retests it, look for short positions and exit when the ribbon turns green or crosses the long moving average.
***DETAILS***
This indicator gives early reversal signals very well and waiting for the RSI ribbon to cross the long moving average helps to get you into positions when the market is ready to really move while filtering out some of the noise.
The ribbon and background will change to green or red depending on whether it is currently bullish or bearish.
There is also a label that changes colors and tells you if RSI is bullish or bearish and also whether the RSI ribbon is above or below the long moving average.
Green or red circles will appear on the indicator when there is a bullish or bearish cross of the RSI ribbon and the long moving average.
It also has alerts that trigger when RSI is turning bullish/bearish or when the RSI ribbon is crossing the long moving average.
***CUSTOMIZATION***
Each piece of this indicator can be customized to suit your preferences including the RSI source, length, smoothing length, short moving average length and long moving average length. You can also turn off the labels, signals and long moving average. All of these settings can be managed within the indicator settings input tab.
***MARKETS***
This indicator can be used as a signal on all markets, including stocks, crypto, futures and forex.
***TIMEFRAMES***
This RSI Scalping & Swing Signals indicator can be used on all timeframes.
***TIPS***
Try using numerous indicators of ours on your chart so you can instantly see the bullish or bearish trend of multiple indicators in real time without having to analyze the data. Some of our favorites are Trend Friend Scalp & Swing Trade Signals, Volume Spike Scanner, Buy & Sell Pressure Volume Profile, and Momentum Scalper in combination with this RSI indicator. They all have real time Bullish and Bearish labels as well so you can immediately understand each indicator's trend.

Oversold RSI with Tight Stop-Loss Strategy (by Coinrule)KRAKEN:LINKUSD
This is one of the best strategies that can be used to get familiar with technical indicators and start to include them in your rules on Coinrule .
ENTRY
1. This trading system uses the RSI (Relative Strength Index) to anticipate good points to enter positions. RSI is a technical indicator frequently used in trading. It works by measuring the speed and change of price movements to determine whether a coin is oversold (indicating a good entry point) or overbought (indicating a point of exit/entry for a short position). The RSI oscillates between 0 and 100 and is traditionally considered overbought when over 70 and oversold when below 30.
2. To pick the right moment to buy, the strategy enters a trade when the RSI falls below 30 indicating the coin is oversold and primed for a trend reversal.
EXIT
The strategy then exits the position when the price appreciates 7% from the point of entry. The position also maintains a tight stop-loss and closes the position if the price depreciates 1% from the entry price. The idea behind this is to cut your losing trades fast and let your winners ride.
The best time frame for this strategy based on our back testing data is the daily. Shorter time frames can also work well on certain coins, however in our experience, the daily works best. Feel free to experiment with this script and test it on a variety of your coins! With our back testing data a trading fee of 0.1% is taken into account. The fee is aligned to the base fee applied on Binance, which is the largest cryptocurrency exchange by volume. In the example shown, this strategy made a handsome net profit of 52.6% on Chainlink with 66.67% of trades being profitable.
You can execute this strategy on your favorite exchanges with Coinrule .

MTF RSI ScannerThis RSI scanner can be use to identify the relative strength of 10 symbols over multiple timeframes
it will give you a quick overview which pair is more bearish or more bullish and also signals tops and bottoms in the AVG row
light red/green cell = weak bearish (RSI = 45-35) / bullish (RSI = 55-65)
medium red/green cell = bearish (RSI = 35-25) / bullish (RSI = 65-75)
dark red/green cell = strong bearish (RSI <= 25) / bullish (RSI >= 75)
gray cell = neutral (RSI= 45-55)
Usage
If AVG (average of all 4 timeframes) falls below 30, the cell will get green, indicating a good time to enter long (buy)
If AVG (average of all 4 timeframes) rises above 70, the cell will get red, indicating a good time to enter short (sell)
Use the "MTF RSI Scanner" in combination with the "MTF Stochastic Scanner"
to find tops (RSI MTF avg >=70 AND Stochastic MTF avg >= 80)
or bottoms (RSI MTF avg <= 30 AND Stochastic MTF avg <= 20)
Here is how the two MTF scanners looked on Nov 08 2021 (ATH) »
and here how the MTF scanners looked on June 21 2022
use TradingViews Replay function to check how it would have worked in the past and when not.
As always… there NOT a single indicator that can show to the top & bottom 100% every single time. So use with caution, with other indicators and/or deeper understanding of technicals analysis ☝️☝️☝️
Settings
You can change the timeframes, symbols, RSI settings, overbought/oversold levels and colors to your liking
Drag the table onto the price chart, if you want to use it as an overlay.
NOTE:
Because of the 4x10 security requests, it can take up to 1 minute for changed settings to take effect! Please be patient 🙃
If you have any idea on how to optimise the code, please feel free to share 🙏
*** Inspired by "Binance CHOP Dashboard" from @Cazimiro and "RSI MTF Table" from @mobester16 ***

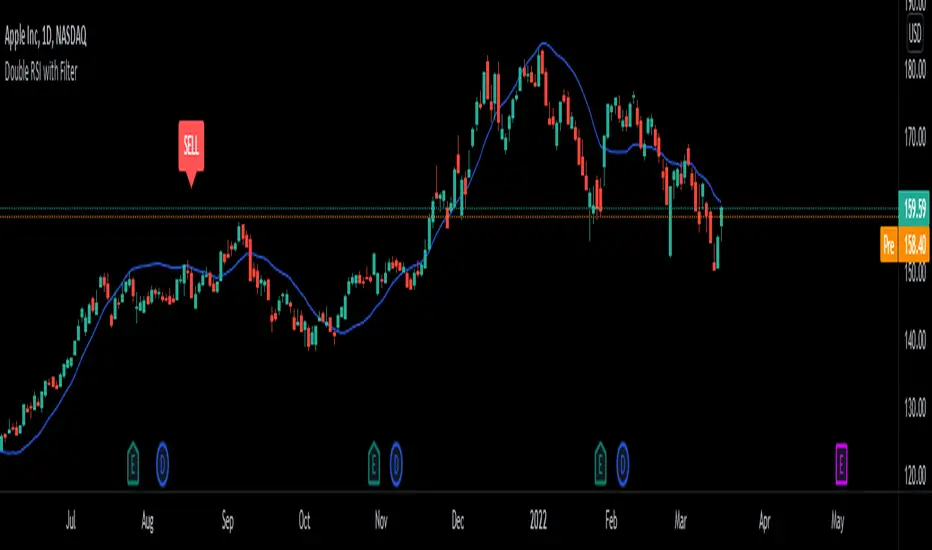
Double RSI/LSMA Double RSI uses a Slow RSI combined with a Fast RSI to generate Buy and Sell signals. Least Squares Moving Average is only here for filtering signals. It is very good on certain stocks or ETFs on longer timeframes for swing trading. If you get a Buy signal look at the LSMA trend and if the candle is above the LSMA. It works great for me on lower timeframes scalping futures and on higher timeframes swinging options. It is better than paying for Buy and Sell signals. Its my first script/indicator so play with it and see what you think. Let me know if you guys find anything that makes it better. Hopefully this helps some traders out there.
Supertrend + RSI Strategy [Alose]This strategy combines the best of both indicators (Supertrend & RSI).
As we know, Supertrend is excellent at finding changes in the market trend and thus finding the best entries, however in my opinion it has a great weakness and it is that it does not know how to find the best exit point.
For this reason I decided to combine it with the RSI that we know usually knows the highest and lowest rebound points of the price, thus managing to find the best exit point for the strategy.
The best thing about combining these 2 indicators is that our trades will obtain better profits in less time.
LONG ENTRY
When SuperTrend changes its direction and it is less than 0.
LONG EXIT
There are two ways to close the trade:
When RSI is overbought, you can choose the "Overbought Level " inside the strategy settings (Default: 72).
When SuperTrend changes its direction and it is grater than 0.
SHORT ENTRY (You can enable short entries in strategy settings)
When SuperTrend changes its direction and it is grater than 0.
LONG EXIT
There are two ways to close the trade:
When RSI is oversold, you can choose the "Oversold Level " inside the strategy settings (Default: 28).
When SuperTrend changes its direction and it is less than 0.

RSI - Dynamic Overbought/Oversold RangeDefault overbought/oversold levels of RSI does not hold good for instruments which are trending well. It happens often that instruments keep trading in single half of the range for prolonged time without even touching the other half. This also came up often in tradingview pine chat discussions where I participate regularly.
Hence, thought of creating this script to help other scriptors in finding different methods to derive dynamic high/low range of RSI. This can also be adopted for other range bound oscillators - though not inlcuded in this script.
⬜ Method
▶ Derive multitimeframe RSI. Parameters - Resolution, Source and Length are pretty straight forward. Repaint when unchecked uses previous bar value.
▶ Dynamic range detection follows below steps.
Get highest and lowest of the oscillator source for Range Length period.
Use Detection method further to refine the highest and lowest range. If detection method is "highlow", then it looks for lowest value for high range and highest value for low range. If not, uses moving average.
◽Note: Detection range length is used only for finding highest and lowest of Oscillator value ranges. Further detection range method of highlow and other moving average types use Oscillator length.

TIL Multi RSITrading Indicator Lab’s Multi RSI for TradingView is a powerful indicator that extends your capability to monitor RSI signals up to 20 different symbols all at the same time in just a single chart.
Eagle Eyes
The Multi RSI indicator can calculate the RSI of close prices of multiple symbols at any timeframe. This allows you to scan for RSI signals that may escape your search for potential good trading opportunities. It lets you choose the symbols you want to monitor for up to 20 slots and it INSTANTLY tells you which ones are overbought, oversold and even those that are at the verge of the buying or selling extremes in real-time so you can always be there when that big trend reversal happens.
Auto Sort
The symbols you add to the Multi RSI indicator are automatically sorted by their RSI readings from the most oversold down to the most overbought, each with a color assigned to them. Symbols that have an RSI reading of 50 and above are displayed in red while those below 50 are displayed in green. Those that breach the oversold and overbought signals are displayed in a brighter shade of color of red and green respectively. These colors are fully customizable in the indicator’s inputs.
Adjustable Oversold and Overbought Levels
The Multi RSI indicator uses the default 70/30 oversold-overbought levels but this can be easily adjusted in the Inputs section to match your preferences. The indicator’s color and alert system adjusts automatically to these changes.
Arrows
Beside each RSI reading is an arrow which gives you information about its trajectory, whether it is going up, down, or sideways. This is based on the last bar’s RSI value.
Alerts
The indicator lets you know when one or more symbols in the table crosses the oversold or overbought levels. These are predefined alert conditions that can be chosen in TradingView’s alert creation tool.
Available Alert Conditions
- Oversold – triggers when one or more symbols in the table are oversold
- Overbought – triggers when one of more symbols in the table are overbought
Inputs
- Length – sets the period of the RSI function to be applied to all symbols
- Oversold – sets the reference level for oversold signals (default level at 70)
- Overbought – sets the reference level for overbought signals (default level at 30)
- Symbol 1 – Symbol 20 – slots for TradingView symbols (charts) that you want to monitor
- Top Half Color 1 – the color of rows that are in the oversold level
- Top Half Color 2 – the color of rows that are 50 or above but not beyond the oversold level
- Bottom Half Color 1 – the color of rows that are in the overbought level
- Bottom Half Color 2 – the color of rows that are below 50 but not beyond the overbought level
- Position – sets where the indicator is displayed in the chart
- Font Size – sets the text size of the indicator
- Height – sets the size of each cell in the table. Size 0 means the height automatically adjusts to the chart’s size.

RSI Signals by HBRELATIVE STRENGTH INDEX (RSI)
This is a tool that is widely used
Especially for Overbought and Oversold systems, but I have made some changes in this indicator,
How to use it...!
I have set it as the default setting
- RSI Length: 7
- Overbought: 70
- Oversold: 30
What is unique about this tool?
we can see 3 conditions:
1) RSI Overbought / Oversold with Bullish Engulfing / Bearish Engulfing
2) RSI Overbought / Oversold with Hammer and Shooting Star
3) RSI Overbought / Oversold with 2 Bullish Bars / 2 Bearish Bars
4) RSI Overbought / Oversold with All Patterns at the same time
When the RSI reaches its Oversold line, the code will wait for Bullish Engulfing pattren , when oversold and Bullish engulfing matched, This indicator will generate a buy signal when the condition is met,
and same as for Bear market, When the RSI reaches its Overbought line, the code will wait for Bearish Engulfing pattren , This indicator will generate a sell/exit signal when the condition is met,
2nd condition is that a Hammer candle will be waited for when RSI touches the Overbought line, for Bullish Move
and Shooting Star candle will be waited for when RSI touches the Overbought line, for Bullish Move, for Bearish Move
3rd Condition is also the same as Condition 1 and Condition 2,
When the RSI reaches its Oversold line, the code will wait for 2 Bullish Bars , when oversold and 2 Bullish Bars matched then this indicator will generate a buy signal, and same as for Bear market,
When the RSI reaches its Overbought line, the code will wait for 2 Bearish Bars , when overbought and 2 Bearish Bars matched then this indicator will generate a Sell signal,
4th Condition is that we can use All Conditions at the same time,
- Bullish Engulfing / Bearish Engulfing
- Hammer and Shooting Star
- 2 Bullish Bars / 2 Bearish Bars

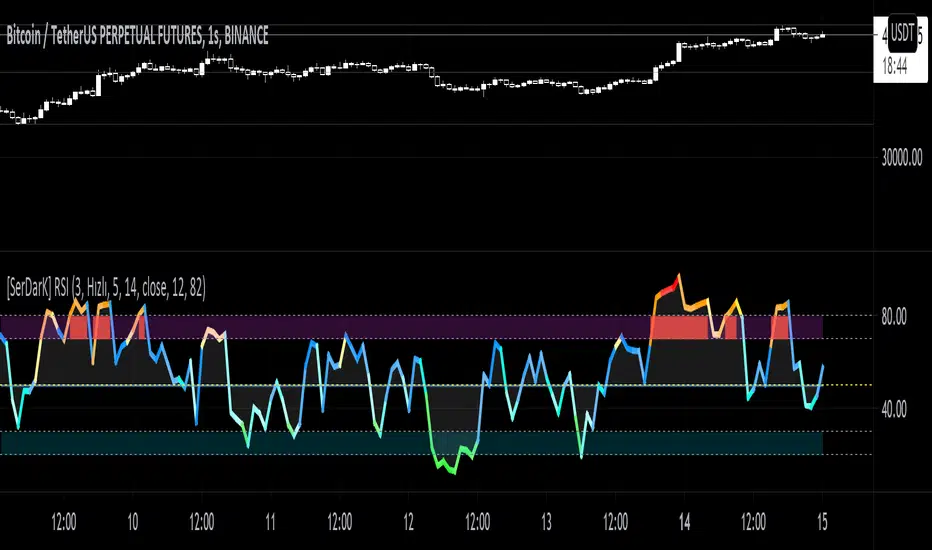
[SerDarK] RSI RSSEN: Coloring by levels, overbought, oversold, 50 level and RSS have been added to the classic RSI indicator. Two periods can be selected and almost all of the features can be adjusted from the settings.
TUR: Klasik RSI indikatörüne, seviyelere göre renklendirmeler, aşırı alım, aşırı satım, 50 seviyesi ve RSS eklenmiştir. İki periyotta seçim yapılabilmekte ve özelliklerin hemen hepsi ayarlardan düzenlenebilmektedir.
RSI Support & Resistance by DGTRSI Sᴜᴘᴘᴏʀᴛ & Rᴇꜱɪꜱᴛᴀɴᴄᴇ ʙʏ DGT
This experimental study attempts to translate Relative Strength Index (RSI) threshold levels of oversold/overbought and bull/bear zones as probable Price Support and Resistance levels
█ OPTIONS
Support & Resistance Levels , the main aim of the study. Level calculations are based on Relative Strength Index (RSI) threshold levels of oversold/overbought and bull/bear zones, where all threshold values are customizable through the user dialog box. Background of the levels can be colored optionally
RSI Weighted Colored Bars and/or Mark Overbought/Oversold Bars , Bar colors can be painted to better emphasis RSI values. Darker colors when the oscillator is in oversold/overbought zones, light colors when oscillator readings are below/above the bull/bear zone respectively, and remain unchanged otherwise. Besides the colors, with “Display RSI Overbought/Oversold Price Bars” option little triangle shapes can be plotted on top or bottom of the bars when RSI is in oversold/overbought zones
Example usage of the study with explanations
█ OTHERS
More regarding Support & Resistance concept (definition, identifying levels, trading S&R, etc) you are kindly invited to check my previous publication
Price Action - Support & Resistance by DGT
More regarding Relative Strength Index (RSI) and Relative Strength of Volume Indicators , please check Relative Strength of Volume Indicators by DGT
Disclaimer:
Trading success is all about following your trading strategy and the indicators should fit within your trading strategy, and not to be traded upon solely
The script is for informational and educational purposes only. Use of the script does not constitute professional and/or financial advice. You alone have the sole responsibility of evaluating the script output and risks associated with the use of the script. In exchange for using the script, you agree not to hold dgtrd TradingView user liable for any possible claim for damages arising from any decision you make based on use of the script

PT RSx RSIVersion 1.0 of our RSx RSI indicator was developed initially as a scalper. It helps determine a possible top/bottom for a specified time frame. The indicator is a modified version of the original RSI . We added a second line to help give you a visual on a bull/bear cross.
Bull crosses at the bottom of the range indicate that the current trend is trying to reverse & vice versa.
We also added a series of Fibonacci levels that act as pivotal areas. We have two highlighted areas that offer volatility . Our Red zone (upper fibs) should prompt you to look for short entries & our Grey zone (mid fibs), which acts as a neutral/range area.
This Oscillator was built around our buy sell indicator & it is used on all time frames for swinging & scalping. It is included as part of the library. Just message us for access!

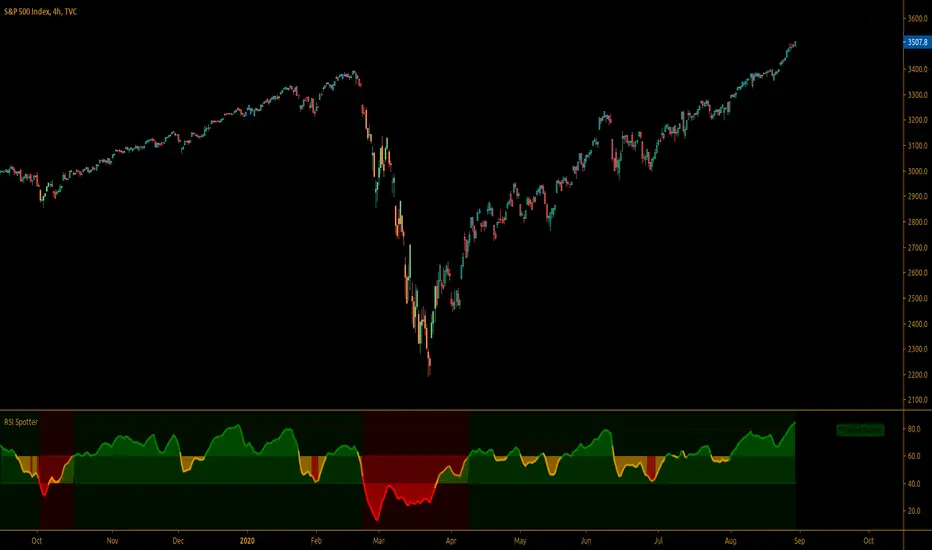
Simple RSI Spotter™TradeChartist Simple RSI Spotter is an elegant version of the classic RSI indicator and helps spot price trends using visually engaging and appealing RSI plot and background. The Bull and the Bear background fills are highly useful for traders who like to visually understand areas of entry and exit based on RSI .
===================================================================================================================
What does Simple RSI Spotter do?
Plots RSI with visually engaging colours for Bull and Bear zones (Green and Red) with optional background fill.
Plots RSI coloured bars on main chart based on user preferred Upper and Lower RSI band.
Plots RSI based on Zero-Lag EMA smoothing (1 for Regular RSI without smoothing).
Plots Heikin Ashi RSI if enabled from indicator settings.
Plots RSI highs of Bull Zone and RSI lows of Bear Zone. Helps visually spot divergences.
===================================================================================================================
Note:
Default Settings:
5 period EMA Smoothed Heikin Ashi RSI.
For normal RSI, uncheck, Heikin Ashi RSI and change EMA RSI Smoothing to 1.
===================================================================================================================
This is a free to use indicator.
===================================================================================================================
Stoch+RSI With Color Combination. Hello Everyone This Indicater Base on (RSI and Stoch) COMBINATION With Color Combination.
You Can also use for
1-Divergence.
2-Overbought.
3-Oversold.
4-Breakout.
5-Support & Resistance Zones.

VWAP Relative Strength Index [CC]This is a custom indicator of mine that uses the volume weighted average price instead of the close price as the source for calculations of the relative strength index. Buy when the indicator line is green and sell when it is red.
This was a custom request so let me know if there are any other scripts you would like to see me do or if you want something custom done!

Noro's BottomSensivity v0.6 strategy + rsi + AlarmThe original indicator is Noro's BottomSensivity v0.6
I simply turned noro's bottom sensibility 6.0 indicator, which I consider a great tool to find market bottom, into a strategy.
I also added an additional RSI filter with inputs that can be set by the user for entry and exit from the market.
I have tried to insert an alarm so that I can be notified when this particular purchase condition is formed.
I also tried to insert an additional filter that would allow me to make further pyramid purchases only after a certain percentage of drawdown from the first entry so as to reduce the average purchase price but I was not able ... if someone could implement this I would appreciate it.
Well..this is the first time that I try to program / modify a strategy / indicator, there are certainly some gross errors (as in my English too), please forgive me, I will appreciate the corrections that more experienced users will want to make.
I wish you all a good day, pfjons

CryptoSignalScanner - Advanced BUY/SELL indicatorDESCRIPTION:
This script has been designed to do some swing trading on 4 hour and daily candles.
After some adjustments it also gives a good result on the lower timeframes 5m, 15m and 1h.
• This scripts is based on RSI, Stoch RSI and some other indicator(s).
• It provides BUY, SELL, STRONG BUY and STRONG SELL labels when loading the script.
• It is also possibility to set a BUY, STRONG BUY, SELL, STRONG SELL, BUY/SELL or STRONG BUY/STRONG SELL alert.
HOW TO USE:
• When a BUY signal appears it means that the trading pair is oversold. Wait for the reversal to buy. Use the Fibonacci tool together with the Eliot Waves Theory to BUY or SELL or wait for the SELL signal.
• When a SELL signal appears it means that the trading pair is overbought. SELL immediately or use the Fibonacci tool together with the Eliot Waves Theory to SELL.
FEATURES:
• You can show/hide the labels based on RSI, Stoch RSI input values.
• You can show/hide the labels based on Stoch RSI K and R input values.
• You can show/hide the labels based on Stoch RSI K and R crossing.
• You can show only STRONG BUY or STRONG SELL labels.
• Etc...
HOW TO GET ACCESS TO THE SCRIPT:
• Use the link below to subscribe to our indicators.
• Based on this script we provide telegram channels that provides signals for all Binance BTC, ETH, USDT and BNB pairs.
REMARKS:
• This advice is NOT financial advice.
• We do not provide personal investment advice and we are not a qualified licensed investment advisor.
• All information found here, including any ideas, opinions, views, predictions, forecasts, commentaries, suggestions, or stock picks, expressed or implied herein, are for informational, entertainment or educational purposes only and should not be construed as personal investment advice.
• We will not and cannot be held liable for any actions you take as a result of anything you read here.
• We only provide this information to help you make a better decision.
• While the information provided is believed to be accurate, it may include errors or inaccuracies.
Good Luck,
The CryptoSignalScanner Team
