CCI+VIX+MACDWoodies CCI + VIX -3.72% + MACD
MACD is normalized from -400 to 400, so it is useful to watch with CCI .
If background color is green, VIX -3.72% shows fear.
If background color is red, VIX -3.72% shows not fear.
Search in scripts for "CCI"

CCI & MFI Strategy: No EMAAlternate version of
Published for client testing:
Changes
Removed EMA filtering logic from the script.

CCI Level Zero Strategy (by Marcoweb) v1.0Hi guys,
My strategy is ready :)
Finally the zero level of the CCI gives the start and stop to my positions. As you could notice, setting up the CCI length to 340 area on 1 minute chart will let the profit factor go up to 20% from an already wonderful 16%. This is a great result cause will let profitable trades run while stopping the wrong ones with a very limited loss. What makes our profit are not several small little positions that are clearly unrepitable in real trade but few and very profitable positions in which jumping in will be easier due to their length (71 bars average).
Please share with me your impressions and suggestions.
Have a nice trade :)

CCI+Hammer_5 mini am using a Hammer + CCI trading Strategy, which can determine the Long and Short postion

CCI+MACD+VWAP+BreakoutDesign for LONG and Day Trade only
- Identify buy and sell signal using CCI
- Green Zone when
-- Price over VWAP
-- EMA9 > EMA50 > EMA200
-- MACD fast > MACD slow
- Yellow Zone when either one failed
- White line occurs when breakout of Higher High + Higher Low

CCI MTF Ob+OsHello Traders,
This is a simple Commodity Channel Index (CCI) indicator with multi-timeframe (MTF) overbought and oversold level.
It can detect overbought and oversold level up to 5 timeframes, which help traders spot potential reversal point more easily.
There are options to select 1-5 timeframes to detect overbought and oversold.
Green Background is "Oversold" , looking for "Long".
Red Background is "Overbought" , looking for "Short".
Have fun :)

CCI Level ZoneThis strategy uses CCI 1000 as zones Buy sell if greater than level 100. will be seen as an uptrend If it's lower, it's a downtrend.
So we will use RSI. To trade in its zones, using the RSI crosses the level line, and when the RSI crosses the level line, it waits to buy with Stochastic.

CCI & EMA strategy by TradeswithashishThis strategy is extremely useful for positional traders or traders using timeframe 15-minute of higher. It uses following combo of values:
VWAP, CCI, Volume and Moving average (simple and exponential)
Caution:
Avoid taking trade if candle size is greater than twice the average candle size. for that wait for the retracement to near trailing stoploss

CCI/MFI/VZO/RSI - HEATMAPHeatmap I made/reverse engineered.
Currently tracks the 4 following oscillators:
- CCI (Channel Commodity Index)
- MFI (Money Flow Index)
- VZO (Volume Zone Oscillator)
- RSI (Relative Strength Index)
Any feedback or suggestions highly appreciated.
/* Inspiration taken from @ByzantineGeneral (TradingView profile: /u/ByzantineGeneral, indicator: /script/keAGdnWO-Byzantium-Oscillator-Heatmap) */

CCI Breakout TraderWorks well on Bitcoin or most altcoins on a 15min chart or higher.
What is this exactly?
This is an indicator that uses horizontal RSI + EMA lines with a CCI line on top of it to provide optimal entry and exit positions for trading. There is also a breakout indicator based on the width of Bollinger Bands.
How to use:
If the blue stream passes upwards on the red heading to the white - it's heading towards a good BUY signal. To be safe you wait until it passes above the white line, then BUY LONG. Another signal to buy long is when the blue stream passes above the white and green lines.
Selling is essentially the opposite, if the blue stream is passing down from the green or white lines, then it's time to sell and exit your trade.
If you need help knowing when to enter and exit a trade the indicator will draw a grey candle on your chart to signal it's time to exit a long trade and it will draw a purple candle when it's time to enter a long.
--
Breakout alert:
If you see a green vertical bar it's a warning that there is a potential breakout in price coming for whichever coin you are looking at. The price breakout could go either direction, so make sure you watch the blue stream.
--
Important tips:
The direction of the green/white/red lines are important - if they are heading down that means it might not be the best time to enter your trade, even if the blue stream crosses up on the red and/or white lines.
The colored horizontal lines are there to let you know if the blue stream is near the bottom of those lines (anywhere from hline 15 to 50) and heading upwards, you will more likely have a longer positive trade. If the blue stream is above 60 hline and it looks like a good trade (passing up on the red and white lines), expect to have a shorter trade.
I use this for swing trading various crypto currencies, once you learn how to read it, you can catch amazing uptrends really early and you can exit trades before some big drops happen.

CCI Indicator [SystemAlpha]This is a CCI indicator enhanced with:
- Show Alert
- Fill on oversold and overbought levels
- Show Regular and Hidden divergence
- Show Divergence Labels

CCI [SystemAlpha]This is a CCI indicator enhanced with:
- Show Buy and Sell Alert
- Fill on oversold and overbought levels
- Show Regular and Hidden divergence
- Show Divergence Labels
- Generate Alerts: Buy/Sell and Divergence


CCI Low/High DivergencesThis CCI Divergences indicator uses the candle low values to find bullish divergences and candle high values to find bearish divergences.

CCI CANDLE ICHIMOKU v1.0This indicator plots CCI candles with Ichimoku cloud and lines.
So you can get buy or sell signals like Ichimoku strategy system.
Your comments and suggestions will be greatly appreciated.
Good Luck,

CCI Divergence PointerThis script points regular and optionally hidden types of bullish and bearish CCI divergences on the chart by drawing the divergence lines and optionally labels.
Hidden divergence is disabled by default, it can be enabled over settings window.
Regular divergence is enabled by default, it can be disabled over settings window.
There is an option to display the price channel additionally.
Added alerts for all types of divergences.

CCI Fish netThis chart uses cci from 10 days to 200 days.
Green means cci10 is greater than cci200, red means opposite.
Enjoy!


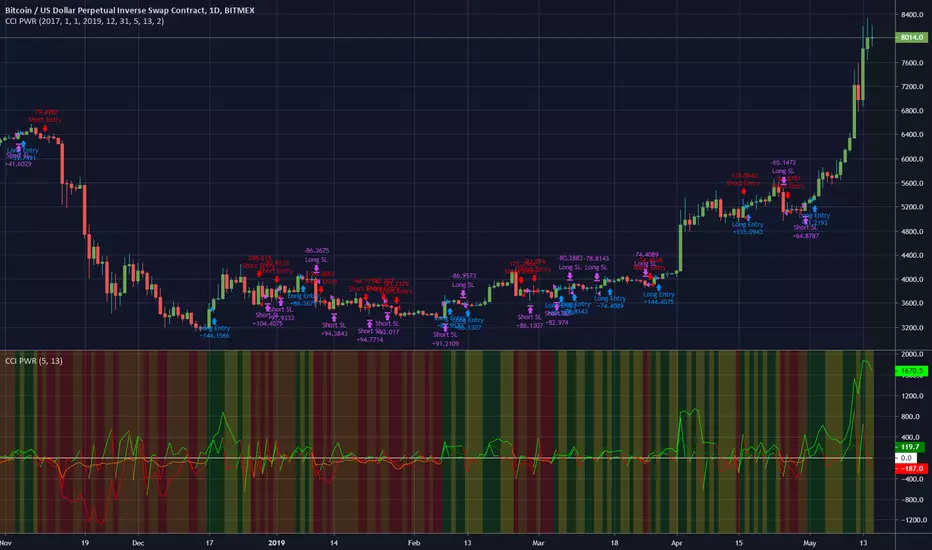
CCI PWRThis is a backtest for my CCI PWR indicator here . It works very well on a daily chart but may be useful for lower timeframes.
You can change the backtest settings to test different periods of time.
I have included a stop-loss function that will exit a trade if the price goes against the signals. The parameter is an integer that represents a %age of the current price, so for example, a value of 2 would mean a stoploss is set 2% below a long entry or 2% above a short entry.
Here is an image of ETH/BTC with the same settings.
Let me know if you find it useful!
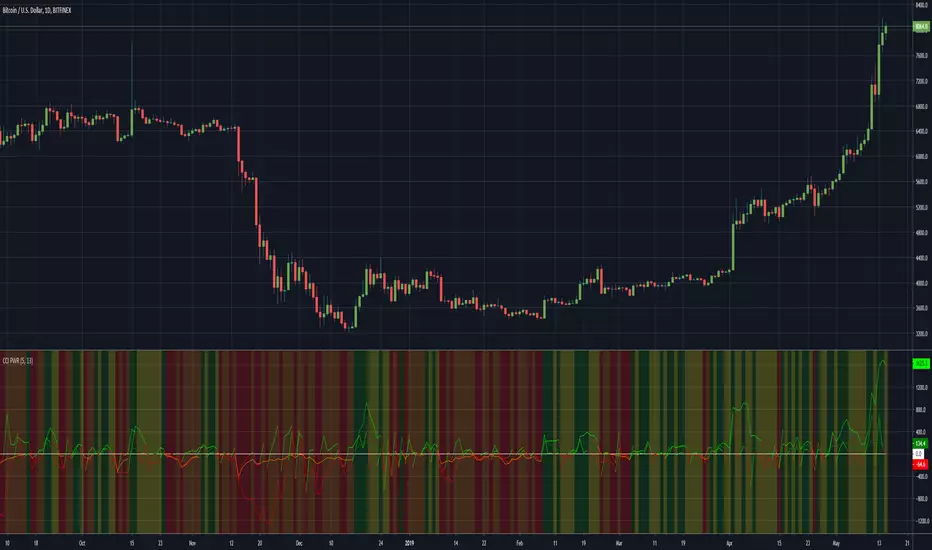
CCI PWRThis indicator is great for BTC/USD pairs and gives entry signals. I am just gauging interest at this point so message me if you like the indicator!
This is a leading indicator and gives signals early to get a good entry into long or short positions. It works best on a daily timeframe but can be useful on smaller timeframes too.
How to use:
If the background turns GREEN, this is a LONG SIGNAL
RED means SHORT SIGNAL
YELLOW means we should be LONG but there is no signal at this candle
ORANGE means we should be SHORT but there is no signal at this candle
You can adjust the Length or CCI length variables.